Primary health care services
Primary care is often the first contact a person has with the health system and can be delivered in a range of settings, by a range of providers. It may be provided by general practitioners (GPs) within general practice or in an aged care or community setting, or by public or private service providers.
Current and robust data on dementia-specific GP and community-based specialist services are a major data gap in Australia. Advances with data linkage now enable some examination of GP and other community-based medical specialist services utilised by people with dementia. This is possible by linking GP and specialist data with other datasets that have dementia diagnostic information. Data in this section are sourced from linked health and aged care services data in the National Health Data Hub (NHDH), previously referred to as the National Integrated Health Services Information (NIHSI) analytical asset. For more information about the NHDH please refer to the Technical notes.
While there is a lack of robust data on dementia-specific GP and community-based specialist services in Australia, the following data sources provide some insight on dementia-specific GP consultations:
- Bettering Evaluation of Care and Health survey (BEACH)
- NPS MedicineWise General Practice Insights report.
For more information on existing data gaps for dementia and future possibilities for filling in these gaps refer to the AIHW reports: Dementia data gaps and opportunities and the National Dementia Data National Dementia Data Improvement Plan 2023–33.
The analysis focused on people aged 30 and over who used a service in the linked data in 2020–21 and who were alive at the end of the 2020–21 financial year. These people were divided into two main groups:
- People with dementia: includes people who had a dementia diagnosis recorded in a hospital admission, emergency department presentation, permanent residential aged care record and/or were prescribed dementia-specific medication between 2010–11 and 2020–21.
- People without dementia: includes people who did not have a record of dementia in a hospital admission, emergency department presentation, permanent residential aged care record and were not prescribed dementia-specific medication between 2010–11 and 2020–21.
Both groups were further sub-divided to examine the different health service use of those living in residential aged care compared with those living in the community:
- Living in residential aged care: includes people who were living permanently in a residential aged care facility for all, or part of the year in 2020–21.
- Living in the community: includes people who were living in the community for all of the year in 2020–21. This may include people who used respite services in a residential aged care facility, as well as people who were living in other supported accommodation.
Results of this analysis should be interpreted with caution due to data limitations.
Dementia diagnostic information is not available in the MBS (Medicare Benefits Schedule data collection) and it is not possible to distinguish between dementia-specific services and services for the management of other health issues.
Identification of people with dementia depends on their use of other health and aged care services (for example, through admission to hospital and dementia being recorded in those data), and the analyses will not include all people with dementia in Australia.
For more information on key data considerations of this analysis, refer to the Technical notes.
The following section presents data on the use of Medicare-subsidised (referred to as MBS – Medicare Benefits Schedule) primary care services in 2020–21 for people living with dementia. Users can explore GP, nursing, specialist and allied health attendances.
For the underlying data presented in these pages, refer to the Primary health care services data tables.
Profile of people with dementia who used an MBS service in 2020–21
In 2020–21, there were 208,000 Australians identified as having dementia in the linked data (referred to as ‘people with dementia’). Of these people, 54% lived in permanent residential aged care and 46% lived in the community. Most people living with dementia identified in the linked data were women (66% of people in permanent residential aged care and 53% of people in the community).
It is known that the types and frequency of health services used change after a person enters permanent residential aged care. For example, general practitioner attendances increase and specialist attendances decrease (AIHW 2022). For this reason, data in this section are presented separately by place of residence.
For detailed breakdowns of the age, sex and place of residence for people included in this analysis, see table S7.1.
What MBS services were most commonly used by people with dementia?
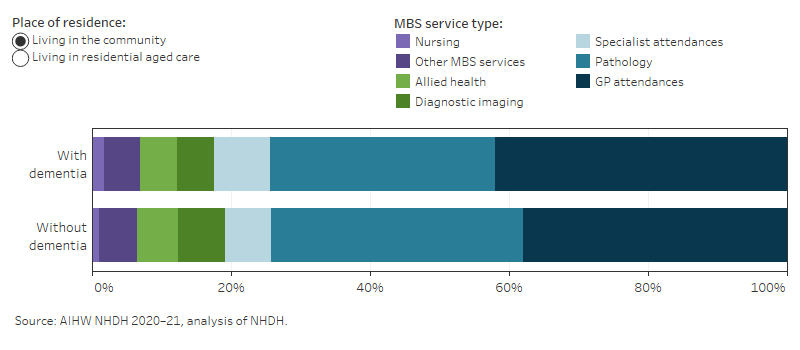
GP attendances were the most common MBS service used by people with dementia in 2020–21, followed by pathology services. These MBS services were the most commonly used by people with dementia within each sex and age group for both people living in the community and living in permanent residential aged care (Figure 7.1).
Figure 7.1: MBS services provided to people with dementia in 2020–21: percentage by place of residence
The stacked horizontal bar chart shows a higher proportion of GP attendance in people with dementia than people without dementia, both living in the community and in residential aged care.

Profiles of types of MBS service use
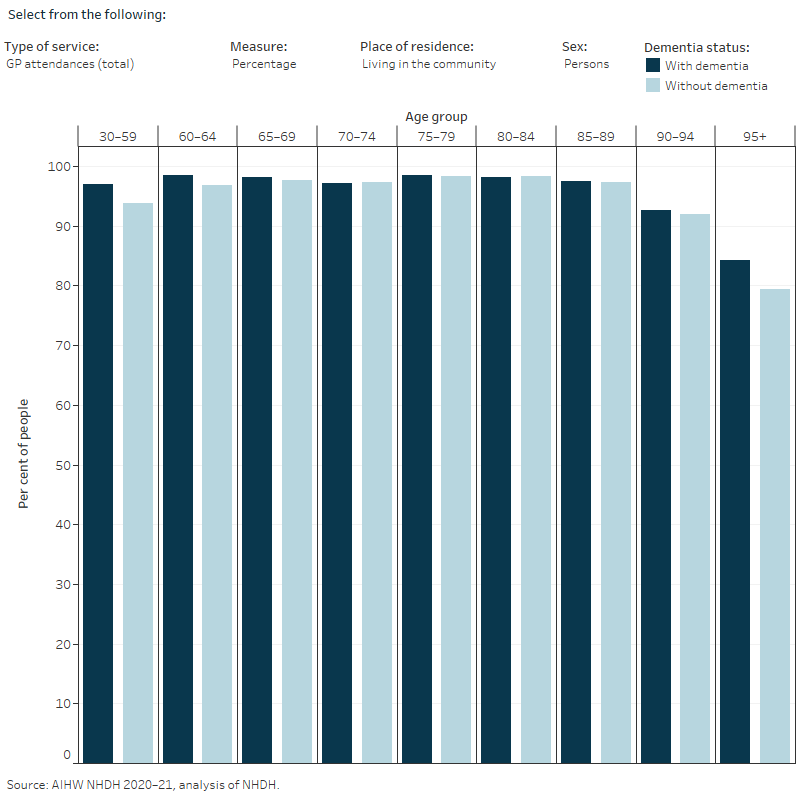
People with dementia living in the community used an average of 38 MBS services during 2020–21 compared to 22 services for people without dementia. People with dementia living in permanent residential aged care used an average of 45 MBS services, compared to 52 MBS services among people without dementia. Figure 7.2 provides a detailed breakdown of the types of MBS services used in 2020–21, including GP, nursing, specialist, allied health, pathology and diagnostic imaging attendances.
Figure 7.2: MBS service use by type of service, place of residence, sex and age
The vertical bar chart shows the MBS service use among people with and without dementia. The percentage of people who used a service, average number of services per person and total number of services are shown.

- Percentage of people who used a service: ‘Percentage’ is the proportion of people with at least one service recorded in the linked data in 2020–21. This is also referred to as a rate of service use.
- Average number of services per person: The average number of services per person was calculated for people who used the service at least once in 2020–21, referred to in the figures as ‘Mean (service users)’.
These measures reflect different aspects of access to services. For example, for people living in the community, more people living with dementia had one or more GP chronic disease management attendances than those without dementia in the age groups 30–80 years. However, among people who used the service, there was little difference in the average number of attendances.
Among people who were living in the community in 2020–21, key findings include:
- Among those who had one or more GP attendances, people with dementia on average had more GP attendances than people without dementia, and this difference was greater in the younger age groups. For example, among those aged 30–59, people with dementia had an average of 17 GP attendances per person compared to 7.3 for those without dementia.
- Half (51%) of people with dementia had a GP chronic disease management attendance compared with 24% of people without dementia (Table S7.2). The proportion of people with a GP chronic disease management attendance was higher than 37% for all age groups among people with dementia.
- Up to one third (32%) of people had a nurse attendance. The proportion was higher for people with dementia compared to without dementia in the younger age groups, and higher for people without dementia compared to people with dementia in the older age groups.
- A higher proportion of people with dementia had at least one specialist attendance (68%) compared to people without dementia (41%) (Table S7.2). This difference was greater in the younger age groups, such as those aged 30–59, where people with dementia who used specialist services at least once, had an average of 4.8 specialist attendances compared to 3.0 for those without dementia.
- Specialist attendances including general medicine, geriatric medicine, neurology and psychiatry were more common among people with dementia compared to people without dementia.
- For those aged under 80 years, allied health, nursing and pathology attendances were more common among people with dementia compared to those without dementia. For those aged 80 years and over, allied health, nursing and pathology attendances were similar or slightly lower for people with dementia.
Among people who were living in permanent residential aged care in 2020–21, key findings include:
- A similar proportion of people with dementia and people without dementia had a GP attendance (96% and 95%, respectively), and among those who had one or more GP attendances, the average number of attendances was also similar (Table S7.2).
- Specialist service use was lower among people with dementia compared to those without dementia, and this trend was consistent across all age groups.
- A higher proportion of people with dementia had geriatric medicine and geriatrician referred plan attendances compared to people without dementia.
- People with dementia typically had lower use of allied health services, pathology and diagnostic imaging compared to people without dementia.
- Across most age groups, people with dementia had a greater average number of nurse attendances than those without dementia. The difference was largest in the youngest age group, where people aged 30–59 with dementia had an average of 6.0 nurse attendances compared to 4.6 for people without dementia.
- The average number of psychiatry services was generally higher among people without dementia except for in the youngest and oldest age groups. People with dementia aged 30–59 had an average of 4.4 attendances per person compared to 3.8 for people without dementia, and 3.3 attendances for people with dementia aged 95 years and over compared to 2.6 for those without dementia.
Assessment and management plans
As there are no specific MBS items for dementia diagnosis and management services, a number of MBS items may be claimed by GPs and other specialists for services involved in diagnosing and managing dementia including:
- Geriatrician Referred Patient Assessment and Management Plans (MBS items 141–147; referred to in figure 7.2 as ‘Geriatrician referred plans’) are comprehensive assessment and management plan services provided by a consultant physician or specialist in geriatric medicine to patients who have been referred by a GP. These services are for patients aged 65 and over with complex health issues and who are at significant risk of poor health outcomes.
- Chronic Disease Management Items (MBS group A15; referred to in figure 7.2 as ‘Chronic disease plans’) are management plan services for people with chronic or terminal health conditions, or conditions that require care from a GP and at least 2 other health or care providers.
Note: As people get older some services, including allied health, can be accessed through My Aged Care which may mean less reliance on Chronic Disease Management items. This should be taken into consideration when comparing the number of Chronic disease plans by age groups in Figure 7.2.
These plans aim to provide comprehensive and up-to-date information on the patient’s health priorities, actions for patients to take to manage their condition/s and achieve their health goals, as well as information on health and community services available to the patient. In addition to assessing a patient’s current and past medical history, assessments may involve an assessment of physical, psychological (including cognition) and social function, as well as advanced care planning.
AIHW (Australian Institute of Health and Welfare) (2020–21) National Health Data System, aihw.gov.au, accessed 10 February 2024.
AIHW (2022) Younger onset dementia: new insights using linked data, AIHW, Australian Government, accessed 22 February 2024.


