Impact of COVID-19
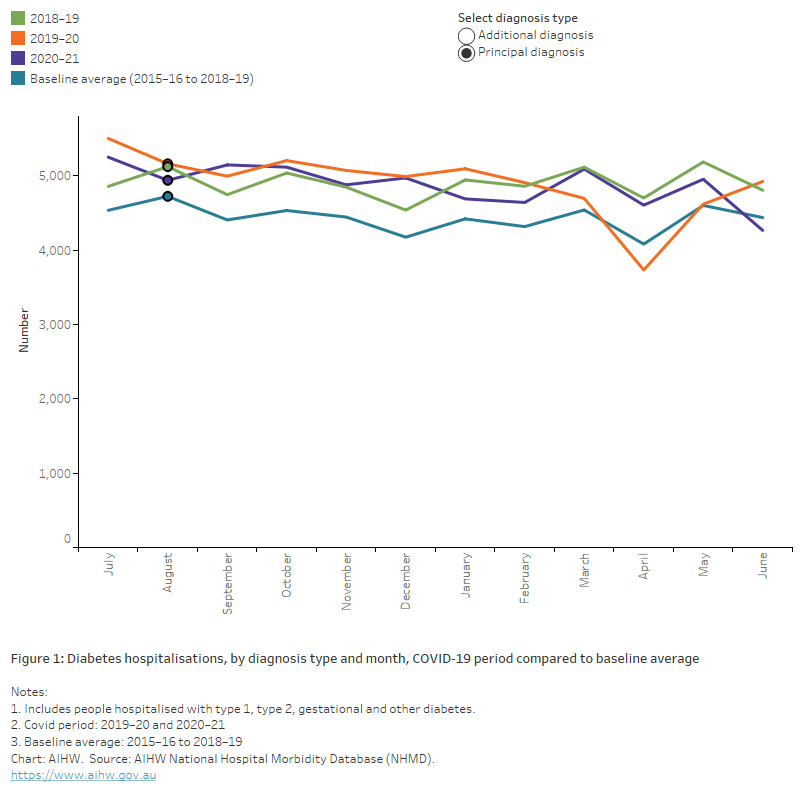
The chart shows the number of diabetes hospitalisations by diagnosis type and month between 2015–16 and 2019–20. Hospital separations fell in March–April 2020 for both principal and additional diagnosis of diabetes, with a more notable drop in hospitalisations with an additional diagnosis of diabetes.
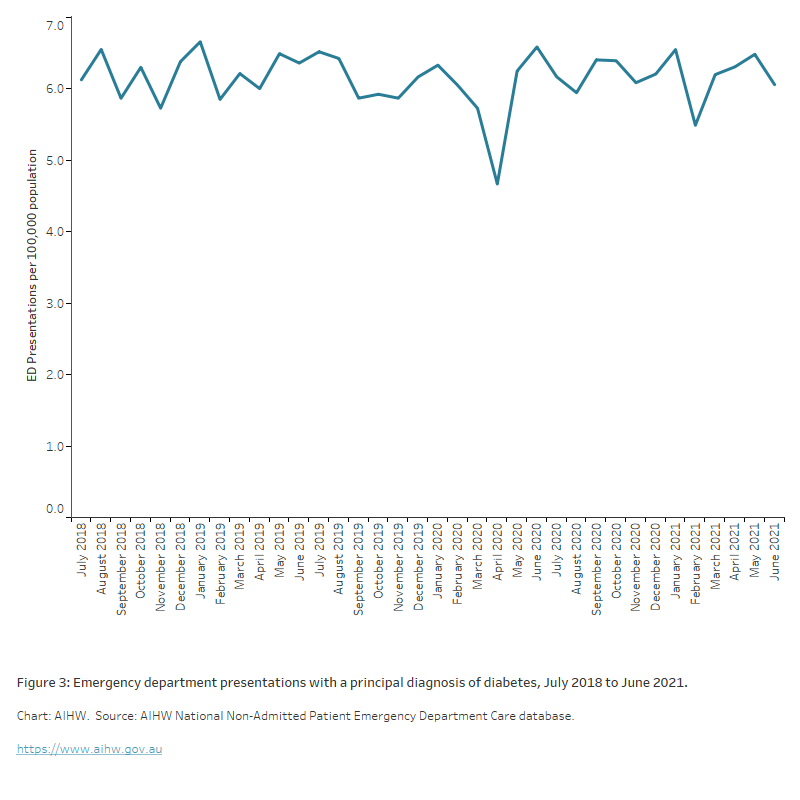
The chart shows emergency department (ED) presentations per 100,000 population by month between July 2018 and June 2021. The rate of presentations per 100,000 population ranged from a low of 4.7 in April 2020 to a high of 6.6 in June 2020.
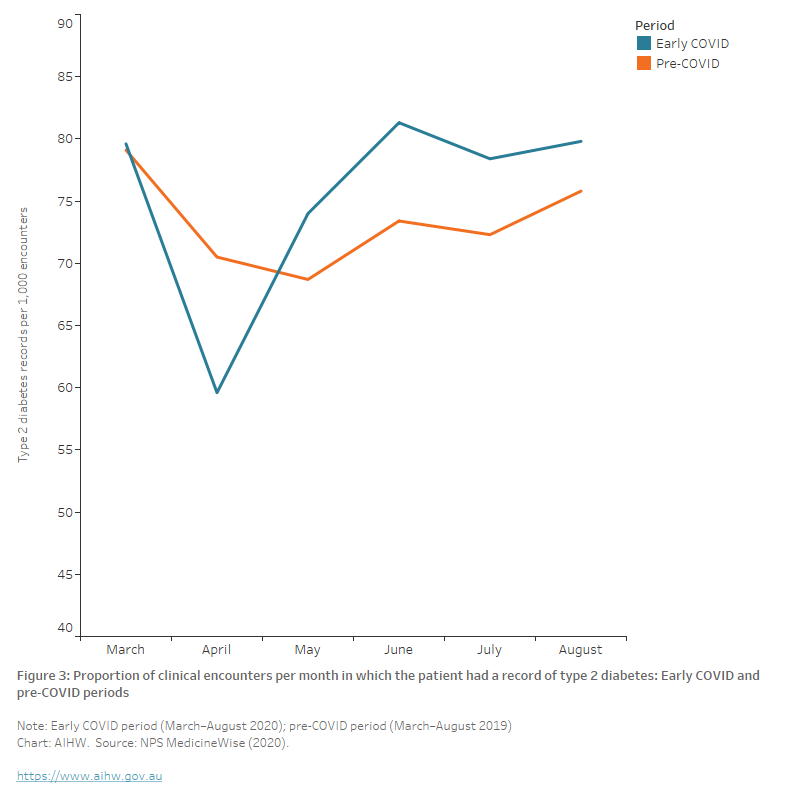
The chart shows the proportion of clinical encounters per month in which the patient had a record of type 2 diabetes during the early COVID and pre-COVID periods. The monthly rate of encounters where the patient had a record of type 2 diabetes fell from 79 to 60 per 1000 encounters in April 2020 before increasing to approximately 80 per 1000 encounters by June 2020, above the levels recorded in the equivalent pre-COVID period in 2019.
Allied health use
No data are available on the use of allied health services for people living with diabetes, but total attendance for the Australian population are available. According to the MBS:
- Overall allied health attendance increased during the early pandemic period, resulting in a 19% increase between 2019 and 2020.
- Optometry services decreased in April 2020 but had returned to the usual level of service provision by the end of August 2020 (though had not yet compensated for services not conducted in the earlier months). This led to an overall 8.1% fall in the number of services in 2020 compared with 2019 (AIHW 2021b).
Deaths
Australia recorded substantially lower-than-expected mortality during the first year of the COVID-19 pandemic in 2020 with decreases across key causes and most notably, deaths from respiratory disease. The mortality rate remained low during 2021 with the top 5 leading causes of death unchanged and coronary heart disease at the top of the list (ABS 2022).
However, well into the third year of the pandemic, to February 2023, ABS Provisional Mortality Statistics show that Australia had recorded a 15.3% increase in the total number of deaths (registered by 28 February 2023), compared to the baseline average (2017–2019 and 2021) (ABS 2023b).
Since the start of the pandemic, a total of 16,810 people have died with or from COVID-19 (registered by 31 March 2023). Of these, COVID-19 was the underlying cause of death for 80% (13,456 people) (ABS 2023a).
Diabetes deaths during COVID-19
There is international evidence that diabetes mortality has increased during the COVID-19 pandemic for other countries (Barron et al. 2020; Lv et al. 2022) and a growing number of studies showing that diabetes is an important risk factor in determining the clinical severity of COVID-19 due to weakened immune response and other factors (Erener 2020).
According to ABS Provisional Mortality Statistics, in 2022, doctor-certified deaths due to diabetes (registered by 28 February 2023) 19.2% above the baseline average (comprising the years 2017–2019 and 2021). The age-standardised diabetes death rate for 2022 was 10.5% higher than the baseline average (ABS 2023b).
Most COVID-19 deaths (96%) have other conditions listed on the death certificate (either pre-existing or conditions caused by COVID-19 and its complications). According to ABS COVID-19 Mortality in Australia, pre-existing chronic conditions were reported on death certificates for 10,850 (80.6%) of the 13,456 deaths due to COVID-19. Diabetes was a pre-existing condition in 15.7% of deaths that had a chronic condition listed on the death certificate (ABS 2023a).
Diabetes monitoring
Glycated haemoglobin, haemoglobin A1c or HbA1c, is the main biomarker used to assess long-term glucose control in people living with diabetes. Haemoglobin is a protein in red blood cells which can bind with sugar to form HbA1c. It is directly related to blood glucose levels and strongly related with the development of long-term diabetes complications.
Rate of HbA1c testing
According to NPS MedicineWise analysis of MedicineInsight, the rate of HbA1c tests among all regularly attending patients over the 6-months from 1 March 2020 to 31 August 2020 was not significantly different from the pre-COVID period (Table 1). However, the rate of HbA1c testing did fall significantly among regularly attending patients with a record of type 2 diabetes despite the rate of type 2 diabetes encounters remaining similar in both time periods. In the pre-COVID period, the average monthly rate of HbA1c testing among patients with a record of type 2 diabetes was 126.1 per 1000 clinical encounters, which fell to 109.0 tests per 1,000 clinical encounters in the COVID period (NPS MedicineWise 2020).
In April 2020, there was a significant decline in the rate of HbA1c tests performed. The rate of tests for all patients fell from 32 tests per 1,000 clinical encounters in April 2019 to 21 tests per 1,000 clinical encounters. The rate of testing for patients with a record of type 2 diabetes fell from 120 tests per 1,000 clinical encounters in April 2019 to 77 tests per 1,000 clinical encounters in April 2020 (NPS MedicineWise 2020).
|
1 March–31 Aug 2019 |
1 March–31 Aug 2020 |
p-value | |
|---|---|---|---|
| Rate of HbA1c testing (all patients) | 32.3 (29.8, 34.8) | 30.4 (5.0, 35.8) | 0.43 |
| Median all patients | 31.5 (Q1 30.6, Q3 33.1) | 32.1 (Q1 29.6, Q3 33.1) | - |
| Rate of HbA1c testing (type 2 diabetes patients) | 126.1 (118.6, 133.7) | 109.0 (92.1, 125.9) | 0.04 |
| Median (type 2 diabetes patients) | 123.7 (Q1 120.8, Q3 129.9) | 113.4 (Q1 111.3, Q3 115.4) | - |
| Rate of type 2 diabetes encounters | 73.3 (69.4, 77.2) | 75.4 (66.9, 84.0) | 0.57 |
| Median | 72.9 (Q1 70.5, Q3 75.8) | 79.0 (Q1 74.0, Q3 79.8) | - |
*Reported as the mean (per 1000 encounters) (95% CI); or median (quartiles)
Source: NPS MedicineWise (2020).
HbA1c testing frequency
Imai et al. (2020) studied the impact of COVID-19 on HbA1c monitoring using data from over 800 general practices (456 from Victoria and 347 from New South Wales) from January 2018 to December 2020. The volume of HbA1c monitoring in 2020 during the weeks of the first wave of COVID-19 (approximately March–May) decreased by 19.1% in New South Wales and 25.6% in Victoria, compared to the average volume of 2018–2019. Although it was not as large as the first wave, there was another fall in the total HbA1c testing volume in 2020 during the weeks of the second wave (approximately June–September).
The study also examined the number of patients living with type 2 diabetes who had records of HbA1c testing in both 2018 and 2019 (n=22,804 in Victoria, n = 15,399 in New South Wales) and their HbA1c testing frequencies. Approximately 14%–15% of these patients did not have HbA1c testing in 2020 (15.3% in Victoria, 14.1% in New South Wales). The number of patients who had multiple HbA1c tests also decreased in 2020 in both states (Figure 4).
Figure 5: Number of subgroup patients by HbA1c testing frequency. The subgroup patients were those who had records of HbA1c tests in both 2018 and 2019
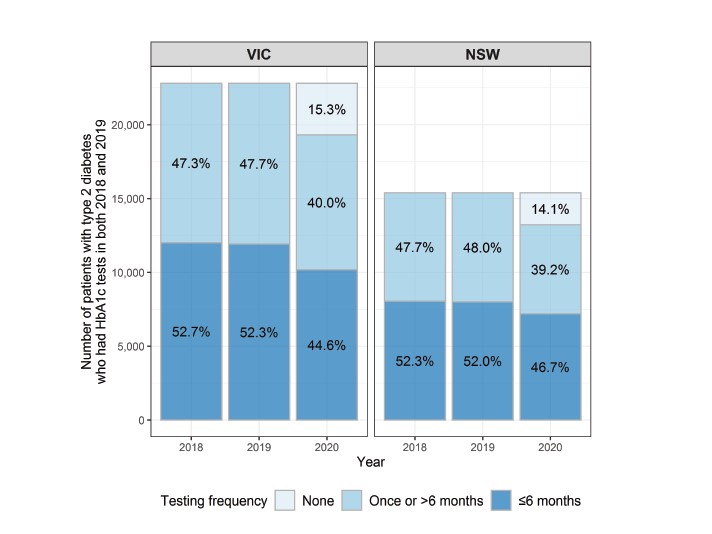
Source: Imai et al. 2020.
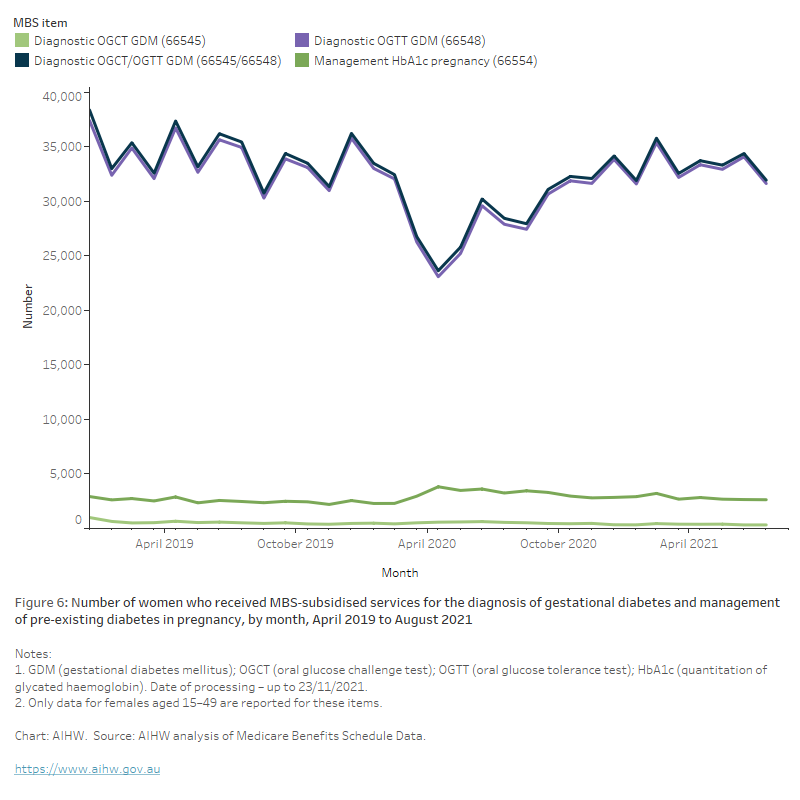
The chart shows the number women who received MBS-subsidised services for the diagnosis of gestational diabetes and management of pre-existing diabetes in pregnancy, by month, April 2019 to August 2021. There was a sharp decline in the number of women receiving the oral glucose tolerance test for the screening of gestational diabetes throughout April to June 2020 with an overall 11% drop in the annual numbers between 2019 and 2020 (from 184,000 to 163,000, respectively). By January 2021, the numbers had returned to pre-COVID levels.
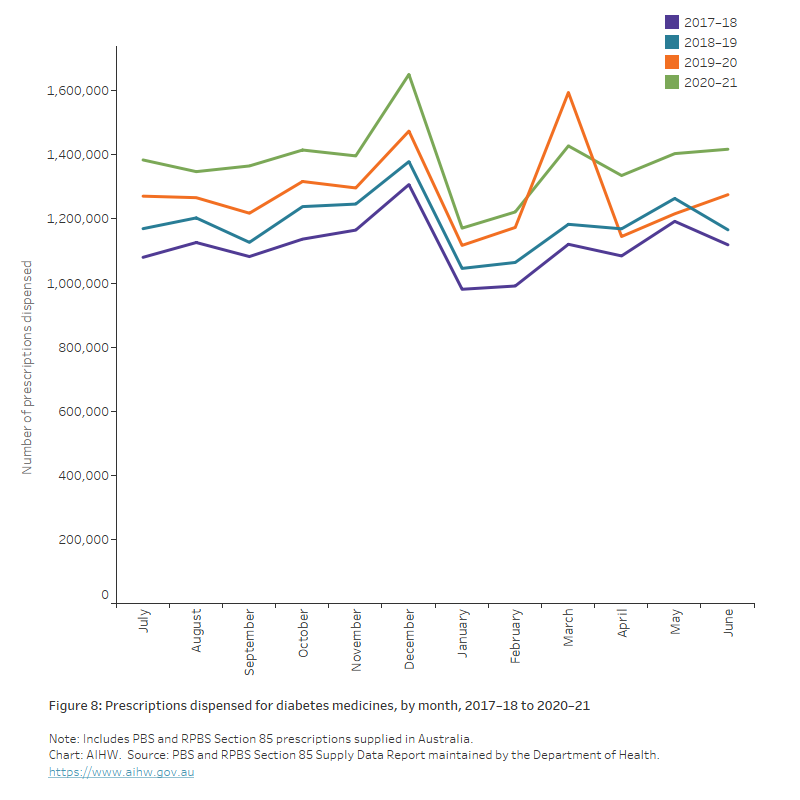
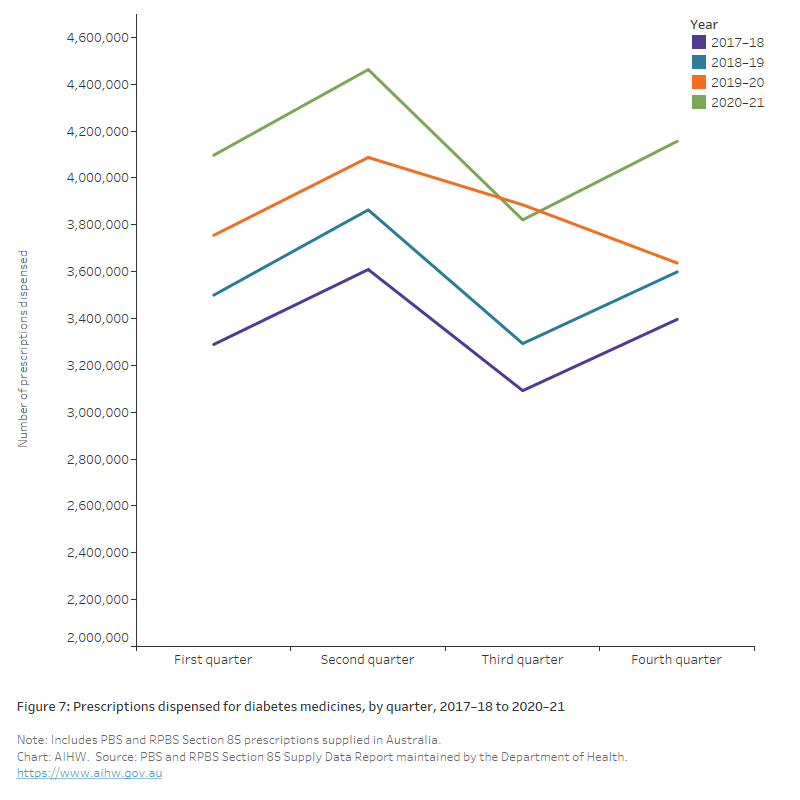
The chart shows the number of prescriptions dispensed for diabetes medicines by quarter between 2017–18 and 2020–21. During 2019–20 and 2020–21, 16.5 and 15.4 million scripts for group A10 were dispensed, compared with 14.3 million for 2018–19, a 7.8% increase from 2018–19 to 2019–20, and a 7.6% increase from 2019–20 to 2020–21.
The chart shows the number of prescriptions dispensed for diabetes medicines by month between 2017–18 and 2020–2021. An unusually high volume of diabetes scripts was dispensed in March 2020 (1.6 million), coinciding with the introduction of national restrictions, followed by a decrease in April 2020 (1.2 million).