All heart, stroke and vascular disease

Page highlights:

How many Australians have heart, stroke and vascular disease?

  • 1.2 million Australians aged 18 and over (6.2% of the adult population) were living with 1 or more conditions related to heart, stroke or vascular disease in 2017–18.

Hospitalisations

  • In 2020–21, there were 600,000 hospitalisations where cardiovascular disease was recorded as the principal diagnosis.

Variation among population groups

  • There were around 17,300 hospitalisations with a principal diagnosis of cardiovascular disease among Aboriginal and Torres Strait Islander people in 2020–21.

Deaths

  • In 2021, cardiovascular disease was the underlying cause of 42,700 deaths (25% of all deaths).
  • Between 1980 and 2021 the age-standardised cardiovascular disease death rate declined by around three-quarters.

How many Australians have heart, stroke and vascular disease?

An estimated 1.2 million Australians aged 18 and over (6.2% of the adult population) were living with 1 or more conditions related to heart, stroke or vascular disease, based on self-reported data from the ABS 2017–18 National Health Survey.

Age and sex

In 2017–18, based on self-reported data, the prevalence of heart, stroke and vascular disease among adults:

  • was higher among men (641,000, an age-standardised rate of 6.5%) than women (509,000, an age-standardised rate of 4.8%)
  • increased with age–more than 1 in 4 (26%) of persons aged 75 and over had heart, stroke and vascular disease (Figure 1).

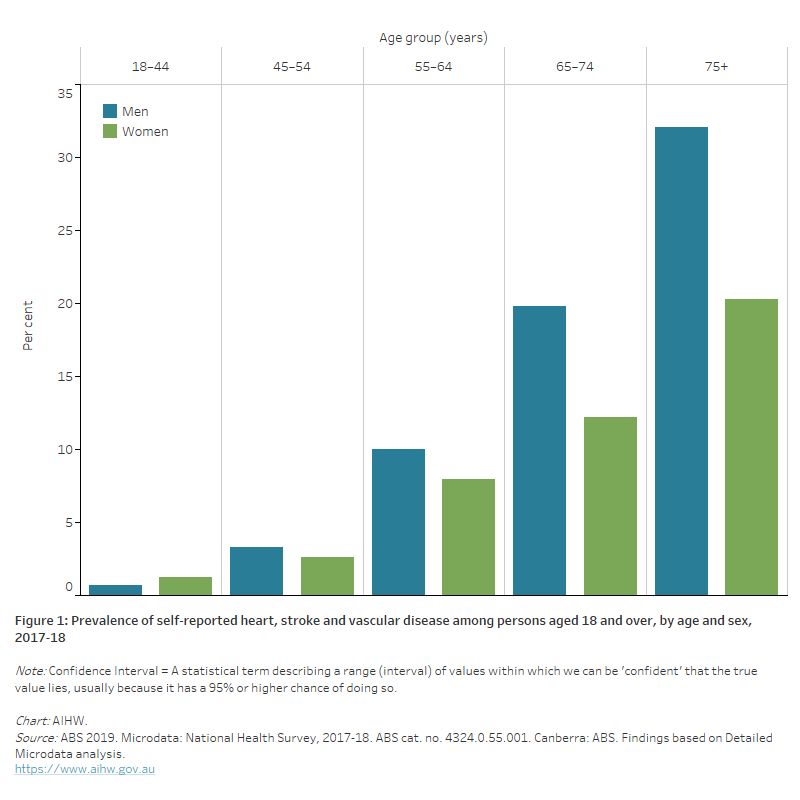
Figure 1: Prevalence of self-reported heart, stroke and vascular disease among persons aged 18 and over, by age and sex, 2017–18.

The bar chart shows the prevalence of self-reported heart, stroke and vascular disease by age group in 2017–18. Rates were highest among men and women aged 75 and over (32% and 20%).

Women and cardiovascular disease

Cardiovascular disease (CVD) is a leading cause of illness and death among Australian women. While more men than women have heart, stroke and vascular disease, the risk in women is largely under-recognised by the population (AIHW 2019). There are aspects of cardiovascular health that are unique among women, with important sex differences in prevention, diagnosis and treatment.

Increased awareness and recognition of these differences will help women avoid under-diagnosis, under-treatment, and under-estimating the risk of dying or becoming seriously unwell due to heart, stroke and vascular disease (World Heart Federation 2021).

More than half a million women have CVD

  • Based on self-reported data, an estimated 509,000 (5.4%) women aged 18 and over in Australia had 1 or more heart, stroke and vascular diseases in 2017–18.

A major cause of illness and death

  • Around 19,400 women had an acute coronary event (heart attack or unstable angina), and 18,500 women had a stroke in 2020
  • 250,000 hospitalisations of women with CVD in 2020–21
  • 21,000 women died from CVD in 2021, equivalent to 1 in 4 female deaths.

Indigenous women are disproportionately affected

  • Indigenous women were up to twice as likely as non-Indigenous women to have CVD in 2018–19, and to die from coronary heart disease or stroke in 2019–21.

CVD and other chronic conditions are key priorities in the National Women’s Health Strategy 2020–2030 (Department of Health 2019). Increased public awareness and education, investment in research, implementing evidence-based practice, and strategies to address equity issues have been identified as areas for action to improve the heart health of Australian women (Heart Foundation 2021).

For more information:

Cardiovascular disease in Australian women – a snapshot of national statistics, and Cardiovascular disease in women.

Kylie's story

‘I always thought that the typical candidate was someone who smoked, sported a beer belly, and had high blood pressure. I was a fit, young, non-smoking woman in my forties. A heart attack couldn’t happen to me – right?'

Kylie survived a heart attack and said cardiac rehab was a turning point in her recovery.

Learn more about Kylie's heart story

Variation among population groups

Aboriginal and Torres Strait Islander people

An estimated 42,000 Aboriginal and Torres Strait Islander adults (8.6%) had heart, stroke and vascular disease, based on self-reported data from the ABS 2018–19 Australian Aboriginal and Torres Strait Islander Health Survey (AIHW analysis of ABS 2019b).

After adjusting for different population age structures, the rate of heart, stroke and vascular disease among Indigenous adults was 2.1 times as high as that of non-Indigenous adults.

Indigenous men were 2.1 times as likely to report having heart, stroke and vascular disease as non-Indigenous men, as were Indigenous women (Figure 2).

Socioeconomic area

After adjusting for different population age structures, the prevalence of heart, stroke and vascular disease did not vary significantly between adults living in the most and least disadvantaged socioeconomic areas in 2017–18 (Figure 2).

Remoteness area

After adjusting for different population age structures, the prevalence of heart, stroke and vascular disease among adults did not vary significantly by remoteness area in 2017–18 (Figure 2).

Figure 2: Prevalence of self-reported heart, stroke and vascular disease, among persons aged 18 and over, by population group and sex, 2017–18

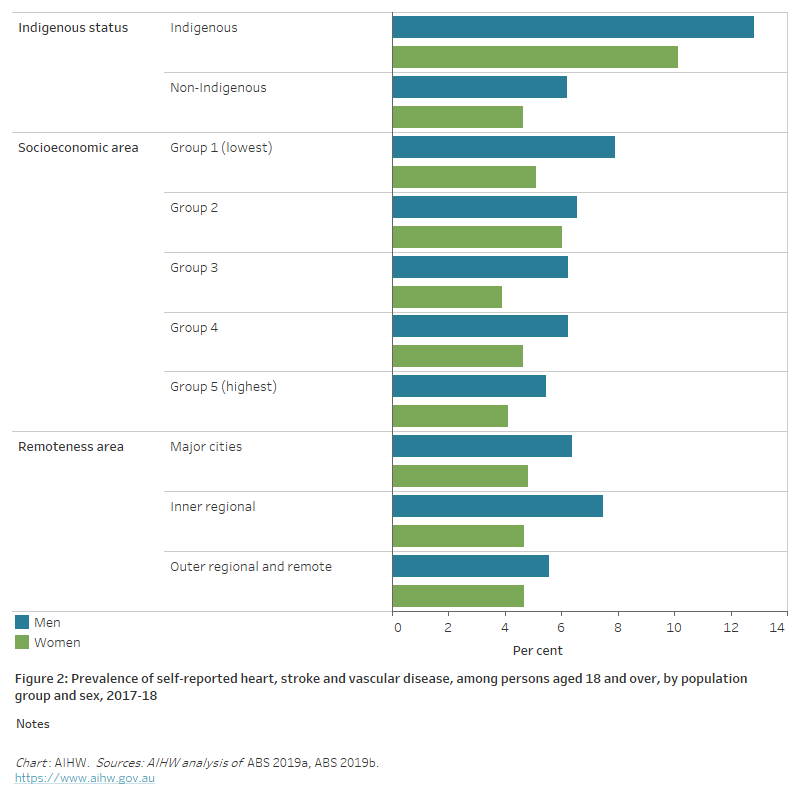
The horizontal bar chart shows that the prevalence of self-reported heart, stroke and vascular disease in 2017–18 was higher among Indigenous Australians, but did not vary significantly by socioeconomic or remoteness areas.

Hospitalisations

In 2020–21, there were 600,000 hospitalisations where CVD was recorded as the principal diagnosis, equivalent to 2,300 hospitalisations per 100,000 population. This represented 5.1% of all hospitalisations in Australia in 2020–21.

Of these, 542,000 (90%) were for acute care–that is, care in which the intent is to perform surgery, diagnostic or therapeutic procedures in the treatment of illness or injury.

Of all hospitalisations for CVD in 2020–21:

  • 27% had a principal diagnosis of coronary heart disease, followed by
  • atrial fibrillation (13%)
  • heart failure and cardiomyopathy (12%)
  • stroke (11%)
  • peripheral arterial disease (5.5%)
  • hypertensive disease (2.7%)
  • rheumatic heart disease (0.8%) (Figure 3).

Figure 3: Major causes of cardiovascular disease hospitalisations (principal diagnosis), by sex, 2020–21

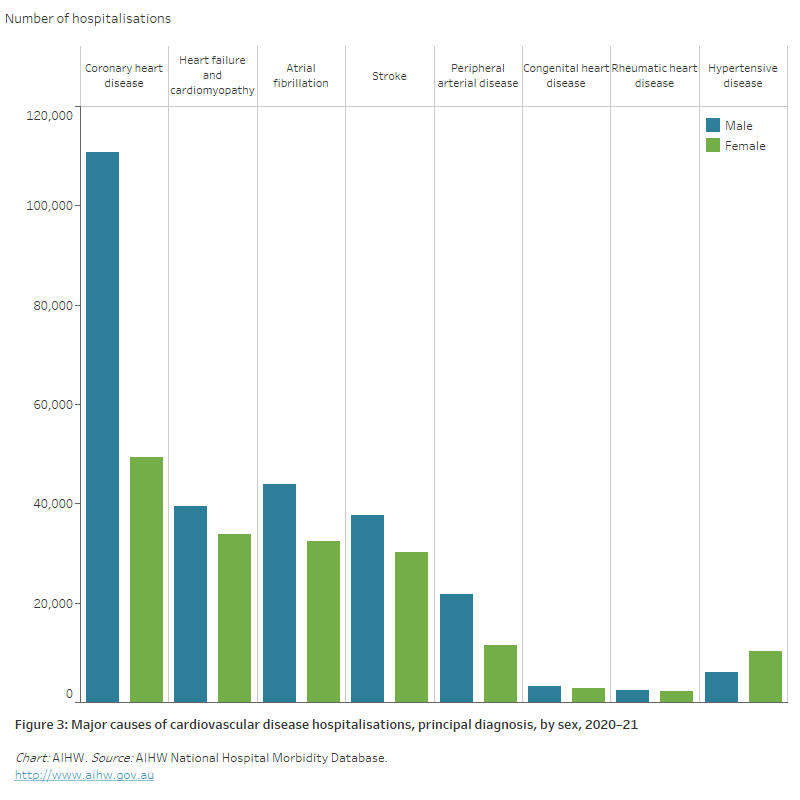
The bar chart shows the number of hospitalisations for selected cardiovascular diseases in 2020–21, ranging from 160,000 for a principal diagnosis of coronary heart disease to 4,600 for rheumatic heart disease.

Age and sex

In 2020–21, rates of hospitalisation with CVD as the principal diagnosis:

  • were 1.6 times as high for males compared with females, after adjusting for differences in the age structure of the populations. Age-specific rates were higher among males than females across all age groups (Figure 4)
  • increased with age, with over 4 in 5 (84%) CVD hospitalisations occurring in those aged 55 and over. CVD hospitalisation rates for males and females were highest in the 85 and over age group (20,200 and 15,700 per 100,000 population) –1.4 times as high as those in the 75–84 age group for males and 1.6 times as high among females (14,400 and 9,800 per 100,000) (Figure 4).

Figure 4: Cardiovascular disease hospitalisation rates, principal diagnosis, by age and sex, 2020–21

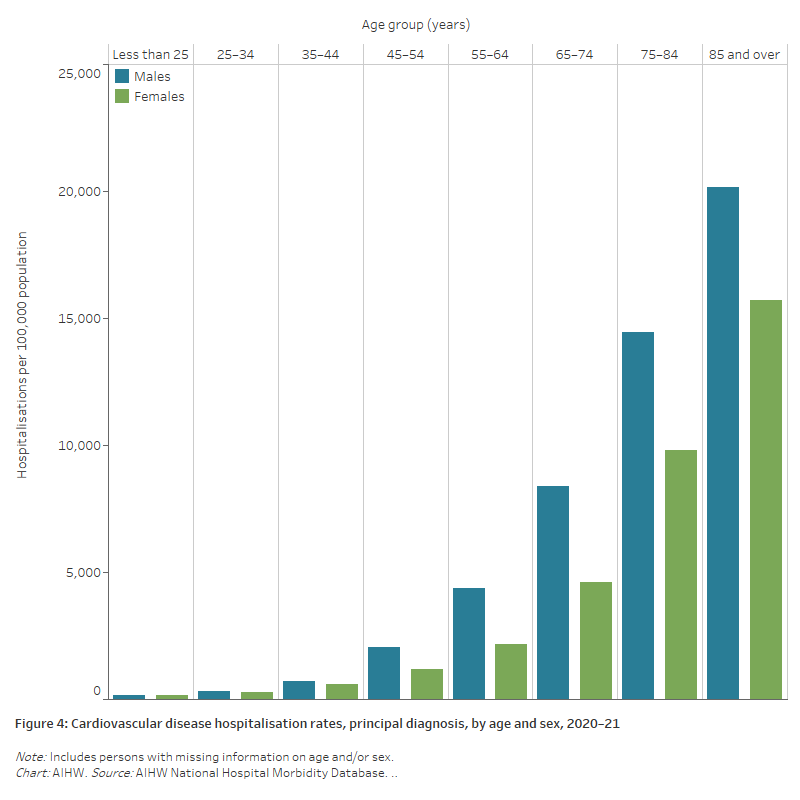
The bar chart shows cardiovascular disease hospitalisation rates by age group in 2020–21. These were highest among men and women aged 85 and over (20,200 and 15,700 per 100,000 population).

Trends

The number of acute care hospitalisations with CVD as the principal diagnosis increased by 38% between 2000–01 and 2020–21, from 393,000 to 542,000 hospitalisations.

Despite increases in the number of hospitalisations, the age-standardised rate declined by 16% over this period, from 2,070 to 1,740 per 100,000 population.

The rate of CVD hospitalisations for males was higher than for females across the period, with both showing similar declines (Figure 5).

Figure 5: Acute care cardiovascular disease hospitalisations rates, principal diagnosis, by sex, 2000–01 to 2020–21

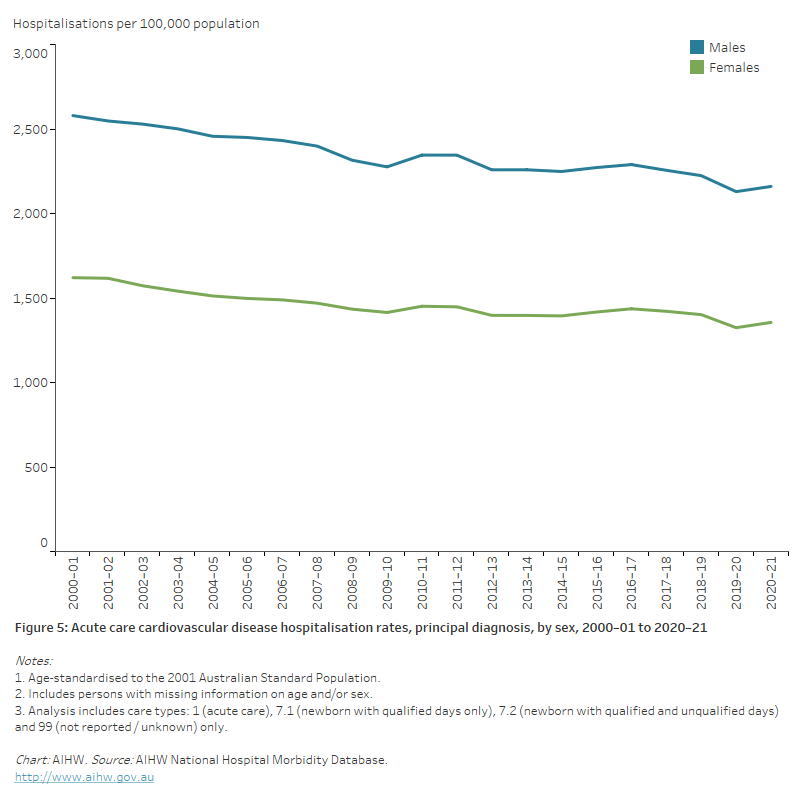
The line chart shows declines in age-standardised rates of male and female acute care CVD hospitalisations between 2000–01 and 2020–21, from 2,570 to 2,160 per 100,000 population for males, and from 1,614 to 1,356 for females.

Variation among population groups

Aboriginal and Torres Strait Islander people

In 2020–21, there were around 17,300 hospitalisations with a principal diagnosis of CVD among Aboriginal and Torres Strait Islander people – a rate of 2,000 per 100,000 population.

After adjusting for differences in the age structure of the populations:

  • the rate among Indigenous Australians was 1.8 times as high as the non-Indigenous rate
  • the disparity between Indigenous and non-Indigenous Australians was greater for females – 2.2 times as high  compared with 1.6 times as high for males.

Socioeconomic area

In 2020–21, the age-standardised CVD hospitalisation rate was 1.2 times as high for people living in the lowest socioeconomic areas compared with those in the highest socioeconomic areas.

This disparity between the lowest and highest socioeconomic areas was greater for females than males (1.2 and 1.1 times as high, respectively) (Figure 6).

Remoteness area

In 2020–21, the age-standardised CVD hospitalisation rate was 1.4 times as high for people living in Remote and very remote areas compared with those in Major cities.

This largely reflects disparities in female rates (1.5 times as high)―for males the difference was smaller (1.2 times as high).

Higher hospitalisation rates in Remote and very remote areas are likely to be influenced by the higher proportion of Aboriginal and Torres Strait Islander people living in these areas, who have higher rates of CVD than other Australians.

CVD patients are often transferred from a local regional hospital to a larger urban hospital where more intense or critical care can be provided. In 2020–21, 19% of CVD hospitalisations (principal and/or additional diagnosis) in Remote and very remote areas were transferred to another acute hospital, compared with 16% in Outer regional areas, 14% in Inner regional areas and 9% in Major cities.

The higher rates of transfers are often necessary because certain cardiac procedures, such as angiograms and cardiac revascularisation, are generally performed in large hospitals, which are predominantly located in urban areas.

Figure 6: Cardiovascular disease hospitalisation rates, principal diagnosis, by population group and sex, 2020–21

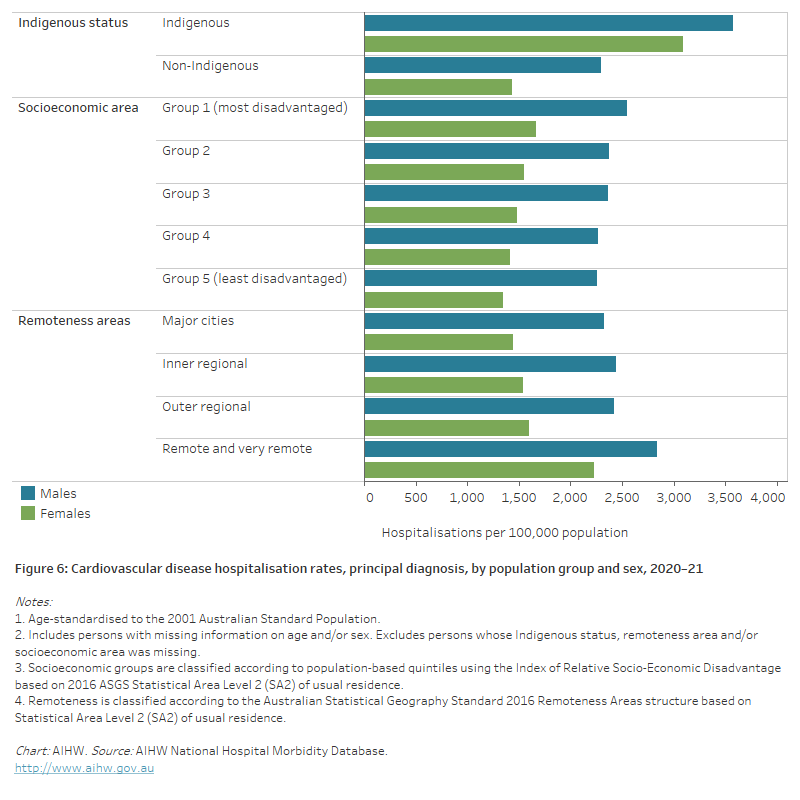
The horizontal bar chart shows that male and female CVD hospitalisation rates in 2020–21 were higher among Indigenous Australians, people living in the lowest socioeconomic areas, and people living in remote and very remote areas.

Deaths

In 2021, CVD was the underlying cause of 42,700 deaths (25% of all deaths), a rate of 166 per 100,000 population.

CVD was the second leading cause of death group in 2021 behind cancers (30% of all deaths), but ahead of diseases of the respiratory system (7.9%), external causes (6.8%), mental and behavioural disorders (6.6%) and diseases of the nervous system (6.5%).

Where CVD was listed as the underlying cause of death in 2021:

  • 41% were due to coronary heart disease
  • 20% were due to stroke
  • 11% were due to heart failure and cardiomyopathy
  • 5.7% were due to hypertensive disease
  • 5.7% were due to atrial fibrillation
  • 4.5% were due to peripheral arterial disease
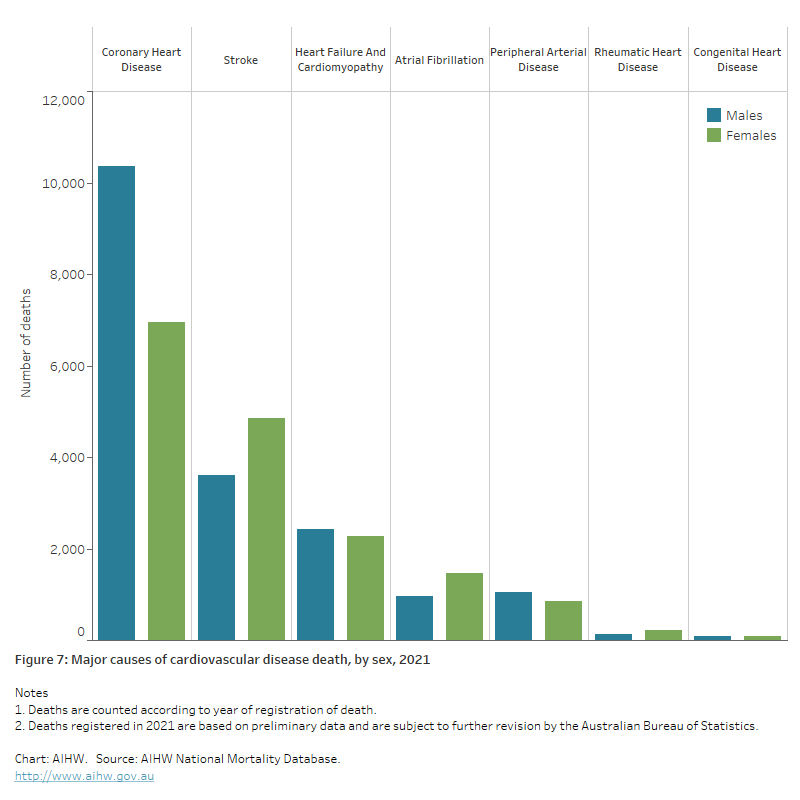
  • 0.8% were due to rheumatic heart disease (Figure 7).

Figure 7: Major causes of cardiovascular disease death, 2021

The bar chart shows the number of deaths from selected cardiovascular diseases as an underlying cause in 2021, ranging from 17,300 for coronary heart disease to 340 for rheumatic heart disease.

Age and sex

In 2021, CVD death rates:

  • were 1.4 times as high for males as for females, after adjusting for differences in the age structure of the population. Age-specific rates for males were higher than females across all age groups
  • increased with age, with over half (52%) of CVD deaths occurring in persons aged 85 and over. CVD death rates for males and females were highest in those aged 85 and over (4,300 and 4,100 per 100,000)―4.6 times as high for males and 6.7 times as high for females aged 75–84 (Figure 8).

Figure 8: Cardiovascular disease death rates, by age and sex, 2021

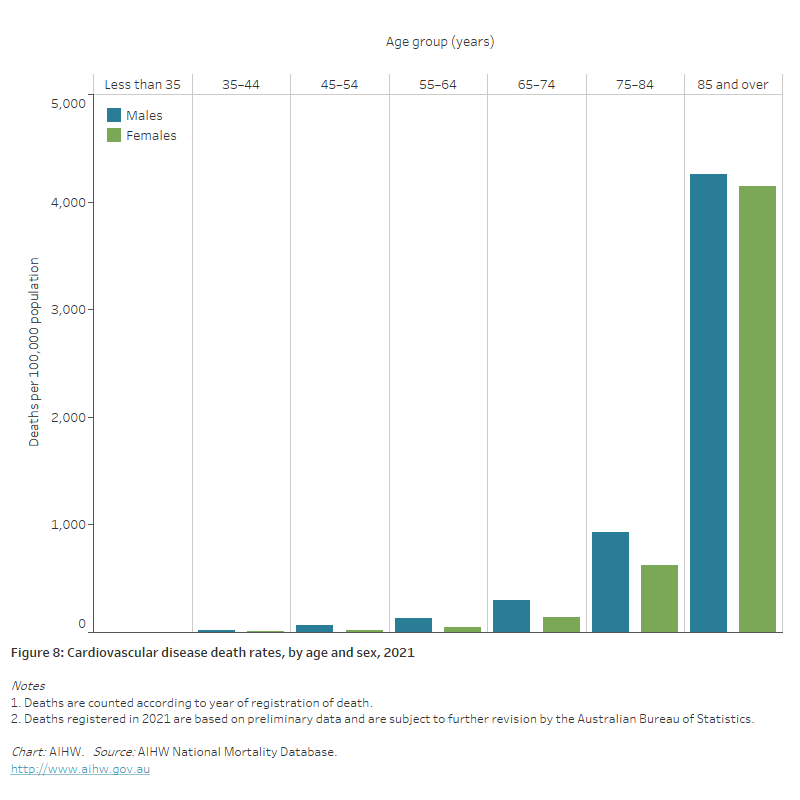
The bar chart shows cardiovascular disease death rates by age group in 2021. These were highest among men and women aged 85 and over (4,300 and 4,100 per 100,000 population).

Trends

Since its peak in the late 1960s, the CVD death rate has declined substantially, and the gap between males and females has narrowed.

The main driver of this decline was the large fall in coronary heart disease deaths, accompanied by falling rates of cerebrovascular disease deaths.

The large fall represents a public health success, which can be attributed to both prevention and treatment– a combination of reductions in risk factor levels, clinical research, improvements in detection and secondary prevention, and advances in treatment and care (AIHW 2017).

Between 1980 and 2021:

  • the number of CVD deaths declined by 23%, from 55,800 to 42,700
  • age-standardised CVD death rates declined by around three-quarters–falling from 700 to 144 per 100,000 population for males and 452 to 102 per 100,000 for females (Figure 9).

Although CVD death rates have fallen for all age groups in Australia, the rate of decline in younger age groups has slowed in recent decades (AIHW 2017).

Figure 9: Cardiovascular disease death rates, by sex, 1980–2021

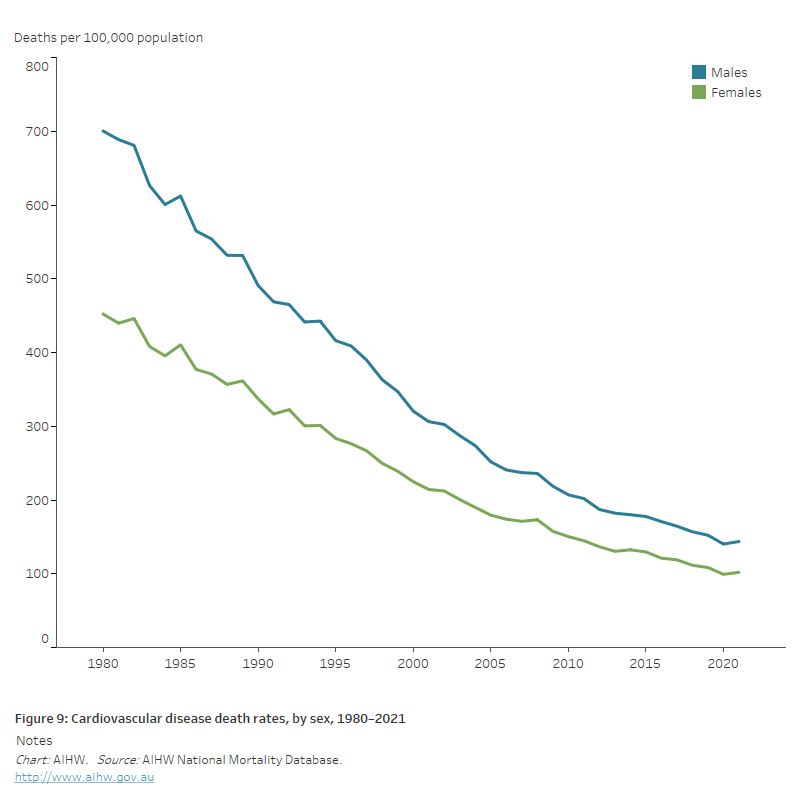
The line chart shows the decline in age-standardised cardiovascular disease death rates between 1980 and 2021, from 700 to 144 per 100,000 population for males and 452 to 102 for females.

Variation among population groups

Aboriginal and Torres Strait Islander people

In 2019–2021, there were 2,300 CVD deaths among Aboriginal and Torres Strait Islander people in jurisdictions with adequate Indigenous identification, a rate of 101 per 100,000 population.

After adjusting for differences in the age structure of the populations, the rate of death from CVD for Indigenous Australians was twice as high as for non-Indigenous Australians.

Indigenous males and females had CVD death rates 2.0 times as high as non-Indigenous males and females (Figure 10).

Socioeconomic area

In 2019–2021, after adjusting for differences in the age structure of the populations, the CVD death rate was 1.5 times as high for people living in the lowest socioeconomic areas compared with those in the highest socioeconomic areas.

This difference was greater for males (1.6 times as high) than females (1.4 times as high) (Figure 10).

Remoteness area

In 2019–2021, after adjusting for differences in the age structure of the populations, the CVD death rate in Remote and very remote areas was 1.4 times as high as in Major cities.

The difference was similar for males and females (Figure 10).

Figure 10: Cardiovascular disease death rates, by population group and sex, 2019–2021

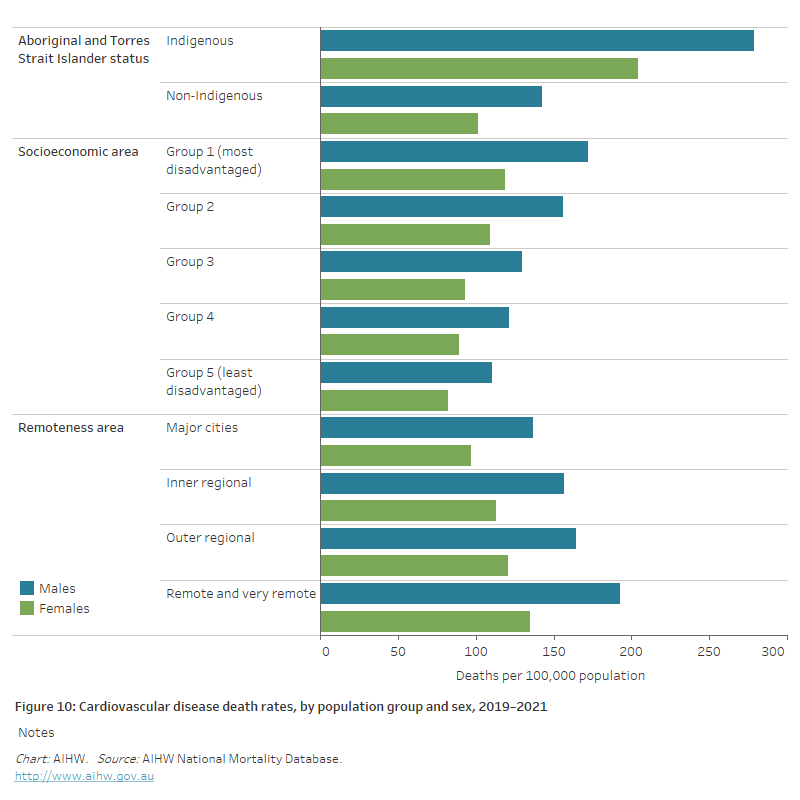
The horizontal bar chart shows that CVD death rates in 2019–2021 were higher among Indigenous Australians, people living in the lowest socioeconomic areas, and people living in remote and very remote areas.