Clients leaving care
Those who are without stable accommodation after leaving health or social care arrangements find themselves particularly vulnerable to homelessness. Clients are identified as leaving care if, in their first support period during 2016–17 (either the week before or at the beginning of the support period):
- their dwelling type was: hospital, psychiatric hospital or unit, disability support, rehabilitation, aged care facility; or
- their reason for seeking assistance was: transition from foster care/child safety residential care, or transition from other care arrangements.
In 2016–17, around 7,100 clients or 2% of all specialist homelessness service (SHS) clients were identified as having left care.
Key findings in 2016–17
- Client numbers rose 3% since 2015–16 to 7,104 clients. This increase was the same as that of the general SHS population (3%).
- One in 4 (24%) clients experienced a housing crisis: this was the most common main reason clients sought assistance from homelessness agencies (a rise of 2 percentage points from 2015–16).
- Over 3 in 4 (76%) needed accommodation services.
- Fewer clients were provided with accommodation: the proportion of clients provided with accommodation decreased in 2016–17 (46%, down from 48% in the previous year) however, their length of accommodation was notably longer (half of these clients received 49 nights or more, up from 42 nights in the previous year).
- Two in 5 (41%) sought assistance as they were transitioning from foster care, child safety residential placements or other care arrangements.
- The majority of clients leaving care were at risk of homelessness (74%).
- One in 4 ended support in an institution: At the end of support, 24% clients were housed in private or other housing, 25% were living in institutional settings, and 21% were living in short-term or emergency accommodation (and considered homeless).
Clients leaving care: 2012–13 to 2016–17
The proportion of clients leaving care in the SHS population and subsequently seeking assistance from specialist homelessness services has remained relatively stable over the past 5 years of the SHS collection. Key trends identified in this client population over these 5 years are:
- Taking into account changes in population size, the rate of service use by clients leaving care is increasing, up from 2 people per 10,000 population in 2012–13 to 3 people per 10,000 in 2016–17 (Table LCARE Trends.1).
- While males consistently made up the majority of clients leaving care, the age of male clients has increased over time; the largest age group shifted from 25–34 in earlier years to 35–44 in the past 3 years.
- Service use patterns have remained steady. Both the length of support and number of support periods have remained steady over the 5 years from a median of 62 days and 1.8 support periods per client leaving care to 62 days and 1.9 support periods. The long support length of these clients, together with the high proportion of these clients presenting with additional vulnerabilities (82%), implies that they are presenting with complex needs (Table LCARE Trends.1).
Table LCARE Trends.1: Clients leaving care: at a glance—2012–13 to 2016–17
| 2012–13 | 2013–14 | 2014–15 | 2015–16 | 2016–17 | |
|---|---|---|---|---|---|
| Number of clients | 5,542 | 5,573 | 6,084 | 6,869 | 7,104 |
| Proportion of all clients | 2 | 2 | 2 | 2 | 2 |
| Rate (per 10,000 population) | 2.4 | 2.4 | 2.6 | 2.9 | 2.9 |
| Housing situation at the beginning of first support period (proportion of all clients) | |||||
| Homeless | 33 | 33 | 32 | 30 | 26 |
| At risk of homelessness | 67 | 67 | 68 | 70 | 74 |
| Length of support (median number of days) | 62 | 62 | 58 | 60 | 62 |
| Average number of support periods per client | 1.8 | 1.7 | 1.8 | 1.9 | 1.9 |
| Proportion receiving accommodation | 57 | 54 | 52 | 48 | 46 |
| Median number of nights accommodated | 45 | 48 | 44 | 42 | 49 |
| Proportion of a client group with a case management plan | 69 | 70 | 71 | 70 | 69 |
| Achievement of all case management goals (per cent) | 15 | 16 | 19 | 17 | 18 |
Notes
- Rates are crude rates based on the Australian estimated resident population (ERP) at 30 June of the reference year. Minor adjustments in rates may occur between publications reflecting revision of the estimated resident population by the Australian Bureau of Statistics.
- The denominator for the proportion achieving all case management goals is the number of client groups with a case management plan. Denominator values for proportions are provided in the relevant national supplementary table.
Source: Specialist Homelessness Services Collection 2012–13 to 2016–17
Characteristics of clients leaving care 2016–17
Of the 7,104 clients leaving care in 2016–17:
- Over half were leaving either a psychiatric hospital (20%), rehabilitation (19%) or a hospital (15%).
- Just over 2 in 5 clients (41% or 2,900) sought assistance because they were transitioning from foster care/child safety residential placements or other care arrangements.
- The majority were males (56%) and 1 in 5 (21%) of the male clients were aged 35–44 years. Female clients tended to be younger with 1 in 4 (25%) aged 18–24 (Supplementary table LCARE.1).
- Around 1 in 4 clients leaving care were Indigenous (23%).
- More than half had received services in the past: returning clients made up 57% of this group and 43% were new clients. That is, more clients had received services at some point in the previous 5 years than those seeking assistance for the first time in 2016–17.
- The majority (59%) of clients were living alone when they sought assistance, the same as in 2015–16.
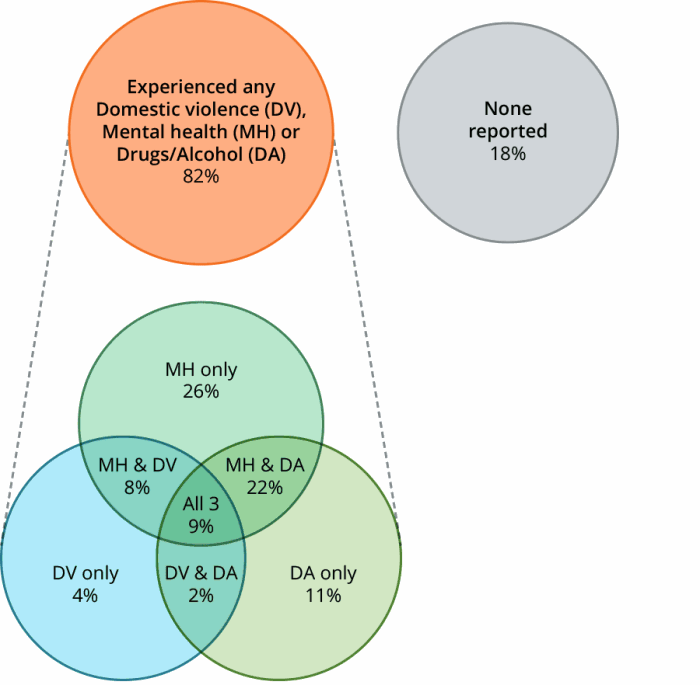
Figure LCARE.1 outlines the proportion of clients leaving care aged 10 and over who presented with additional vulnerabilities (domestic and family violence, a current mental health issue and/or problematic drug and/or alcohol use). Over 4 in 5 clients leaving care (82%, around 5,500 clients) presented with at least one of these additional vulnerabilities; a reflection of the care types many of these clients are leaving (for example, hospital, psychiatric hospital/unit, rehabilitation).
The majority of clients leaving care reported a current mental health issue (66%) and of these clients most reported more than one vulnerability:
- One in 5 (22%, or about 1,400 clients) reported both mental health and problematic drug and/or alcohol use;
- an additional 1 in 10 clients leaving care (9%, or about 600 clients) reported all three vulnerabilities (mental health, problematic drug and/or alcohol use, domestic and family violence).
Figure LCARE.1: Clients leaving care, by selected vulnerability characteristics, 2016-17
Notes
- Client vulnerability groups are mutually exclusive.
- Clients are aged 10 and over.
Source: Specialist Homelessness Services Collection 2016–17.
Main reasons for seeking assistance
Some of the main reasons for seeking assistance provided by clients leaving care that differed from the general SHS populations were:
- transition from other care arrangements (12%);
- transition from foster care and child safety residential placements (7%);
- mental health issues (8% compared with 1% of the overall SHS population);
- domestic and family violence (8% compared with 28% of the overall SHS population).
Services needed and provided
Around 5,400 clients leaving care (76%) needed accommodation services, much higher than the general SHS population (56%) (Supplementary table LCARE.3).
- More than half (52% or 3,700 clients) needed short-term or emergency accommodation, compared with 37% of the SHS general population.
- Almost half (44% or 3,200 clients) requested medium-term/transitional housing, higher than the general SHS population (27%) and these clients were more likely to be provided with accommodation (36% of those who requested it compared with 30%, respectively).
- Long-term housing was requested by 47% or around 3,300 clients, however, this was only able to be provided to 7% of the clients who needed it.
3 in 4 clients leaving care needed accommodation services (76%), higher than the general SHS population (56%).
Other services most commonly needed by these clients were material aid/brokerage (40%), transport (37%) and living skills/personal development (36%). These services were needed by higher proportions of clients leaving care than clients in the general SHS population (35%, 21%, and 20%, respectively).
Housing outcomes
For those clients leaving care whose support had ended:
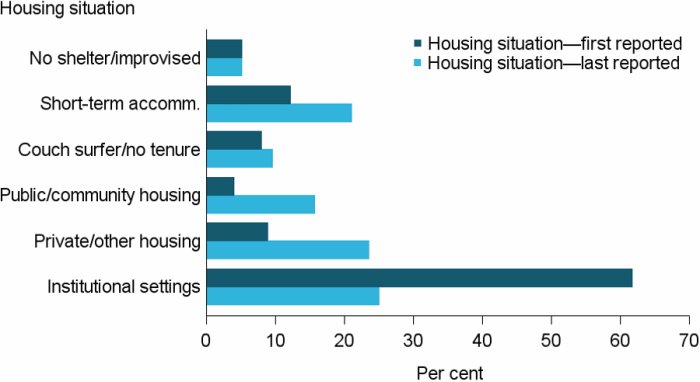
- Around 3 in 5 clients (62% or nearly 3,000 clients) were living in institutional settings at the beginning of their support (Supplementary table LCARE.4). This proportion decreased to 25% at the end of support (Figure LCARE.2). This reflects service delivery models aimed at assisting people leaving institutions into secure housing.
- Following support, the proportion of clients classified as homeless had actually increased (from 25% to 36%; around 1,500 clients’ homeless). This increase reflects clients leaving an institutional setting (considered at risk, rather than homeless) and subsequently becoming homeless. Most commonly, those homeless were living in short-term or emergency accommodation (21%) when support ended.
- Private or other housing was the most common housing situation at the end of support, increasing 15 percentage points to 24%.
Figure LCARE.2: Clients leaving care, by housing situation at beginning of support and end of support, 2016–17
Notes
- The SHSC classifies clients living with no shelter or improvised/inadequate dwelling, short-term temporary accommodation, or in a house, townhouse, or flat with relatives (rent free) as homeless. Clients living in public or community housing (renter or rent free), private or other housing (renter or rent free), or in institutional settings are classified as housed.
- No shelter/improvised includes inadequate dwellings; short-term accommodation includes temporary and emergency accommodation; couch surfer/no tenure includes living in a house, townhouse or flat with relatives rent free; public/community housing includes both renting or rent free; and private/other housing includes both renting or rent free.
- Proportions include only clients with closed support at the end of the reporting period.
Source: Specialist homelessness services 2016–17, National supplementary table LCARE.4.
It is recognised that the transition to stable housing (see Glossary) can be more difficult for some clients than for others. Of those clients leaving care who were homeless when they began support (that is, living either with no shelter or improvised/inadequate dwelling, short-term temporary accommodation, or in a house, townhouse, or flat with relatives (rent free)):
- 43% were assisted into stable housing at the end of support (Table LCARE.2).
- Agencies were best able to assist those in short-term emergency accommodation into stable housing (50%, or around 250 clients) with most housed in private/other housing (about 130 clients).
For clients leaving care and presenting to agencies housed, but at risk of homelessness (that is, living either in public or community housing (renter or rent free), private or other housing (renter or rent free), or in institutional settings), the majority of clients were assisted to maintain their housing:
- For clients living in public or community housing 3 in 4 (74%, or 139 clients) were assisted to maintain their tenancy, with a further 14% moving into private/other housing.
- For clients living in private/other housing about 7 in 10 (68%, or 265 clients) were assisted to maintain their tenancy, with a further 11% moving into public or community housing.
Table LCARE.2: Clients leaving care, housing situation at beginning and end of support, 2016–17 (per cent)
| Situation at beginning of support | Situation at end of support: homeless |
Situation at end of support: housed |
|---|---|---|
| Homeless | 56.7 | 43.3 |
| At risk of homelessness | 28.4 | 71.6 |
Notes
- The SHSC classifies clients living with no shelter or improvised/ inadequate dwelling, short-term temporary accommodation, or in a house, townhouse, or flat with relatives (rent free) as homeless. Clients living in public or community housing (renter or rent free), private or other housing (renter or rent free), or in institutional settings are classified as housed.
- Proportions include only clients with closed support at the end of the reporting period. Per cent calculations are based on total clients, excluding ‘Not stated/other’.
Source: Specialist homelessness services 2016–17, National supplementary table LCARE.4.