Young people presenting alone
Young people are some of the most vulnerable people in our society and experience significant rates of homelessness [1]. Traumatic and abusive experiences in the home as a young person have been identified as one of the major pathways into longer term homelessness for adults [2].
Key findings in 2016–17
- There were around 42,131 young people aged 15–24 who presented alone to a specialist homelessness services (SHS) agency in 2016–17, a small decrease (2%) from the previous year.
- Over half (52%) the young clients were homeless at presentation to a SHS agency. This has increased over time.
- The number of young people aged 15–17 was similar between 2015–16 and 2016–17; around 9,700 (23%) compared with 9,600 (23%).
- One-quarter (25%) of young people presenting alone sought assistance due to unstable housing (housing crisis).
- Over half (52%) had received services in the previous 5 years.
- There was improvement in housing outcomes with fewer young clients being homeless following support (41%, down from 54%).
- Most young clients at risk of homelessness were assisted to maintain a housing tenancy (86%).
Young people presenting alone: 2012–13 to 2016–17
Since 2012–13, the number of young people presenting alone to an agency has fluctuated. Key trends over the past 5 years have been:
- The rate of service use by young people presenting alone to SHS agencies has decreased from 20 young people per 10,000 population in 2012–13 to 17 young people per 10,000 in 2016–17 (Table Young Trends.1).
- While the number of young people presenting alone has been decreasing, the proportion of Indigenous young people presenting alone has been increasing. Of all young people presenting alone, in 2012–13 1 in 5 (23%) were Indigenous, increasing to 1 in 4 (26%) in 2016–17. The largest increases have been in Inner regional areas (4.4% on average each year), Major cities (4.3% each year) and Outer regional areas (4.1%). By comparison, the only regional area to report an increase in the rate of non-Indigenous young people presenting alone was Major cities (0.3%).
- Domestic and family violence (16% in 2016–17) or insecure housing (housing crisis 25% in 2016–17) remain the most common main reason young people presented alone for assistance.
- Following initial increases, the median number of days of support and nights of accommodation for these clients plateaued in 2014–15 and 2015–16 (44 days and 41 nights), but have both increased in 2016–17 (47 days and 44 nights).
- Those clients achieving all their case management goals has hovered around 1 in 5, and this group remains one of the least likely of all priority groups to achieve all their goals.
Table Young Trends.1: Young people (15–24 years) presenting alone: at a glance—2012–13 to 2016–17
| 2012–13 | 2013–14 | 2014–15 | 2015–16 | 2016–17 | |
|---|---|---|---|---|---|
| Number of clients | 45,071 | 44,414 | 41,780 | 43,165 | 42,131 |
| Proportion of all clients | 18 | 17 | 16 | 15 | 15 |
| Rate (per 10,000 population) | 19.8 | 19.2 | 17.8 | 18.1 | 17.4 |
| Housing situation at the beginning of first support period (proportion of all clients) | |||||
| Homeless | 51 | 50 | 52 | 52 | 52 |
| At risk of homelessness | 49 | 50 | 48 | 48 | 48 |
| Length of support (median number of days) | 41 | 46 | 44 | 44 | 47 |
| Average number of support periods per client | 1.7 | 1.7 | 1.8 | 1.8 | 1.8 |
| Proportion receiving accommodation | 37 | 36 | 35 | 34 | 31 |
| Median number of nights accommodated | 36 | 41 | 41 | 41 | 44 |
| Proportion of a client group with a case management plan | 54 | 57 | 58 | 60 | 60 |
| Achievement of all case management goals (per cent) | 16 | 16 | 20 | 18 | 18 |
Notes
- Rates are crude rates based on the Australian estimated resident population (ERP) at 30 June of the reference year. Minor adjustments in rates may occur between publications reflecting revision of the estimated resident population by the Australian Bureau of Statistics.
- The denominator for the proportion achieving all case management goals is the number of client groups with a case management plan. Denominator values for proportions are provided in the relevant national supplementary table.
Source: Specialist Homelessness Services Collection 2012–13 to 2016–17.
Characteristics of young people presenting alone 2016–17
In 2016–17, 42,131 young people (aged 15–24) were alone when they approached a specialist homelessness agency. Some of the characteristics of young people presenting alone in 2016–17 were:
- A small decrease in numbers: There was a 2% decrease nationally in young people presenting alone since last year. This was primarily due to decreases in client numbers in Queensland (10% decrease), South Australia (6% decrease) and Victoria (3% decrease). New South Wales, Western Australia and the Northern Territory reported an increase in client numbers for young people presenting alone, although these were minimal (1%, 1% and 2% increases, respectively).
- Just over 2 in 5 (41%) lived alone: Around 15,600 young people lived alone at the time of approaching a specialist homelessness agency and a further 18% were living with other family.
- Around 3 in 5 were female: The majority of young people presenting alone were female (62%) and 78% were aged between 18 and 24, similar to 2015–16.
- Just over half had received services in the past: 52% of this group of young people had been assisted at some other time in the previous 5 years.
- One in 4 young people presenting alone were Indigenous (26%).
- Fewer clients presented in cities and remote areas: The decrease in the number of young people presenting alone was due to decreases in Remote/very remote areas (151 fewer clients) and Major cities (150 fewer) since 2015–16.
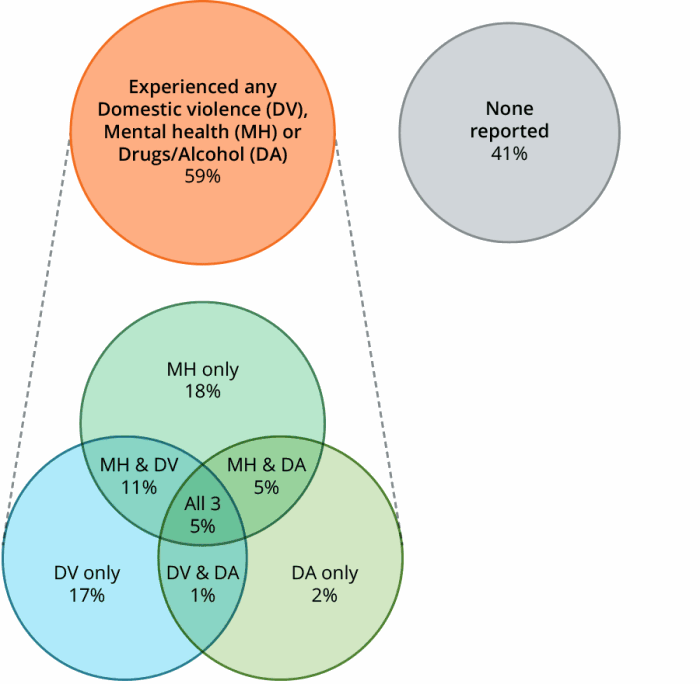
Three of the main vulnerabilities observed in the SHS client population are mental health issues, problematic drug and/or alcohol use, and domestic and family violence. Figure YOUNG.1 illustrates the proportion of young people presenting alone who also faced these challenges:
- Six in 10 (59%, or nearly 25,000 clients) were experiencing additional vulnerabilities.
- Thirty-nine per cent (or over 16,000) young people presenting alone reported a mental health issue and of these clients the majority had experienced issues with either domestic and family violence or problematic drug and/or alcohol use.
- 1 in 10 (11%) reported both domestic and family violence and mental health issues.
- An additional 5% reported both mental health issues and problematic drug and/or alcohol use.
- A further 5 % reported all three vulnerabilities (mental health issues, domestic and family violence, and problematic drug/alcohol use).
Figure YOUNG.1: Young people presenting alone, by selected vulnerability characteristics, 2016-17
Notes
- Client vulnerability groups are mutually exclusive.
- Clients are aged 15–24.
Source: Specialist Homelessness Services Collection 2016–17.
Services needed and provided
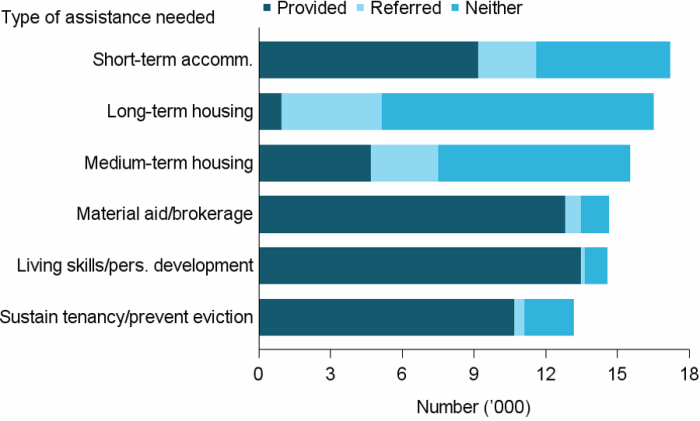
For young people presenting alone, the most common needs identified (excluding basic services such as advice/information, or advocacy/liaison) were accommodation related, with 62% requesting some form of accommodation:
- Just over 4 in 10 requested short-term or emergency accommodation (41%), with 54% provided this accommodation.
- Just under 4 in 10 requested medium-term/transitional housing (37%) with 30% provided this accommodation.
- Just under 4 in 10 requested long-term accommodation (37%), with just only around 1 in 20 (6%) able to be provided this form of accommodation (Figure YOUNG.2).
Compared with the overall SHS population, young people presenting alone were much more likely to be identified as needing assistance with:
- living skills/personal development (35% compared with 20%)
- education (20% compared with 8%)
- employment (15% compared with 5%) and
- training (13% compared with 4%).
The need for these services was unmet in some cases (16% for those who identified needs for education, 21% for employment and 20% for training assistance).
Figure YOUNG.2: Young people presenting alone, by top 6 most needed services and service provision status, 2016–17
Notes
- Excludes ‘Other basic assistance’, ‘Advice/information’, and ‘Advocacy/liaison on behalf of client’.
- Short-term accommodation includes temporary and emergency accommodation; medium-term housing includes transitional housing; and sustain tenancy/prevent eviction includes assistance to sustain tenancy or prevent tenancy failure or eviction.
- A client may request multiple services and assistance types; therefore client counts are not mutually exclusive.
- ‘Neither’ indicates a service was neither provided nor referred.
Source: Specialist homelessness services 2016–17, National supplementary table YOUNG.3
Housing outcomes
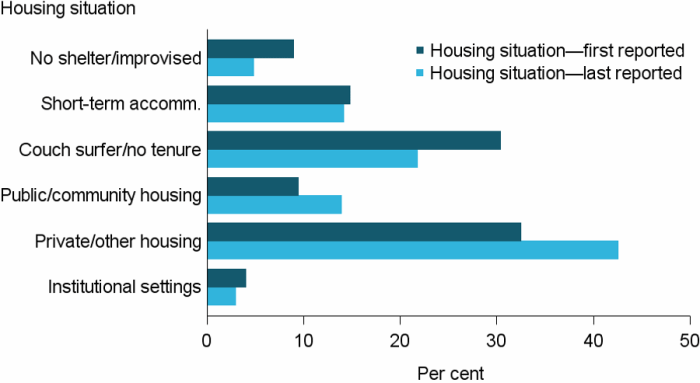
For young people presenting alone whose support had ended:
- The rate of homelessness was reduced. It fell from 54% at the beginning of support to 41% at the end of support.
- The most common housing outcome for young people presenting alone was private or other housing (as a renter, rent free or owner) (43%)—an increase from 32% at the beginning of support.
- ‘Couch surfing’ rates reduced. At the beginning of support, 30% of young people who presented alone were ‘couch surfing’ or staying in housing with no tenure. This decreased to 22% by the end of support (Figure YOUNG.3).
Figure YOUNG.3: Young people presenting alone, by housing situation at beginning and end of support, 2016–17
Notes
- The SHSC classifies clients living with no shelter or improvised/inadequate dwelling, short-term temporary accommodation, or in a house, townhouse, or flat with relatives (rent free) as homeless. Clients living in public or community housing (renter or rent free), private or other housing (renter or rent free), or in institutional settings are classified as housed.
- No shelter/improvised includes inadequate dwellings; short-term accommodation includes temporary and emergency accommodation; couch surfer/no tenure includes living in a house, townhouse or flat with relatives rent free; public/community housing includes both renting or rent free; and private/other housing includes both renting or rent free.
- Proportions include only clients with closed support at the end of the reporting period.
Source: Specialist homelessness services 2016–17, National supplementary table YOUNG.4.
Where a young person presented housed, but at risk of homelessness, agencies were successful in maintaining that housing, and preventing the client from becoming homeless.
For example, where the young person was living in public or community housing, 9 in 10 were assisted to maintain or obtain stable housing (see Glossary), with 75% (or 1,750 clients) remaining in their social housing tenancies and a further 13% obtaining private or other housing.
Where the young person was living in private/other dwelling, 9 in 10 were assisted to maintain or obtain stable housing, with 81% (or about 6,500 clients) remaining in their tenancy and a further 13% (or about 400 clients) obtaining public or community housing.
For those young people presenting alone who were homeless when they began support (Table Young.2):
- Over one-third (36%, or 4,500 clients) were assisted into stable housing; 64% remained homeless.
- Four in 10 (40%) who were in short-term or emergency accommodation were assisted into stable housing.
- Rough sleepers were the least likely to end support in stable housing, with just 30% finishing support in stable housing.
Table Young.2: Young people presenting alone, housing situation at beginning and end of support, 2016–17 (per cent)
| Situation at beginning of support | Situation at end of support: homeless |
Situation at end of support: housed |
|---|---|---|
| Homeless | 64.3 | 35.7 |
| At risk of homelessness | 13.7 | 86.3 |
Notes
- The SHSC classifies clients living with no shelter or improvised/ inadequate dwelling, short-term temporary accommodation, or in a house, townhouse, or flat with relatives (rent free) as homeless. Clients living in public or community housing (renter or rent free), private or other housing (renter or rent free), or in institutional settings are classified as housed.
- Proportions include only clients with closed support at the end of the reporting period. Per cent calculations are based on total clients, excluding ‘Not stated/other’.
Source: Specialist homelessness services 2016–17, National supplementary table YOUNG.4.
References
Australian Bureau of Statistics (ABS) 2012. Census of population and housing: estimating homelessness, 2011. ABS cat. No. 2049.0. Canberra: ABS.
Chamberlain & Johnson 2011. Pathways into adult homelessness. Journal of Sociology, 1-18 DOI: 10.1177/1440783311422458.