Unmet demand for specialist homelessness services
Specialist homelessness agencies in Australia provide assistance to thousands of people each day. In 2016–17, on average, each day an estimated 59,900 people were supported. However, there were also people who approached agencies who were unable to be offered any assistance. These people may have approached more than one agency or returned to the same agency another day. An instance where no assistance is received by a person who approaches a service is referred to as an ‘unassisted request for service’. Only a limited amount of data are collected in these instances.
There may be a range of reasons an agency cannot assist a person. For example, the person may be seeking a specialised service not offered by that particular agency or the agency may not have the capacity to provide assistance at that time. The person may not be in the target group for the agency. These people may be referred to another agency for assistance, but the SHSC does not currently capture this activity. See Technical information and Glossary for information on the way in which unassisted requests for services are measured in the SHSC.
There was an average of 261 instances of unassisted requests for services each day, across Australia in 2016–17.
This section presents information on unmet demand from 2 perspectives:
- Unassisted requests for services—which relate to people who are not able to be offered any assistance by the SHS agency
- Unmet need—which captures those clients who had some, but not all, of their identified needs met by the agency.
The SHSC captures only limited information about unassisted requests for services, because it is not always appropriate for specialist homelessness agencies to collect the same level of detailed information as they would if the person became a client.
Key findings in 2016–17
- On average, there were 261 requests per day which were unable to be met.
- There were around 5,000 (5%) fewer unassisted requests for homelessness services when compared with 2015–16. In 2016–17 there were an estimated 95,390 unassisted requests for services, 5,000 fewer than in 2015–16 (100,300).
- 7 out of 10 daily unassisted requests included a need for some type of accommodation support (72%).
- Most commonly, agencies were unable to meet requests for accommodation because there was no accommodation available at the time.
- The majority of unassisted requests came from females (66%).
Unassisted requests for services: 2012–13 to 2016–17
In 2016–17, there were an estimated 95,000 requests for assistance that were unable to be met. This represents a decrease of 5% from last year. Some key trends in unmet demand since 2012–13 have been:
- The number of unassisted requests has varied over time. Increasing between 2012–13 and 2013–14, but steadily decreasing since this time (Table Unassisted Trends.1). These decreases were primarily due to reductions in New South Wales and Queensland and are a reflection of the impact of new service delivery models in these states. For further details see the data quality information in Technical information.
- Two-thirds of the unassisted requests were from females (66%) in 2016–17, up from 60% in 2012–13.
- In contrast to the changes occurring in the number of unassisted requests for services, the number of clients and the number of support periods have been increasing over the same period. Unassisted requests have decreased on average, 4% each year while client numbers have increased 4% and support periods 5% each year over this time.
Table UNASSISTED TRENDS.1: Unassisted requests for service: at a glance—trends over time 2013–14 to 2016–17
| 2013–14 | 2014–15 | 2015–16 | 2016–17 | |||||
|---|---|---|---|---|---|---|---|---|
| Assisted Clients | Unassisted requests | Assisted Clients | Unassisted requests | Assisted Clients | Unassisted requests | Assisted Clients | Unassisted requests | |
| Number | 254,002 | 154,446 | 255,657 | 119,910 | 279,196 | 100,302 | 288,273 | 95,392 |
| Sex (per cent) | ||||||||
| Female | 59 | 62 | 59 | 65 | 59 | 64 | 60 | 66 |
| Male | 41 | 38 | 41 | 35 | 41 | 36 | 40 | 34 |
| Living arrangement (per cent) | ||||||||
| Lone person | 30 | 57 | 29 | 63 | 29 | 63 | 29 | 60 |
| Sole parent | 33 | 38 | 34 | 33 | 34 | 33 | 35 | 35 |
| Couple with child(ren) | 13 | — | 13 | — | 13 | — | 13 | — |
| Couple without children | 5 | 2 | 5 | 2 | 5 | 2 | 5 | 2 |
| Other family group | 18 | 2 | 18 | 2 | 18 | 2 | 18 | 3 |
— Rounded to zero
Source: Specialist Homelessness Services Collection 2013–14 to 2016–17
Unassisted requests for service in 2016–17
Analysis of how often a person requested assistance and how many later became clients of specialist homelessness agencies can only be examined where sufficient information is gathered to allow the experience of the client followed through time (about half (49%) of all unassisted requests). In 2016–17, on average, each person who was not assisted, approached an agency 1.5 times, the same average as in 2015–16.
In 2016–17, 46% of persons with sufficient information went on to become clients and receive services during the year, similar to the proportion in 2015–16 (47%). The outcomes for the remaining 54% are not known—they may have received assistance from a non-SHS service, used their own support networks or continued to experience unstable housing.
Number of unassisted requests for services
On average, across Australia there were 261 requests per day which could not be met:
- Two thirds of these requests came from females: About 172 daily unassisted requests (or 66% of all requests) were made by females, and 89 by males (34%). This reflects the overall service user population, which is predominantly female (Figure UNASSISTED.1).
- One in 4 (28%) unassisted requests were from females aged between 25 and 44 years. Overall, 2 in 3 (66%) unassisted requests of all ages were by women, and 1 in 3 were by men.
- Four in 5 unassisted requests from single adults with children were from females (79%) and most of these females were aged between 25 and 44 (59% of adult single females with children).
Compared with 2015–16, in 2016–17:
- The number of unassisted requests fell for both sexes (about 2,600 fewer unassisted requests for males and about 1,800 fewer for females).
- The largest decrease for females was in the age group 15–17 presenting to an agency alone, not part of a family. For males it was 18–24 also presenting alone.
Figure UNASSISTED.1: Proportion of unassisted requests, by sex and age group, 2016–17
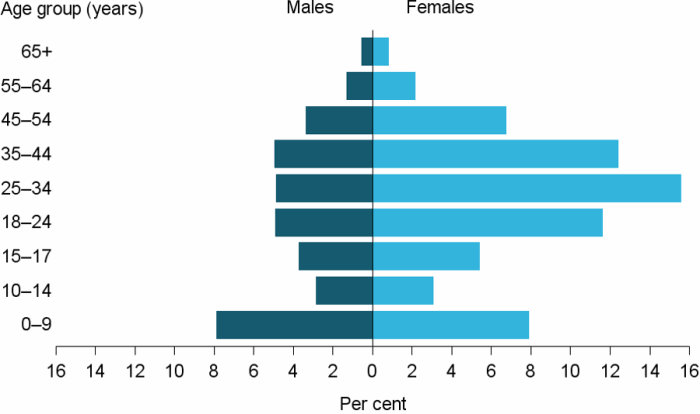
Source: Specialist homelessness services 2016–17, National supplementary table UNMET.1.
What services were requested?
On average, 72% of daily unassisted requests included a need for some type of accommodation support.
- The majority of unassisted daily accommodation requests related to short-term or emergency accommodation (59%) (Figure UNASSISTED.2). Females were more likely than males to have requests for short-term or emergency accommodation unmet (64% and 36%, respectively), most likely a reflection of the higher proportion of females in this group.
- Unassisted requests for short-term or emergency accommodation were much lower than in 2015–16. There was on average, 8 fewer unmet requests daily for this type of assistance.
Figure UNASSISTED.2: Services requested as proportion of daily unassisted requests, by sex, 2016–17
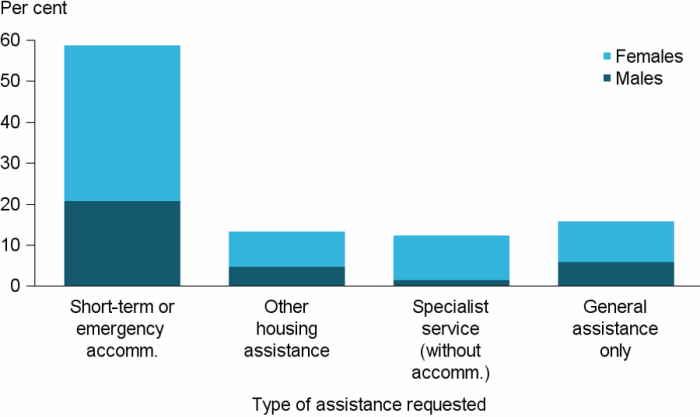
Source: Specialist homelessness services 2016–17, National supplementary table UNMET.5.
Over 9 in 10 (93%) daily unassisted requests for services from single persons with children were for accommodation needs, compared with 63% for single persons without children (Figure UNASSISTED.3).
Figure UNASSISTED.3: Proportion of unassisted requests for services by single person with or without children, by service type, 2016–17
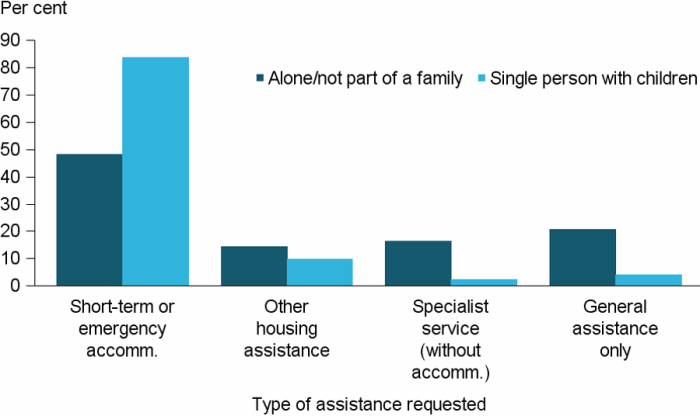
Source: Specialist homelessness services 2016–17, National supplementary table UNMET.6.
Most commonly, agencies reported that they could not meet requests for accommodation because there was no accommodation available at the time of the request (48% of unmet requests for accommodation) (Supplementary table UNMET.7). This figure is similar to 2015–16 (50%).
On fewer than 1 in 10 occasions, a person did not accept the service offered (8%).
Clients’ unmet need for services
Clients receiving support from specialist homelessness services are often identified as needing a wide range of services. Some needs arise more than once in a support period and this makes it difficult to assess (from the available data) the extent to which they have been met. In this section, each client need and the services to meet that need are only identified once in each support period.
Key findings in 2016–17
- 6,300 more clients requested long-term housing in 2016–17 but long-term housing options were provided to just 5% (or 5,300) of the 102,000 (35%) clients needing this service.
- The ability of agencies to keep up with the demand for certain specialist services is decreasing. For example, 1 in 3 (33%) mental health service requests were neither provided nor referred in 2016–17, up from 32% in 2015–16. Within this group of services, the proportion of requests for psychiatric services that were not met increased 6 percentage points to 44% (or about 2,400 clients).
Unmet need for accommodation and housing assistance services
Accommodation was the most common need identified by clients. In 2016–17, over half (56%) of all clients needed at least 1 type of accommodation service.
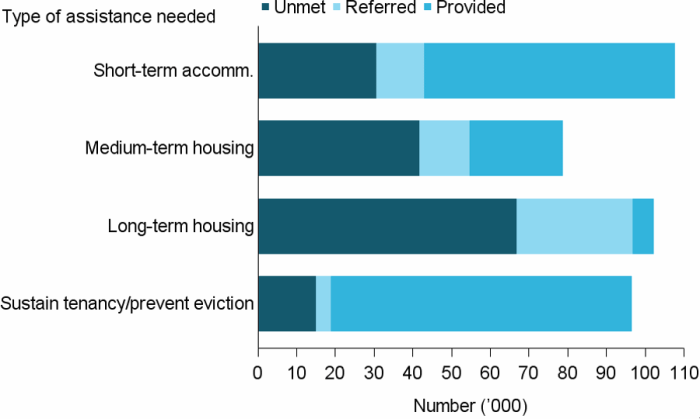
- Nearly 2 in 5 clients (37% or 108,000) needed short-term or emergency accommodation; 6 in 10 (60%) of those requesting this service were provided with assistance.
- Over one-third of clients (35% or 102,000) identified a need for long-term accommodation; only about 5% (or 5,300 clients) of those were provided with the service (Figure UNMET NEED.1).
- The numbers of clients requesting these 2 forms of accommodation were similarly large, however the considerable difference in the proportions of clients receiving these types of accommodation highlights the substantial unmet need for long-term housing encountered by SHS clients.
Figure UNMET NEED.1: The number of clients with unmet needs for accommodation and housing assistance services, 2016–17
Notes
- Unmet includes ‘Not provided or referred’.
- Short-term accommodation includes temporary and emergency accommodation; medium-term housing includes transitional housing; and sustain tenancy/prevent eviction includes assistance to sustain tenancy or prevent tenancy failure or eviction.
Source: Specialist homelessness services 2016–17, National supplementary table CLIENTS.15.
Client unmet need for general and specialised services
Some types of needs were able to be met by the agency for a significant proportion of clients. For example, of the nearly 153,000 clients who needed assistance for advocacy/liaison, 97% were provided assistance, and of the clients requesting material brokerage (nearly 102,000), 86% were provided with assistance (Supplementary table CLIENTS.15).
Other types of client needs were less commonly met. For example, among those clients who required gambling counselling (less than 1%, or under 1,000 clients), the level of unmet need was substantial—around 35% of clients either not being provided or referred to gambling counselling. This may be related to the specialist skills required to provide gambling counselling and the limited availability of these skills within the SHS agencies and other services that clients may be referred to.
The level of need for broad groups of specialised services is shown in Figure UNMET NEED.2.
- Mental health services, including psychological, psychiatric and mental health services, were one of the most common specialised services identified as needed by clients, but these needs were most commonly unmet with around 3 in 10 (31%) clients neither provided nor referred these services.
- Over a third of the clients identifying a need for either disability services (39%) or drug and alcohol services (34%) did not have their needs met.
- In contrast, immigration and cultural services, needed by 6% of the SHS population (about 18,000), were provided for most of the clients requiring them (85%).
Figure UNMET NEED.2: The number of clients with unmet needs for specialised services (grouped), 2016–17

Note: Unmet includes ‘Not provided or referred’.
Source: Specialist homelessness services 2016–17, National supplementary table CLIENTS.15.