Clients with a current mental health issue
In 2016–17, over 1 in 4 clients, or an estimated 77,569 people, who received assistance from a specialist homelessness agency were identified as experiencing a current mental health issue (see Glossary). This is over 5,200 (7%) more clients than in 2015–16.
People with mental health issues represent a group who are particularly vulnerable to homelessness. In general, people living with a mental illness are often isolated, have disrupted family, social and peer networks, and sometimes suffer poor physical health, all of which further reduces their capacity to find and maintain adequate housing. Several studies suggest that when people with mental health issues are supported by homelessness agencies, they are more likely to stay housed rather than returning to homelessness, in particular rough sleeping [1, 2, 3, 4].
Key findings in 2016–17
- The number of clients reporting a current mental health issue increased 7% from the previous year to over 77,500; this increase was higher than that of the general Specialist Homelessness Services (SHS) population (3%).
- Almost half were living alone: most commonly, these clients were living alone (45%) when they sought assistance and 1 in 4 (27%) needed assistance because of a ‘housing crisis’.
- Half were homeless when seeking support: most of these clients were living either in short-term or emergency accommodation (18%) or ‘couch surfing’ (18%).
- Just over 3 in 5 clients (61%) had received services in the previous 5 years.
- Housing outcomes improved: fewer clients were homeless following support (37%, down from 50%), with ‘rough sleepers’ dropping 6 percentage points to 8% (about 3,800 clients) at the end of support. The largest percentage change in housing situation was for clients in public and community housing—up from 12% at the start of support to 19% (or about 9,300 clients) at the end of support.
Clients with a current mental health issue: 2012–13 to 2016–17
The number of clients presenting with a current mental health issue has been increasing since the beginning of the SHS collection in 2011–12. Key trends identified over the past 5 years (2012–13 to 2016–17) includes:
- This cohort is growing rapidly. Clients with a current mental health issue are one of the fastest growing client groups within the SHS collection, growing at an average rate of 12% per year since 2012–13. Various factors, including increased identification, community awareness and reduced stigma have all potentially driven the increase in self-identification and reporting of mental illness among SHS clients.
- The rate of service use has increased. The rate of service use by these clients has increased from 21 people per 10,000 population in 2012–13 to 32 people per 10,000 in 5 years (Table MH Trends.1).
- They appear to need more support. These clients consistently need longer periods of support and tend to return more often. These clients received an average of 2.4 support periods and 68 days of support over the 2016–17 year, higher than the SHS average of 1.7 and 37 days.
- Housing crisis and domestic and family violence remain the most common main reasons these clients seek assistance from specialist homelessness agencies.
Table MH Trends.1: Clients with a current mental health issue: at a glance— 2012–13 to 2016–17
| 2012–13 | 2013–14 | 2014–15 | 2015–16 | 2016–17 | |
|---|---|---|---|---|---|
| Number of clients | 48,599 | 56,281 | 63,062 | 72,364 | 77,569 |
| Proportion of all clients | 20 | 22 | 25 | 26 | 27 |
| Rate (per 10,000 population) | 21.4 | 24.3 | 26.8 | 30.3 | 32.0 |
| Housing situation at the beginning of first support period (proportion of all clients) | |||||
| Homeless | 51 | 50 | 50 | 50 | 50 |
| At risk of homelessness | 49 | 50 | 50 | 50 | 50 |
| Length of support (median number of days) | 73 | 67 | 62 | 64 | 68 |
| Average number of support periods per client | 2.4 | 2.3 | 2.3 | 2.3 | 2.4 |
| Proportion receiving accommodation | 48 | 44 | 42 | 39 | 37 |
| Median number of nights accommodated | 48 | 48 | 44 | 44 | 45 |
| Proportion of a client group with a case management plan | 69 | 69 | 70 | 70 | 71 |
| Achievement of all case management goals (per cent) | 15 | 18 | 19 | 17 | 18 |
Notes
- Rates are crude rates based on the Australian estimated resident population (ERP) at 30 June of the reference year. Minor adjustments in rates may occur between publications reflecting revision of the estimated resident population by the Australian Bureau of Statistics.
- The denominator for the proportion achieving all case management goals is the number of client groups with a case management plan. Denominator values for proportions are provided in the relevant national supplementary table.
Source: Specialist Homelessness Services Collection 2012–13 to 2016–17
Characteristics of clients with a current mental health issue 2016–17
In 2016–17, of the 77,569 clients (27% of all clients) with a current mental health issue and accessing specialist homelessness services:
- Half (50%) were homeless when they presented to an agency. This is higher than the general SHS population (44%) and they most commonly presented to the agency alone (45% compared with 29%, respectively).
- They received more periods of support: These clients came back more often than any other priority group for support during the year (2.4 support periods per client) and received a median of 68 days of support, almost twice as many days as the general SHS population. The general SHS client population received 1.7 support periods and 37 days of support.
- Most had received services in the past: 6 in 10 clients (61%) were ‘returning’ clients, that is, they had received homelessness services at some time in the previous 5 years. This trend is observed across all the states and territories.
- Most received services in cities: Two in 3 clients with a current mental health issue (66%) accessed specialist homelessness services in Major cities in 2016–17.
- Nearly 1 in 5 clients (18%) in this group were Indigenous.
Age and sex
Similar to the general SHS population, the majority of clients with a current mental health issue were female (60%) in 2016–17. However, unlike the general SHS population nearly half of all clients with a current mental health issue were aged between 25 and 44 (45% compared with 36% in the general SHS population) (Figure MH.1).
Figure MH.1: Clients with a current mental health issue, by age and sex, 2016–17
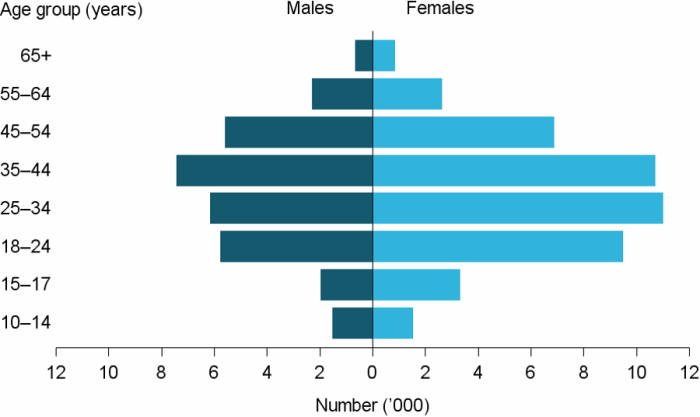
Source: Specialist homelessness services 2016–17, National supplementary table MH.1.
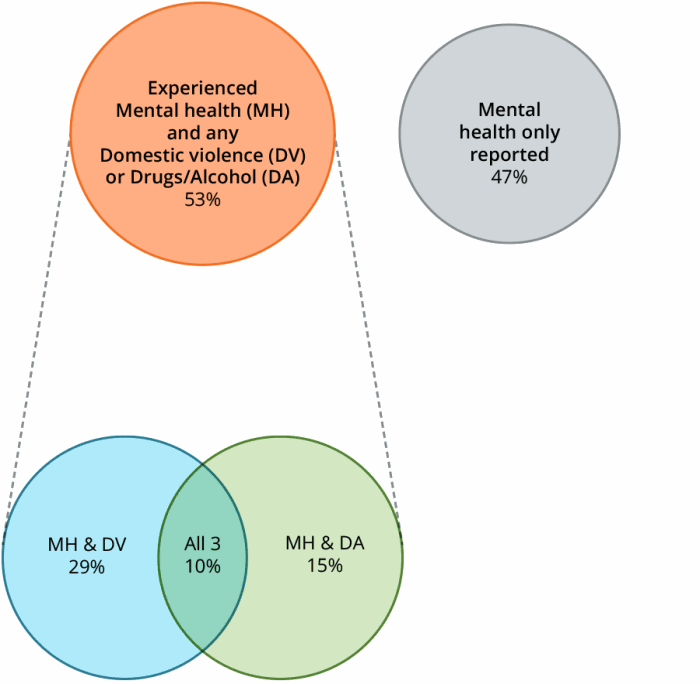
Of the 77,569 clients reporting a current mental health issue, over half (53%) also reported additional vulnerabilities (Figure MH.2) including:
- Nearly 3 in 10 clients (29%) had experienced domestic and family violence.
- 15% reported both mental health and problematic drug and/or alcohol use.
- A further 1 in 10 (10%, or about 7,500 clients) reported all three vulnerabilities (domestic and family violence, problematic drug and/or alcohol use and mental health issues).
These figures provide an insight into the multiple disadvantages clients with mental health issues face and suggest the need for an integrated service response to homelessness for these clients.
Figure MH.2: Clients with a current mental health issue, by selected vulnerability characteristics, 2016-17
Notes
- Client vulnerability groups are mutually exclusive.
- Clients are aged 10 and over.
Source: Specialist Homelessness Services Collection 2016–17.
Services needed and provided
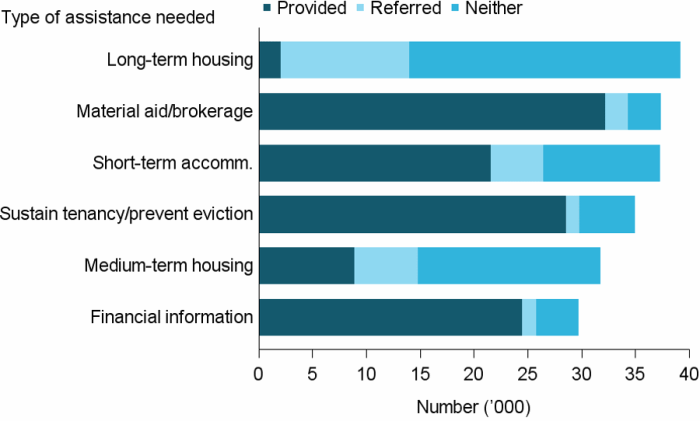
About 37,000, or just under half (48%) of the clients with a current mental health issue, needed short-term or emergency accommodation; 58% of these clients were provided assistance (Figure MH.3).
Of those clients with a current mental health issue, about 1 in 3 (30%, or 23,000) identified a need for mental health-based services with:
- 26% identifying a need for mental health services; with 45% of these requests met.
- 11% identifying a need for psychological services; with 35% of these requests met.
- 7% identifying a need for psychiatric services; with 37% of these requests met.
Compared with the general SHS population, clients with a current mental health issue were more likely to identify a need for:
- drug and alcohol services (10% compared with 4% of the general SHS population).
- health/medical services (21% compared with 10%).
- accommodation services (69% compared with 56%) and in particular long-term housing (50% compared with 35%) and medium-term/transitional housing (41% compared with 27%).
50% of clients with a current mental health issue needed long-term housing assistance compared with 35% of the general SHS population
Clients experiencing a current mental health issue were also identified as needing:
- assistance to sustain tenancy (45%, or nearly 35,000 clients); with assistance provided to 82% of these clients.
- financial information (38%, or over 29,500 clients); with assistance provided to 83% of these clients.
- assertive outreach (26%, or over 20,000), which mostly targets rough sleepers; this was higher for those clients with a current mental health issue than other priority groups.
All these services were needed at higher rates than the general SHS population (for example, financial information 25%, and assertive outreach 18%).
Figure MH.3: Clients with a current mental health issue, by top 6 most needed services and service provision status, 2016–17
Notes
- Excludes ‘Other basic assistance’, ‘Advice/information’, and ‘Advocacy/liaison on behalf of client’.
- Short-term accommodation includes temporary and emergency accommodation; medium-term housing includes transitional housing; and sustain tenancy/prevent eviction includes assistance to sustain tenancy or prevent tenancy failure or eviction.
Source: Specialist homelessness services 2016–17, National supplementary table MH.3.
Housing outcomes
For clients with a current mental health issue and whose support had ended:
- Half (50%, or nearly 25,000) were homeless at the beginning of support, with this reducing to 37% at end of support.
- The improvement in housing outcomes was particularly evident for clients who first presented ‘rough sleeping’ (see glossary for definition). The rough sleeping rate almost halved, dropping from 14% at the commencement of support to 8% at the end of their support (Supplementary table MH.4).
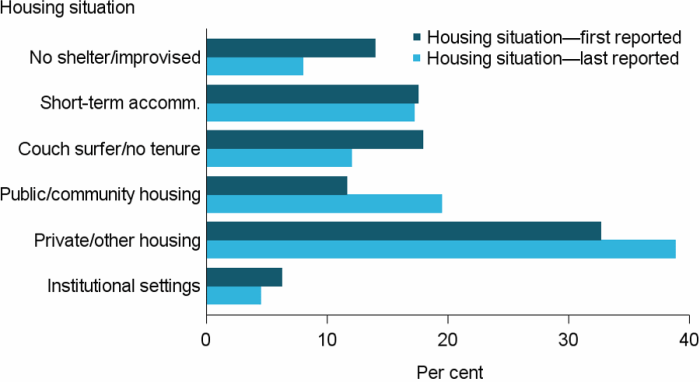
Most of these clients were housed at the end of support with (Figure MH.4):
- around 18,500 clients (39%) in private rental (increasing from 33% at the commencement of support), and
- over 9,000 clients (19%) in public/community housing (increasing from 12% at the commencement of support).
Figure MH.4: Clients with a current mental health issue, by housing situation at the beginning and end of support, 2016–17
Notes
- The SHSC classifies clients living with no shelter or improvised/inadequate dwelling, short-term temporary accommodation, or in a house, townhouse, or flat with relatives (rent free) as homeless. Clients living in public or community housing (renter or rent free), private or other housing (renter or rent free), or in institutional settings are classified as housed.
- No shelter/improvised includes inadequate dwellings; short-term accommodation includes temporary and emergency accommodation; couch surfer/no tenure includes living in a house, townhouse or flat with relatives rent free; public/community housing includes both renting or rent free; and private/other housing includes both renting or rent free.
- Proportions include only clients with closed support at the end of the reporting period.
Source: Specialist homelessness services 2016–17, National supplementary table MH.4.
For some stable housing (public or community housing, private or other housing, or Institutional settings) is more difficult to achieve than for others. For clients with a current mental health issue and presenting to agencies housed, but at risk of homelessness, 85% of clients ending support were assisted to maintain housing (Table MH.2):
- Agencies were able to assist 8 in 10 clients living in public or community housing to maintain their tenancy (80%, or 4,400 clients) with a further 9% assisted into private/other housing.
- Similarly, agencies were able to assist 8 in 10 clients in private/other housing to maintain their tenancy (78%, or about 12,000) with a further 7% assisted into public or community housing.
Of those clients with a current mental health issue who were homeless when they began support:
- Thirty-nine per cent were assisted into stable housing at the end of support; 61% remained homeless.
- Agencies were best able to assist couch surfers into stable housing (41%, or nearly 3,300 clients) and those in short-term emergency accommodation (44%, or about 3,400 clients). In both instances, the majority were housed in private/other housing.
A challenge for SHS agencies is finding suitable housing options for clients. SHS agencies were able to assist many clients with a current mental health issue to either find or maintain housing, however, consistent with other studies, exiting homelessness for these clients can be difficult (Chamberlain & Johnson 2013).
Table MH.2: Clients with a current mental health issue, by housing situation at beginning and end of support, 2016–17 (per cent)
| Situation at beginning of support | Situation at end of support: homeless |
Situation at end of support: housed |
|---|---|---|
| Homeless | 60.7 | 39.3 |
| At risk of homelessness | 14.6 | 85.4 |
Notes
- The SHSC classifies clients living with no shelter or improvised/ inadequate dwelling, short-term temporary accommodation, or in a house, townhouse, or flat with relatives (rent free) as homeless. Clients living in public or community housing (renter or rent free), private or other housing (renter or rent free), or in institutional settings are classified as housed.
- Proportions include only clients with closed support at the end of the reporting period. Per cent calculations are based on total clients, excluding ‘Not stated/other’.
Source: Specialist homelessness services 2016–17, National supplementary table MH.4.
Reference
- Mental Health Council of Australia (MHCA) 2009. Home Truths: Mental Health, Housing and Homelessness in Australia.
- Duff, C., Jacobs, K., Loo, S. and Murray, S. (2013) The role of informal community resources in supporting stable housing for young people recovering from mental illness: key issues for housing policy-makers and practitioners, AHURI Final Report No. 199, Australian Housing and Urban Research Institute Limited, Melbourne, https://www.ahuri.edu.au/research/final-reports/199.
- Wood, L., Flatau, P., Zaretzky, K., Foster, S., Vallesi, S. and Miscenko, D. (2016) What are the health, social and economic benefits of providing public housing and support to formerly homeless people?, AHURI Final Report No. 265, Australian Housing and Urban Research Institute Limited, Melbourne, https://www.ahuri.edu.au/research/final-reports/265, doi:10.18408/ahuri-8202801.
- Australian Bureau of Statistics (ABS) 2014. Mental Health and Experiences of Homelessness, Australia, 2014. ABS cat no. 4329.0.00.005. Canberra: ABS.
- Chamberlain C, & Johnson G 2013. Pathways into adult homelessness. Journal of Sociology, 49(1): 60–77.