Clients, services and outcomes
Specialist homelessness agencies provide a wide range of services to assist those who are homeless or at risk of homelessness, ranging from general support and assistance to immediate crisis accommodation. This section outlines the characteristics of all clients assisted by specialist homelessness agencies in 2016–17, describes their needs for assistance and the services they received. It also provides some key trends for the 5 years from 2012–13 to 2016–17.
Key findings in 2016–17
- Client numbers increased 3% from 2015–16 to over 288,000 with the rate per 10,000 population reaching 119.1, up from 117.1 the previous year.
- Most clients seeking assistance were housed, but ‘at risk’ of becoming homelessness (56%); of these, most were living in private/other housing (88,000, or 61%), or social housing at the time (35,000 or 24%).
- A high proportion of the ‘at risk’ population had experienced domestic and family violence (40%).
- Clients are getting older: 1 in 5 clients were aged over 45 years (over 58,000 clients), an 8% increase in client numbers compared with 2015–16. By comparison, there was a 2% increase in clients aged under 45 years over the same period.
- Just over half (51%) of the clients in 2016–17 had also received SHS assistance at some time in the previous 5 years.
- The proportion of clients receiving accommodation has decreased slightly (30% compared with 31% in 2015–16), although the median length of accommodation has remained the same at 33 nights.
- For clients at risk of homelessness seeking assistance, agencies assisted 9 in 10 clients to maintain housing; most of these clients were in private/other housing when they began support (70,000 compared with 27,000 in public/community housing).
- 4 in 10 clients were homeless on presentation to a SHS agency; agencies assisted about 39% into housing following support. Most were assisted into private/other dwellings (about 16,000) and a further 11,000 into social housing.
- The average amount of financial assistance provided totalled $640 per client, up from $520 in 2015–16 (not adjusted for inflation).
Clients: 2012–13 to 2016–17
Over 940,000 Australians have been supported by homelessness agencies since the collection began in 2011–12.
The estimated number of clients assisted by agencies each year has increased from 244,176 in 2012–13 to 288,273 in 2016–17. This represents an average annual growth rate of 4.2%.
Because SHSC data provide a measure of the service response, increases in client numbers generally reflect the increased availability and accessibility of services, not necessarily a change in the underlying level of homelessness in Australia. The rate of specialist homelessness service use has increased from 107 people per 10,000 in 2012–13 to 119 in 2016–17 (Supplementary Historical Tables). That is, from 1 in 93 people in the Australian population to 1 in 84.
The characteristics of clients, the main reason for seeking support, and the services provided to clients, have remained relatively stable over the past 5 years (Table Client Trends.1). There have, however, been some notable changes:
- Clients are supported for longer: The median number of days a client was supported has increased from 31 days in 2012–13 to 37 days in 2016–17, an average annual growth of 4.5% each year.
- Tenancy assistance services are increasingly needed: The proportion of clients who were identified as needing assistance to sustain tenancy or prevent tenancy failure or eviction increased from 29% in 2012–13 to 33% in 2016–17.
- Males are more likely to be homeless on presentation than females: the proportion of males who were homeless on presentation has decreased from 57% of males in 2012–13 to 51% in 2016–17. The proportion of females who were homeless on presentation was similar over this period (38%), with the majority of females presenting at risk of homelessness (62%).
- More females than males presented homeless in 2016–17: For the first time since the Collection began in 2011–12 the number of females presenting homeless in 2016–17 (57,547) has overtaken the number of males (54,169) (up from 39,876 and 42,519 in 2012–13, respectively).
- Clients over 45 are increasing: Between 2012–13 and 2016–17 there has been a small but steady increase each year in the proportion of clients aged over 45 years from 18% (or nearly 45,000) in 2012–13 to 1 in 5 clients (20%, or over 58,000) in 2016–17.
- While small, clients 65 and over are the fastest growing group: The number of clients aged 65 and over increased from nearly 6,000 in 2012–13, over 8,000 in 2016–17 (3% of the SHS population). The average annual growth rate was higher for Indigenous clients aged over 65, than non-Indigenous clients (18% each year compared with 11%, respectively).
- Services are successful in maintaining the housing of those at risk: Clients housed, but at risk of homelessness remain the majority of clients seeking assistance from specialist homelessness services (56% in 2016–17). There have been increases in the proportion of these clients housed following support. For example, 93% of clients assisted who were living in public and community housing remained housed in 2016–17, up from 91% in 2012–13; similar increases were seen for clients who were living in private/other housing when they sought assistance (91%, up from 89% in 2012–13).
- Clients remaining homeless following support are declining: Agencies have been achieving better housing outcomes following support especially for those beginning support homeless. There has been a 12 percentage point decline in the proportion of these clients ending support homeless over the past 5 years, down from 73% in 2012–13.
- Housing options for SHS clients presenting homeless are changing: Five years ago similar numbers of these clients were housed in either social housing or private/other tenancies at the end of support (5,800 and 6,300, respectively). In 2016–17 the number of clients in this group assisted into housing has grown 2.2 fold to 27,000. Six in 10 (or 16,000) were housed in private/other dwellings.
- The proportion of clients ending support having achieved no case management goals has remained steady since 2012–13 at about 7%.
49% of clients nationally in 2016–17 were new, first time clients
Support days increased nationally by 1.2 million days in 2016–17 to over 23.4 million
Table Client Trends.1: SHS clients: at a glance— 2012–13 to 2016–17
| 2012–13 | 2013–14 | 2014–15 | 2015–16 | 2016–17 | |
|---|---|---|---|---|---|
| Number of clients | 244,176 | 254,001 | 255,657 | 279,196 | 288,273 |
| Rate (per 10,000 population) | 107.4 | 109.7 | 108.8 | 117.1 | 119.1 |
| Housing situation at the beginning of the first support period (proportion all clients) | |||||
| Homeless | 43 | 42 | 43 | 44 | 44 |
| At risk of homelessness | 57 | 58 | 57 | 56 | 56 |
| Total days of support (millions) | 20.6 | 20.6 | 19.7 | 22.2 | 23.4 |
| Length of support (median number of days) | 31 | 33 | 33 | 35 | 37 |
| Proportion receiving accommodation | 36 | 34 | 33 | 31 | 30 |
| Total nights of accommodation (millions) | 7 | 7 | 6.6 | 7 | 6.9 |
| Median number of nights accommodated | 34 | 35 | 34 | 33 | 33 |
| Achievement of all case management goals (per cent) | 22 | 24 | 26 | 23 | 23 |
Notes
- Rates are crude rates based on the Australian estimated resident population (ERP) at 30 June of the reference year. Minor adjustments in rates may occur between publications reflecting revision of the estimated resident population by the Australian Bureau of Statistics.
- The denominator for the proportion achieving all case management goals is the number of client groups with a case management plan (Supplementary table CLIENTS.26). Denominator values for proportions are provided in the relevant National supplementary table.
Source: Specialist Homelessness Services Collection 2012–13 to 2016–17.
Clients, services and outcomes 2016–17
Support periods
Data collected by specialist homelessness agencies are based on support periods, or episodes of assistance provided to clients (see Technical information for further information). Clients may have had more than one support period in 2016–17, either with the same agency at different times, or with different agencies.
In 2016–17 more support was provided by homelessness agencies than in 2015–16, and this increase was consistent with agencies assisting more clients.
- In 2016–17, clients assisted by homelessness agencies were supported in 498,503 support periods, a 4% rise compared with 2015–16. The number of support periods has increased by an average annual growth of 4.9% each year since 2012–13 (Supplementary table CLIENTS.19 and historical table 1).
- Around two-thirds of clients in 2016–17 had only 1 support period (67%), while just under 1 in 5 (19%) had 2 support periods, 7% had 3 periods and 7% had 4 or more. The number of support periods per client is consistent with the previous year (1.7 support periods per client).
- The majority of support periods were opened and closed within 2016–17 (77%, or just over 380,000). An additional 12% of support periods opened during the year and remained open on 30 June 2017. Just 1.7% remained open throughout the 2016–17 reporting period (Figure CLIENTS.1).
Figure CLIENTS.1: Support periods, by indicative duration over the reporting period, 2016–17
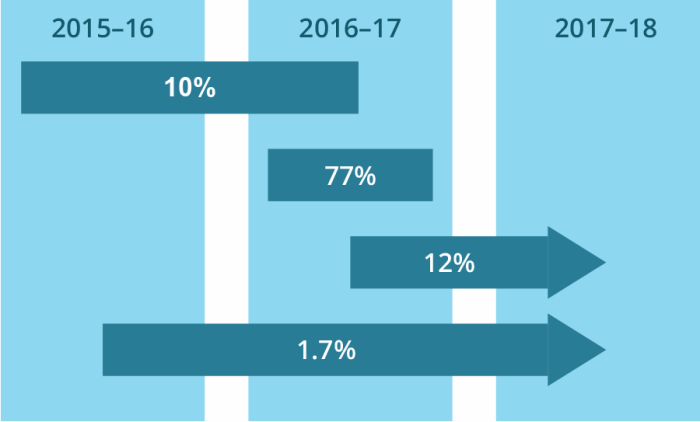
Source: Specialist homelessness services 2016–17, National supplementary table CLIENTS.19.
Number of days clients received support
- In 2016–17, clients were supported for an average of 81 days in total, either as consecutive days or over multiple periods of support. This is up from 79 days in 2015–16. The median number of support days has also increased over this time period (from 35 to 37 days).
- Males (37 days) and females (36 days) received a similar length of support.
- The needs of some clients can be met relatively quickly, but for those with more complex issues, significantly more support is needed. About 3 in 10 clients (29%, or about 85,000) received between 6 and 45 days of support during 2016–17; 25% received support for 5 or fewer days. Fifteen per cent received over 180 days of support during 2016–17; the same proportion received support for 91–180 days (15%).
Reasons that support ended
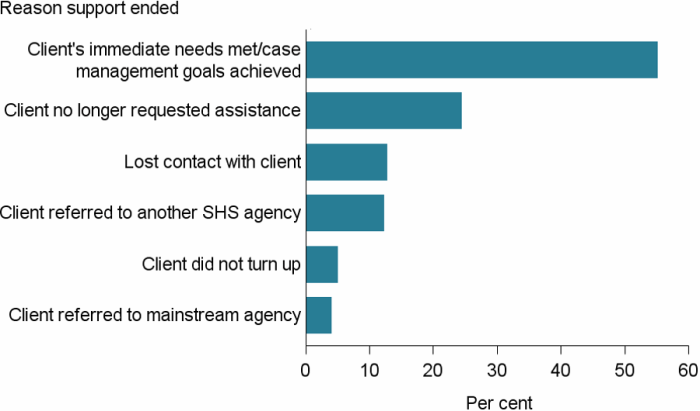
- Around half (55%) of support periods ended in 2016–17 because the client’s immediate needs were met or case management goals were achieved.
- About a quarter (24%) of support periods ended because the client no longer requested assistance.
- A further 12% of support periods closed because the client was referred to another specialist homelessness agency and 13% closed because contact was lost with the client (Figure CLIENTS.2).
Figure CLIENTS.2: Clients, by reason support period ended (top 6), 2016–17
Notes
- Top 6 excludes ‘Other’ reason.
- Includes clients with any closed support at the end of the reporting period.
Source: Specialist homelessness services 2016–17, National supplementary table CLIENTS.21.
Characteristics of clients
In 2016–17, specialist homelessness agencies provided assistance to an estimated 288,273 clients, equivalent to 1 in 84 people in the Australian population (Supplementary table CLIENTS.2). This represents an increase from 1 in 85 since 2015–16.
Age and sex
Figure CLIENTS.3 illustrates the age and sex distribution of SHS clients in 2016–17:
- The majority of clients in 2016–17 were female (60%, or nearly 173,000), representing a slight increase since 2015–16.
- The overall rate of service use was higher for females; 1 in 71 females in the Australian population received specialist homelessness services, compared with 1 in 104 males.
- Female rates of service use were higher than males in all age groups.
- Nearly 3 in 10 clients were aged under 18 (28%, or nearly 82,000)
- One in 6 were children under the age of 10 (16%, or about 47,000 clients)
- Overall, clients aged 25–34 were the largest age group, accounting for around 1 in 5 clients (19%). Of all clients aged 25–34 years, 7 in 10 (69%) were female.
- Adult males aged 35–44 have the highest rate of service use for males (16%), while adult females aged 25–34 have the highest rate for females (21%).
Figure CLIENTS.3: Clients, by age and sex, 2016–17
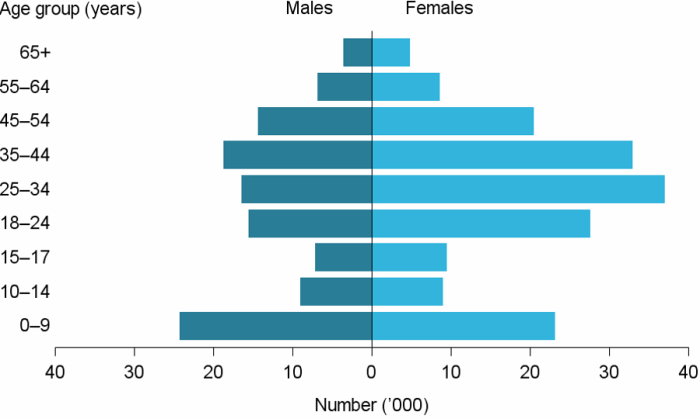
Source: Specialist homelessness services 2016–17, National supplementary table CLIENTS.1.
Indigenous status
In 2016–17, Aboriginal and Torres Strait Islander people continued to be over-represented among specialist homelessness services clients, with a quarter of clients (25%, or 64,600) who provided information on their Indigenous status identified as being of Aboriginal and/or Torres Strait Islander origin. By comparison, just 3.3% of the Australian population identify as Aboriginal and Torres Strait Islanders [1].
Further information about Indigenous clients can be found in Indigenous clients.
State and territory of clients
The largest number of clients were assisted in Victoria (109,901), followed by New South Wales (74,216) and Queensland (41,438) (Supplementary table CLIENTS.2).
Nationally, the number of SHS clients increased by 3%, or 9,077 clients. This was due to increases in client numbers in Victoria (4%, or 4,614), New South Wales (6%, or 4,501), the Northern Territory (13%, or 1,055) and Western Australia (2%, or 423). Queensland (-3%), South Australia (-1%), Tasmania (-1%) and the Australian Capital Territory (-1%) all reported decreases in client numbers compared with 2015–16.
- Overall, half of clients in 2016–17 had received services before: The proportion of returning clients varied across jurisdictions with South Australia and the Australian Capital Territory reporting the highest proportion (60% and 56%, respectively). New South Wales reported the lowest proportion of returning clients (47%).
- More days of support were provided during 2016–17: Nationally there has been an increase in the total number of support days, with an increase of 1.2 million days in 2016–17 to over 23.4 million. Victoria was responsible for the major share of the increase in support days (an increase of over 520,000 days). Tasmania reported the greatest change, up 21% (or nearly 134,000 days) since last year.
- Fewer accommodation nights were provided to clients: There has been a decrease nationally in the total number of accommodation nights, with a 1% decrease (nearly 89,000 nights) from 2015–16. Western Australia had the largest decrease in accommodation nights with a reduction of about 52,500 nights (9%) provided between 2015–16 and 2016–17 (see explanatory notes in supplementary tables for information).
- Females had higher rates of service use than males across all states and territories: The Northern Territory had the most pronounced difference between males and females, where 497 per 10,000 females received services compared with 258 per 10,000 males (Supplementary table CLIENTS.2).
- The Northern Territory had the highest rate of service use: The highest rates of estimated service use occurred in the Northern Territory (where there were 374 clients per 10,000 people), followed by Victoria (178 clients per 10,000 people) and Tasmania (151 clients per 10,000 people) (Figure CLIENTS.4).
- New South Wales and Tasmania had on average the largest growth in rates of service use each year since 2012–13 (average annual growth of 8% each year).
Figure CLIENTS.4: Client service use per 10,000 population, by state and territory, 2016–17
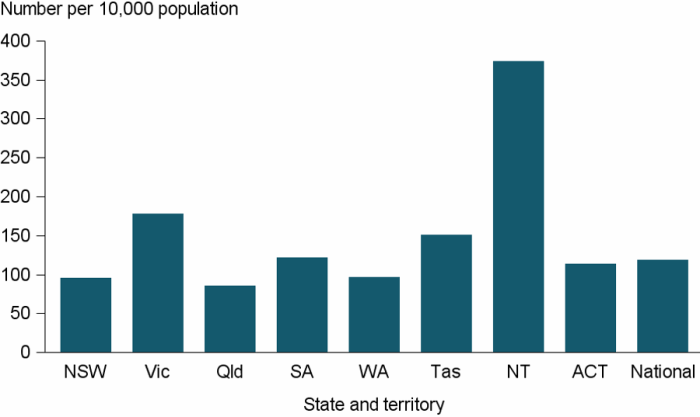
Note: Rates are crude rates as detailed in Technical information.
Source: Specialist homelessness services 2016–17, National supplementary table CLIENTS.2.
Country of birth
- Most clients of specialist homelessness agencies were born in Australia: Over 8 in 10 clients (86%, or nearly 212,000) were born in Australia (Supplementary table CLIENTS.3). This proportion is higher than the general Australian population, of whom 71% are born in Australia [2].
- Clients born overseas were most commonly from New Zealand: Of those clients who reported their country of birth and were born overseas, the most common country of birth was New Zealand (2%) (Supplementary table CLIENTS.4). Over half of the clients (52%) who were born overseas had arrived in Australia prior to 2007 (Supplementary table CLIENTS.5).
- The majority of clients who were born overseas lived in Major cities (86%, or nearly 30,000).
Living arrangements
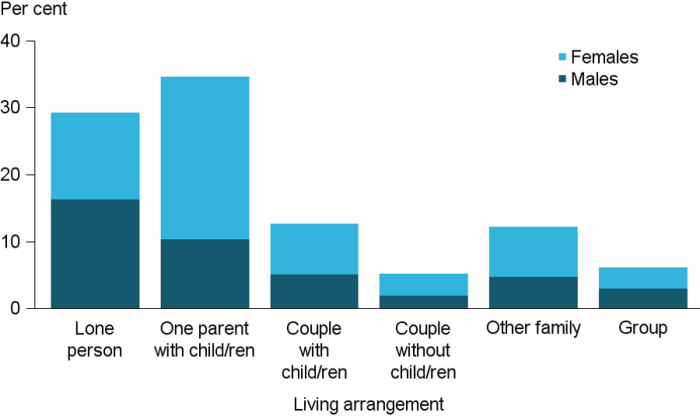
- More than one-third of clients were single parents: The most common living arrangement reported by clients was ‘lone parent with 1 or more children’ (35%, or around 90,500), followed by ‘lone persons’ (29%, or around 76,500) and couples with a child or children (13%, or around 33,000) (Figure CLIENTS.5).
- 7 in 10 single parents were female: Female clients were more likely than male clients to be living as a single parent with a child or children (70% female), while males were more likely than females to be living alone (56% male) (Supplementary table CLIENTS.6).
Figure CLIENTS.5: Clients, by living arrangement, 2016–17
Source: Specialist homelessness services 2016–17, National supplementary table CLIENTS.6
Housing situation
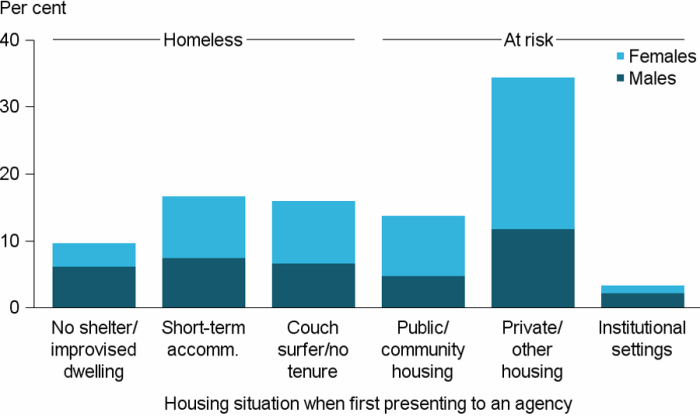
- Almost 6 in 10 clients were at risk, rather than homeless on presentation: Among those whose housing status at the beginning of their first support period was known in 2016–17 (89% of all clients), 44% (nearly 112,000 clients) were homeless and 56% (nearly 144,000 clients) were classified as at risk of homelessness (Figure CLIENTS.6).
- Most commonly, clients seeking assistance were living in ‘private housing’: One in 3 clients (34%, or nearly 88,000) were living in private or other housing (renter, rent free, or owner) when presenting to agencies for assistance—these clients were at risk of homelessness.
- Over 1 in 5 ‘rough sleepers’ were living in their cars: For those clients who first presented to an agency homeless and reporting no shelter/improvised dwelling (nearly 25,000 clients), 46% were sleeping in no dwelling, either on the street, in a park or out in the open and a further 23% were sleeping in a car.
Figure CLIENTS.6: Clients, by housing situation at the beginning of support, 2016–17
Notes
- Per cent calculations based on Total clients, excluding ‘Not stated’.
- Housing situation ‘Other’ not shown.
Source: Specialist homelessness services 2016–17, National supplementary table CLIENTS.7.
Source of referral
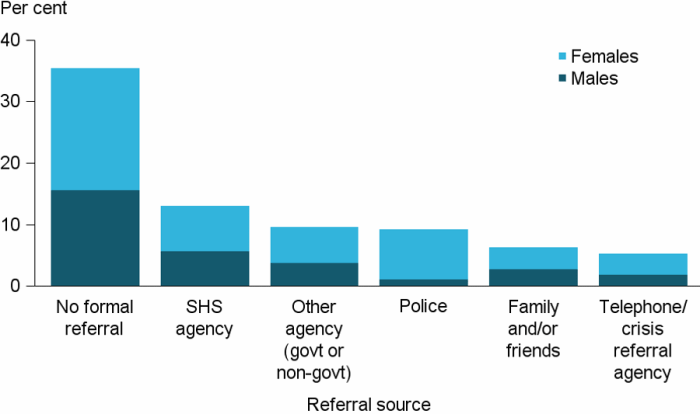
- Two-thirds of clients were formally referred to the agency: In 2016–17, just over 180,000 clients, almost 2 in 3 (65%) were formally referred to a specialist homelessness agency.
- Almost 1 in 10 were referred by police: Figure CLIENTS.7 shows that the most common referral source was by either another specialist homelessness agency or outreach worker (13%), other agency (government or non-government) (10%), or by the police (9%).
- Police referrals to SHS agencies were more likely to be for females than males: Of all referrals from the police, 87% were for females and 13% for males (Supplementary table CLIENTS.9).
Figure CLIENTS.7: Clients, by source of referral (top 6), 2016–17
Note: Top 6 excludes formal referral source ‘Other’.
Source: Specialist homelessness services 2016–17, National supplementary table CLIENTS.9.
Main source of income
- Income support receipt was high among clients: A high proportion of clients aged 15 and over were receiving some form of government payment as their main income source at the time they sought support (79%) in 2016–17. The most common government payments were Newstart Allowance (29%, or about 54,000), Parenting Payment (18%, or nearly 35,000) and Disability Support Pension (16%, or nearly 30,000).
- Less than 1 in 10 clients reported earning income from employment: A total of 7% reported income from employment and 10% of clients reported having no income.
Education
- Overall, more than half of young people were enrolled in education: Of those whose educational status was known, over half of young people aged 5–24 (56%, or over 48,000) were enrolled in education in 2016–17 (Supplementary table CLIENTS.11).
- Over 8 in 10 clients aged 5–14 were enrolled in school: Just 15% of clients aged 5–14 (about 5,100) were not enrolled in education—1 in 7 (15%) children aged 6 were not in school.
- Around one-third of young people in neither education nor employment: Thirty-one per cent of clients aged 15–24 were not in some form of education or employment (around 18,300 clients).
Labour force
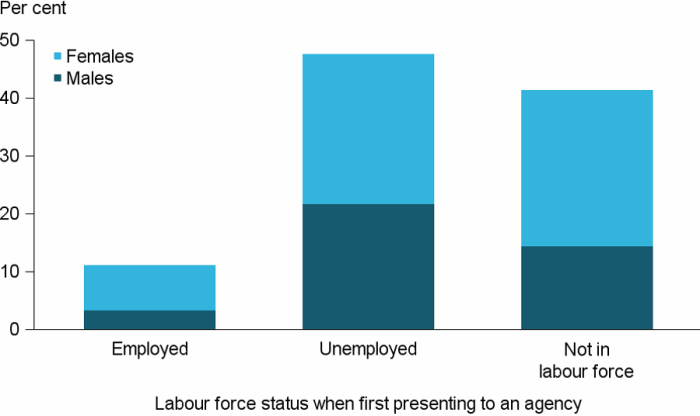
- Labour force participation fell slightly in 2016–17: The proportion of clients not in the labour force at the beginning of support in 2016–17 was slightly lower than in 2015–16 (41% and 43%, respectively) (Figure CLIENTS.8).
- Almost half the clients 15 and over were unemployed: Nearly 88,000 (48%) clients aged 15 or over were unemployed at the beginning of support.
- Males were more likely to be unemployed than females: Over half of male clients were unemployed (55%) compared with 43% of female clients.
- Most employed clients work part-time: 11% of clients were employed; of these, around 3 in 5 (62%) were employed on a part-time basis.
Figure CLIENTS.8: Clients aged 15 and over, by labour force status at the beginning of support, 2016–17
Source: Specialist homelessness services 2016–17, National supplementary table CLIENTS.12
Clients’ needs for assistance and services provided
In the SHSC, information is captured about clients’ needs for services from 2 perspectives:
- The client’s reasons for seeking assistance are captured at the start of support—both main reason for seeking support and all reasons for seeking support are collected.
- The agency worker’s assessment of the client’s needs—this information is captured when clients first present for assistance and each month while a client is still in contact with the agency.
Technical information and the Glossary provides more information about how clients’ needs for assistance are captured in the SHSC.
Services provided to clients range from the direct provision of accommodation, such as a bed in a shelter, to specialised services such as counselling and legal support. These services are generally either provided to the client directly by the agency or the client is referred to another service. Unmet demand provides further information about clients’ needs that went unmet.
Reasons for seeking assistance
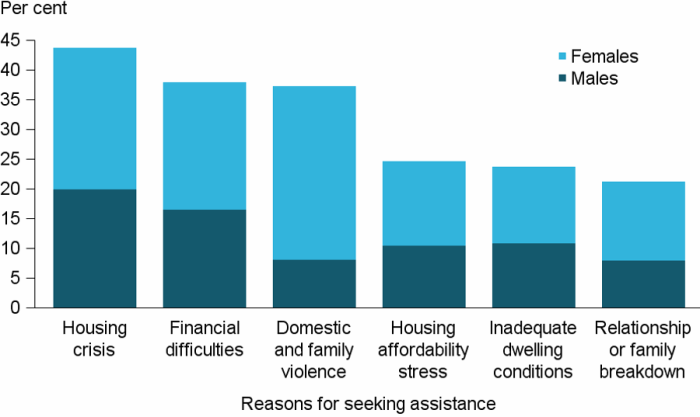
SHS clients can identify a number of reasons for seeking assistance, reflecting the range of situations that contribute to housing instability.
- Accommodation issues were present for over half of all clients: Over half of clients (56%, or nearly 160,000 clients) identified accommodation as a reason for seeking assistance, the same as in 2015–16.
- Almost half were experiencing a housing crisis: ‘Housing crisis’ was identified by 44% of clients as a reason for seeking assistance.
- Over 6 in 10 clients were affected by housing affordability stress: Sixty-two per cent of clients identified housing affordability stress and/or financial difficulties as a reason for seeking assistance (Figure CLIENTS.9).
- Interpersonal and relationship issues (including family and domestic violence) affected over half of clients: Half (52%) of all SHS clients (about 148,000) identified interpersonal relationships as a reason for seeking support; within this group domestic and family violence and/or relationship/family breakdown were identified for 58% of clients.
- Over 1 in 5 clients were experiencing health issues: Health issues remain one of the common reasons clients seek assistance. Mental health, medical issues or problematic substance use were recorded as one of the reasons for seeking assistance for over 1 in 5 (22%) clients.
- Many clients were affected by a lack of support: Lack of family or community support was one of the reasons for seeking support for around 1 in 5 (18%) clients.
Figure CLIENTS.9: Clients, by all reasons for seeking assistance (top 6), 2016–17
Source: Specialist homelessness services 2016–17, National supplementary table CLIENTS.13.
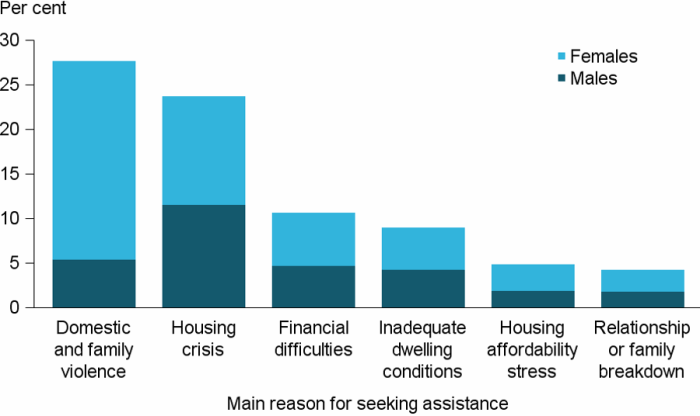
While clients can identify a number of reasons for seeking assistance, agencies also record the main reason for seeking assistance.
- Domestic and family violence was the most common main reason for seeking assistance: Domestic and family violence was identified as the main reason for seeking assistance (Figure CLIENTS.10) for over one-quarter of clients (28% or about 79,000). For more information see Clients who have experienced domestic and family violence.
- Almost 1 in 4 identified ‘housing crisis’ as the main reason for seeking assistance: Housing crisis was reported by 24% of clients as the main reason for seeking assistance.
Figure CLIENTS.10: Clients, by main reason for seeking assistance (top 6), 2016–17
Source: Specialist homelessness services 2016–17, National supplementary table CLIENTS.14.
General support and assistance
Some types of assistance provided by SHS agencies can be described as ‘general support and assistance’ (as opposed to more specialised services). These include advice and information, material aid, meals and living skills.
- Clients continue to most commonly need advice and information: Of all assistance needed by clients, advice and information continued to be the most common, identified as a need by 79% of clients (over 228,000) in 2016–17. The next most common was advocacy and liaison, needed by 53% of clients (nearly 153,000), and 35% of clients (nearly 102,000) needed material aid/brokerage (Figure CLIENTS.11).
- Services almost always provided the required advice and information: Advice/information and advocacy/liaison services were provided directly by the agency for almost all clients who needed them. This differs from some specialised services (such as legal information and training or employment assistance) for which clients were more often referred to another agency.
- Requests for assistance for domestic and family violence rose: In 2016–17 there were about 14,000 more requests for assistance with domestic and family violence, family/relationship assistance and assistance for trauma than in the previous year, a 9% rise.
- Requests for accommodation also rose: There were over 11,000 more requests for accommodation services compared with 2015–16, a 4% rise.
Figure CLIENTS.11: Clients, by most needed general services and service provision status (top 10), 2016–17
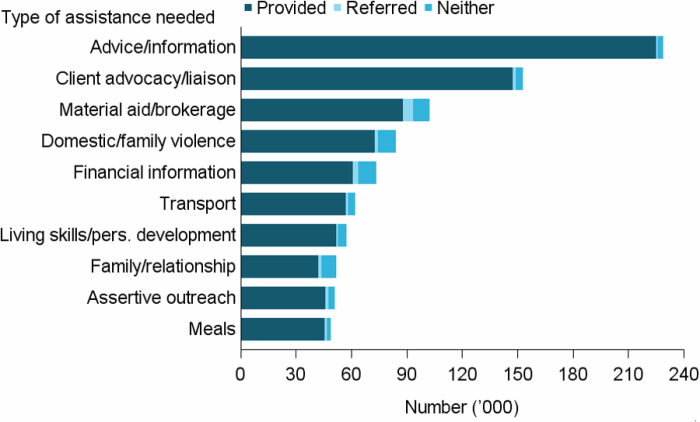
Note: Top 10 excludes ‘Other basic assistance’.
Source: Specialist homelessness services 2016–17, National supplementary table CLIENTS.15.
Housing/accommodation services
Housing and accommodation services provided by agencies include:
- short-term or emergency accommodation;
- medium-term/transitional housing;
- long-term housing;
- assistance to sustain tenancy or prevent tenancy failure or eviction;
- assistance to prevent foreclosures or for mortgage arrears.
In 2016–17, 56% of SHS clients identified a need for accommodation services. Of these nearly 162,000 clients:
- 86,000 (or 53%) were provided with accommodation by the agency.
- 27,000 (or 16%) were referred to another agency for accommodation provision.
- 49,000 (or 30%) were neither provided with assistance nor referred. These clients are further described in Unmet demand.
The ability of services to provide accommodation has fallen since last year. The proportion of SHS clients in 2016–17 who identified a need for accommodation assistance was the same as in 2015–16 (56%). However, the proportion of these clients who were subsequently provided with accommodation has decreased in 2016–17 (53% compared with 56% in 2015–16).
6.9 million nights of accommodation were provided to clients in 2016–17— fewer than the previous year.
Around 6.9 million nights of accommodation were provided to clients in 2016–17, nearly 90,000 (or 1%) fewer than 2015–16. Total nights of accommodation may represent more than one period of accommodation during 2016–17 (Supplementary table CLIENTS.16) (see Technical information for details on how length of accommodation is calculated).
- The median length of accommodation received by clients was 33 nights.
- Most of the accommodation was provided in medium-term or transitional housing (54%) followed by short-term or emergency accommodation (38%) and long-term housing (7%).
Assistance to sustain tenancy/prevent eviction was needed by 33% of clients at some stage during their support in 2016–17, the same proportion as the previous year. This group includes those who were still housed when they approached an SHS agency and were supported to remain in that housing. It also includes those who identified a need for accommodation, were assisted to secure new housing and then supported to sustain that housing.
- Most clients (80%, or about 78,000) received assistance to sustain housing directly from the specialist homelessness agency.
- There has been, on average, a 8% annual growth in the proportion of clients needing assistance to sustain tenancy each year since 2012–13.
Specialised services
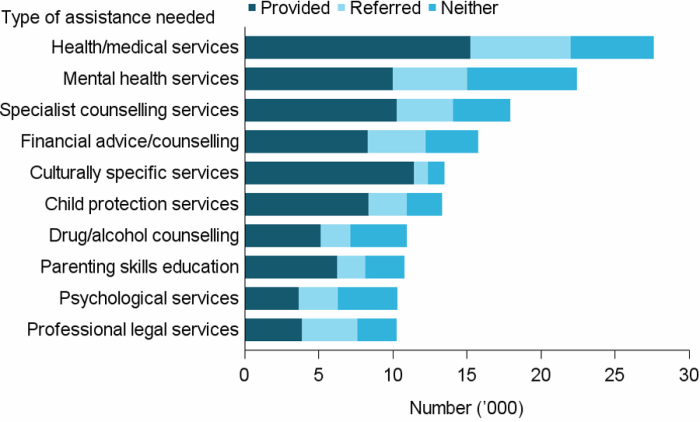
- Health service needs are often referred by agencies: Health/medical services were identified as a need by 1 in 10 clients (or nearly 28,000) and were one of the services most often referred (25%) (Figure CLIENTS.12).
- There has been little change in the most common specialised services needed and provided over the past 5 years. For example, health and medical services, mental health services and specialist counselling have been the most commonly needed services.
Figure CLIENTS.12: Clients, by most needed specialised services and service provision status (top 10), 2016–17
Notes
- Excludes ‘Other specialised service’.
- ‘Neither’ indicates a service was neither provided nor referred.
Source: Specialist homelessness services 2016–17, National supplementary table CLIENTS.15.
Financial assistance
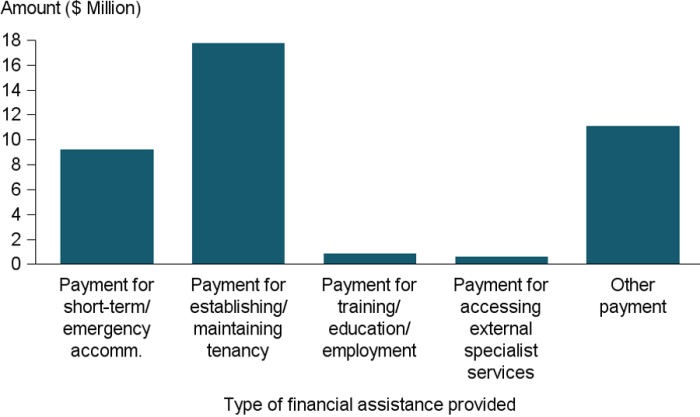
$39.5 million in financial assistance was provided to clients in 2016–17—an increase from the previous year.
A total of $39.5 million in financial assistance was provided to clients in 2016–17 (Figure CLIENTS.13), a 33% increase from the $29.6 million provided in 2015–16.
- This represents an average of $640 per client requesting financial assistance, and an increase from the previous year ($520, unadjusted for inflation).
Over half of the financial assistance was used to assist clients with housing:
- Almost half of the funds went to establishing or maintaining tenancies: Around $17.7 million (45%) of the financial assistance was used to assist clients to establish or maintain their existing tenancy.
- Nearly a quarter of this funding (23%, or $9.2 million) was used to provide short-term or emergency accommodation.
Figure CLIENTS.13: Total amount of financial assistance provided to clients, by payment type, 2016–17
Source: Specialist homelessness services 2016–17, National supplementary table CLIENTS.17.
Outcomes following support
This section looks at clients who ceased receiving support during the financial year—meaning that their support periods had closed and they did not have ongoing support at the end of the year. The outcomes presented here are examining changes in clients’ situations from the start to the end of all support. Many clients had long periods of support or even multiple support periods during the year. They may have had a number of changes over the course of their support (for example, their housing situation may change a number of times during support). These changes within the year are not reflected in the data presented here, rather the client situation at the start of their first period of support during 2016–17 is compared with the end of their last period of support during the year.
Clients whose support period both opened and closed in 2016–17 accounted for 77% of all clients (Figure CLIENTS.1). A proportion of these clients may seek assistance again in future years.
Housing outcomes
Three aspects of a client’s housing situation are considered in their housing circumstances: dwelling type, housing tenure, and the conditions of occupancy. See Technical information for details on these categories and their derivation.
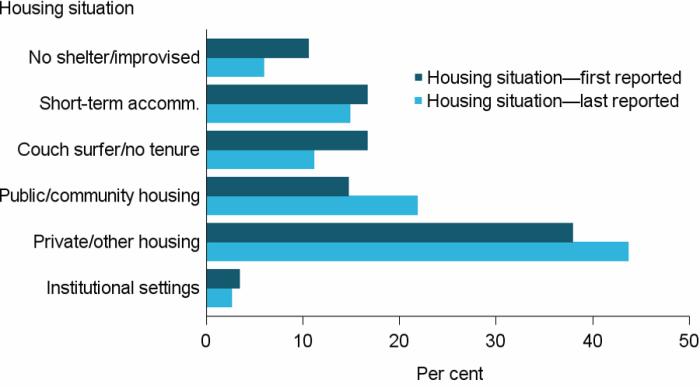
- Agencies significantly reduced the number of clients who were homeless: One in 3 clients (32%, or nearly 57,000) were homeless when support ended, a decrease from 44% at the start of support (Supplementary table CLIENTS.22).
- Clients rough sleeping and couch surfing reduced following support: The reduction in the proportion of clients homeless following support was due to decreases in both the proportion of clients with either no shelter or living in improvised dwellings (from 11% to 6%) and in the proportion of clients living in a house, townhouse or flat as a ‘couch surfer’ with no tenure (from 17% to 11%).
- Clients living in social housing increased following support: There was an increase in some forms of tenure over the course of support, including an increase in the proportion of clients living in public or community housing (from 15% to 22%, or about 39,000 clients) (Figure CLIENTS.14).
These trends demonstrate that by the end of support, many clients have achieved or progressed towards more stable housing. Stable housing, for the purpose of the SHSC, refers to clients ending support in public or community housing (renter or rent free), private or other housing (renter, rent free or owner), or Institutional settings.
Figure CLIENTS.14: Clients, by housing situation at beginning of support and end of support, 2016–17
Notes
- The SHSC classifies clients living with no shelter or improvised/inadequate dwelling, short-term temporary accommodation, or in a house, townhouse, or flat with relatives (rent free) as homeless. Clients living in public or community housing (renter or rent free), private or other housing (renter or rent free), or in institutional settings are classified as housed.
- No shelter/improvised includes inadequate dwellings; short-term accommodation includes temporary and emergency accommodation; couch surfer/no tenure includes living in a house, townhouse or flat with relatives rent free; public/community housing includes both renting or rent free; and private/other housing includes both renting or rent free.
- Proportions include only clients with closed support at the end of the reporting period. Per cent calculations are based on total clients, excluding ‘Not stated/other’.
Source: Specialist homelessness services 2016–17, National supplementary table CLIENTS.22.
While overall housing outcome figures reflect trends towards more stable housing for many clients, there are differences in stable housing achievement for homeless and at risk clients. In general terms, agencies were very successful in preventing those at risk of homelessness from becoming homeless by working to sustain and maintain existing tenancies or establishing new tenancies. For those clients who were homeless, agencies were able to assist those clients into temporary accommodation and sometimes into social or private housing.
The majority of clients presenting to SHS services were housed, but at risk of homelessness. Housing outcomes at the end of support for these clients at risk of homelessness on presentation were favourable (Table Client.2):
- Almost 9 in 10 (86%, or 22,000) who were living in public or community housing were assisted to maintain their existing tenancy and a further 7% (1,700) were assisted into private/other housing.
- Over 8 in 10 who were living in private/other housing were assisted to maintain their housing (85%, or 55,600), while a further 6% (4,000) were assisted into public or community housing.
For clients who were homeless on presentation (Table Client.2):
- About 4 in 10 (39%) were assisted by agencies into stable housing; most were assisted into private/other dwellings (about 16,000) and a further 11,000 into social housing.
- About 4 in 10 (44%) of those who were in short-term accommodation were assisted into stable housing (most of the 12,000 into private/other housing 55%).
Table Client.2: SHS clients, housing situation at beginning and end of support, 2016–17 (per cent)
| Situation at beginning of support | Situation at end of support: homeless |
Situation at end of support: housed |
|---|---|---|
| Homeless | 61.4 | 38.6 |
| At risk of homelessness | 9.5 | 90.5 |
Notes
- The SHSC classifies clients living with no shelter or improvised/inadequate dwelling, short-term temporary accommodation, or in a house, townhouse, or flat with relatives (rent free) as homeless. Clients living in public or community housing (renter or rent free), private or other housing (renter or rent free), or in institutional settings are classified as housed.
- Proportions include only clients with closed support at the end of the reporting period. Per cent calculations are based on total clients, excluding ‘Not stated/other’.
Source: Specialist homelessness services 2016–17, National supplementary table CLIENTS.22
Other outcomes for clients
Specialist homelessness agencies may support clients in a number of non-housing areas to reduce their vulnerability to homelessness. These include changes in educational enrolment status, labour force status and income.
Education
- Educational enrolment remains stable: For clients whose support had ended, there was little change in the proportion of clients enrolled in education/training, from the beginning to the end of support (approximately 22% at the start and end).
- Among those who also had an identified need for support relating to education or training assistance, 42% were enrolled in education/training at the beginning of support, and this increased to 44% at the end of support (Supplementary table CLIENTS.23).
Employment
- Employment increases slightly post support: Figure CLIENTS.15 shows a decrease in the proportion of clients (who had an identified need for employment assistance) who were unemployed following support (55% at the end, down from 61% at the beginning of support).
- Among those clients who had an identified need for employment assistance, the proportion of clients who were employed at the end of their support increased from 12% to 22%.
Figure CLIENTS.15: Clients needing assistance relating to employment, by labour force status at beginning and at end of support, 2016–17
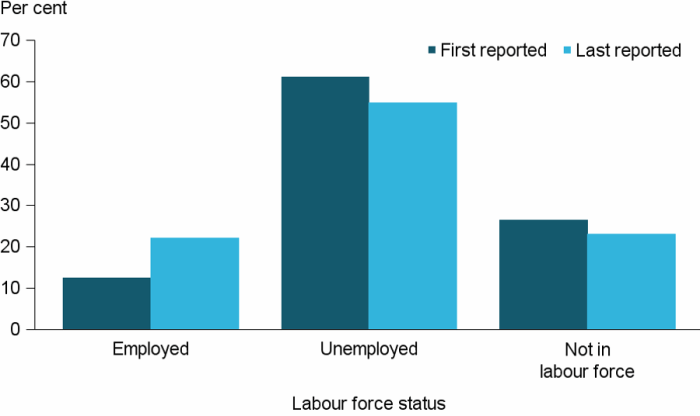
Note: Proportions include only clients with closed support at the end of the reporting period.
Source: Specialist homelessness services 2016–17, National supplementary table CLIENTS.24.
Income
SHS agencies often provide services to clients aged 15 and over needing assistance to obtain/maintain a government payment or employment assistance.
- Agencies assisted clients in receiving a government payment: Of those who needed this type of assistance, the proportion of clients reporting a government payment or allowance as their main income increased from 72% at the start of support to 78% at the end.
- There was a reduction in those reporting that they received no income (from 13% to 9%) and the proportion awaiting government benefits halved (from 7% to 3%) (Figure CLIENTS.16).
Figure CLIENTS.16: Clients needing assistance to secure an income, by main source of income at beginning and at end of support, 2016–17
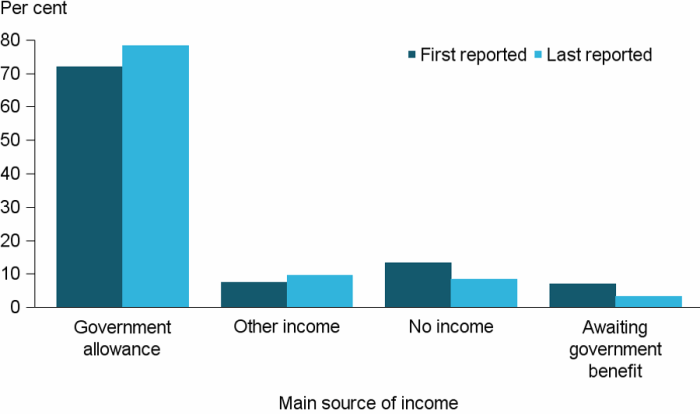
Note: Proportions include only clients with closed support at the end of the reporting period.
Source: Specialist homelessness services 2016–17, National supplementary table CLIENTS.25.
Achievement of case management goals
Case management plans enable agency workers to assist a client to work towards agreed goals. In some cases, support periods are too short to allow for a case management plan (for example, when a client stays for a 24-hour period or less); in other cases, a client may decline a case management plan. Case management approaches can differ across jurisdictions and over time as policy and practices change.
- For those clients with closed support, 62% (or about 140,000 clients) had a case management plan—49% in their own right, and 13% were part of another client’s case management plan, often as part of a family. The proportion of clients with a case management plan was similar in 2015–16 (61%).
- Among those who had a plan in their own right, 70% achieved some of their case management goals, 23% achieved all their goals and 7% did not achieve any (Supplementary table CLIENTS.26). The proportion of clients achieving all their goals was similar when compared to the previous year (23%).
- Of the 38% of clients whose support had ended and who did not have a case management plan, the most common reason given for not having one was that the service episode was too short (69%), while a further 13% did not agree to having a case management plan.
References
- Australian Bureau of Statistics (ABS), 2017. Australian demographic statistics, Mar 2017. ABS cat no. 3101.0. Canberra: ABS.
- ABS 2017. Migration, Australia, 2015–16. ABS cat no. 3412.0. Canberra: ABS.