Clients with problematic drug and/or alcohol use
In 2016–17, almost 27,300 clients, or 9% of specialist homelessness service (SHS) clients, were identified with problematic drug and/or alcohol use. Research has demonstrated that there is a strong association between substance misuse issues and homelessness, in particular the effect of recent or current problematic drug or alcohol use on maintaining ongoing tenancy [1][2].
SHS clients aged 10 and over are identified with problematic drug and/or alcohol use if at the beginning of, or during support the client provided any of the following information:
- recorded their dwelling type as rehabilitation;
- required drug or alcohol counselling;
- was formally referred to the SHS service from an alcohol and drug treatment service;
- during the past 12 months, had been in a rehabilitation facility or institution;
- reported problematic drug, substance or alcohol use as a reason for seeking assistance or the main reason for seeking assistance.
A recent study of clients who received assistance from both specialist homelessness services and alcohol and other drug treatment services highlighted the considerable overlap in these populations in Australia [3]. Many of these clients experienced multiple disadvantages including high levels of social and economic disadvantage, mental health issues, and domestic and family violence.
Key findings in 2016–17
- Almost 1 in 10 clients (9% or 27,000) were identified with problematic drug and/or alcohol use.
- Half (51%) of these clients were aged 25–44.
- Clients received more frequent support (2.9 support periods per client) over a longer period (83 days) than other client groups.
- More than 3 in 4 (77%) needed accommodation.
- Almost 7 in 10 had received homelessness services in the previous 5 years.
- Two-fifths of clients (37%) identified a need for drug and alcohol counselling.
- Of clients who had finished support, 47% ended support homeless, down from 58% at the start. Most of these homeless were housed in short-term or emergency accommodation (22%).
- Agencies assisted 7 in 10 clients with problematic drug and/or alcohol use who were at risk of homelessness, to maintain a housing tenancy.
Clients with problematic drug and/or alcohol use: 2012–13 to 2016–17
Since 2012–13, the number of clients presenting to services with problematic drug and/or alcohol use has risen; from about 22,543 in 2012–13, to 27,295 clients in 2016–17. This group has consistently made up around 1 in 10 SHS clients for each of the 6 years of the collection. Key trends over the past 5 years have been:
- These clients have continued to be more likely than the general SHS population to be homeless—this has remained at about 58% over the past 5 years.
- The rate of service use for this group has increased; from 10 clients per 10,000 population in 2012–13 to just over 11 in 2016–17.
- Over time, the proportion of this group accommodated has fallen; from 58% in 2012–13 to just under half (49%) in 2016–17.
- This group of clients has consistently received more frequent SHS support, over a longer period of time, with more nights of accommodation provided than the general SHS population (Table SUB Trends.1 and Table Client Trends.1). This service use pattern suggests these clients present with complex needs.
- The proportion of these clients with a case management plan has remained high over time, however, those achieving all case management goals has remained low, and this group remains one of the least likely to meet all goals.
Table SUB Trends.1: Clients with problematic drug and/or alcohol use: at a glance—2012–13 to 2016–17
| 2012–13 | 2013–14 | 2014–15 | 2015–16 | 2016–17 | |
|---|---|---|---|---|---|
| Number of clients | 22,543 | 23,253 | 24,225 | 26,505 | 27,295 |
| Proportion of all clients | 9 | 9 | 9 | 9 | 9 |
| Rate (per 10,000 population) | 9.9 | 10.0 | 10.3 | 11.1 | 11.3 |
| Housing situation at the beginning of first support period (proportion of all clients) | |||||
| Homeless | 58 | 57 | 59 | 58 | 57 |
| At risk of homelessness | 42 | 43 | 41 | 42 | 43 |
| Length of support (median number of days) | 83 | 82 | 74 | 77 | 83 |
| Average number of support periods per client | 2.8 | 2.6 | 2.7 | 2.9 | 2.9 |
| Proportion receiving accommodation | 58 | 56 | 53 | 51 | 49 |
| Median number of nights accommodated | 40 | 41 | 39 | 37 | 40 |
| Proportion of a client group with a case management plan | 73 | 75 | 74 | 74 | 75 |
| Achievement of all case management goals (per cent) | 13 | 14 | 16 | 13 | 13 |
Notes
- Rates are crude rates based on the Australian estimated resident population (ERP) at 30 June of the reference year. Minor adjustments in rates may occur between publications reflecting revision of the estimated resident population by the Australian Bureau of Statistics.
- The denominator for the proportion achieving all case management goals is the number of client groups with a case management plan. Denominator values for proportions are provided in the relevant national supplementary table.
Source: Specialist Homelessness Services Collection 2012–13 to 2016–17.
Characteristics of clients with problematic drug and/or alcohol use 2016–17
In 2016–17, SHS agencies assisted 27,295 clients with problematic drug and/or alcohol use. Of these clients:
- Most were male: Over half of the clients presenting were male (54%). This is different to the overall SHS client profile, where most clients are female (Supplementary table SUB.1).
- Most males were 35–44: The highest rate of service use for males with problematic drug and/or alcohol use was in the 35–44 age range; for females it was the younger age range 25–34 years (Figure SUB.1).
- Most clients were aged 35–44: One quarter of clients (26%) presenting with problematic drug and/or alcohol use were aged 35–44.
- One in 5 were over 45: Clients aged 45 years and over made up 21% of the client group and were predominantly male (64%).
- They were more likely to be Indigenous: 29% of clients were Indigenous, compared with 25% in the overall SHS population.
- Most lived alone: Over half of these clients (55%) were living alone, followed by single parents with one or more children (13%).
- They were more likely to have received services in the past: returning clients made up 69% of this group. That is, these clients seeking assistance in 2016–17 had also received services at some time in the previous 5 years.
- The main reason these clients sought assistance was ‘housing crisis’ (28%), followed by ‘domestic and family violence’ (12%). Six per cent reported that problematic drug and/or substance use was the main reason for seeking homelessness assistance.
Almost 1 in 5 clients (18%, or over 4,800) were leaving, or had recently left, an alcohol and drug treatment rehabilitation facility when they first presented at a SHS agency.
Figure SUB.1: Clients with problematic drug and/or alcohol use, by age and sex, 2016–17
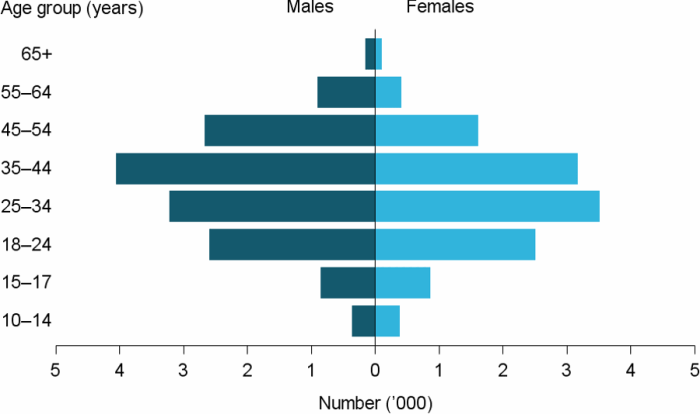
Source: Specialist homelessness services 2016–17, National supplementary table SUB.1.
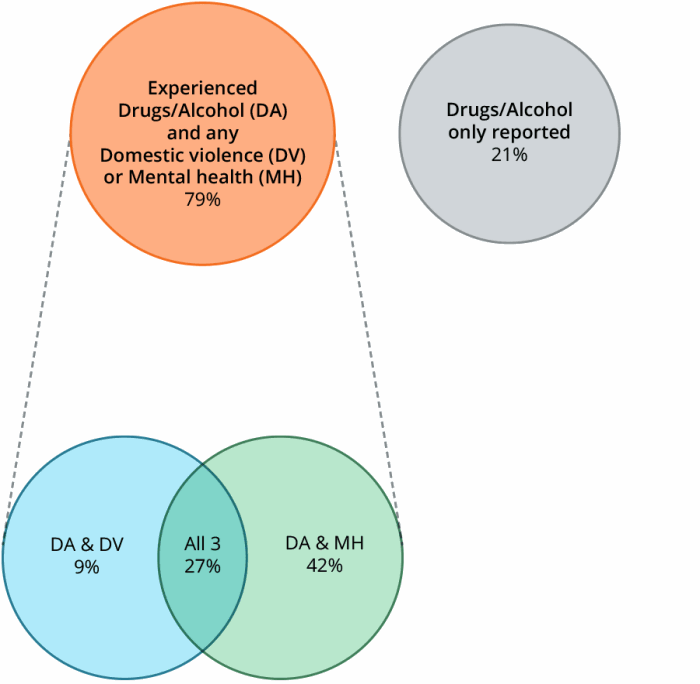
Many clients who reported problematic drug and/or alcohol use were also facing additional challenges. Nearly 4 in 5 clients (79%, or nearly 21,500) also reported additional vulnerabilities such as domestic and family violence and/or mental health issues (Figure SUB.2). The majority of clients with problematic drug and/or alcohol use also reported mental health issues in addition to problematic drug and/or alcohol use (69%).
Of clients with problematic drug and/or alcohol use:
- 42% also reported mental health issues; and
- 27% (or about 7,500 clients) reported all three vulnerabilities, problematic drug/alcohol use, mental health issues and domestic and family violence.
Figure SUB.2: Clients with problematic drug and/or alcohol use, by selected vulnerability characteristics, 2016–17
Notes
- Client vulnerability groups are mutually exclusive.
- Clients are aged 10 and over.
Source: Specialist Homelessness Services Collection 2016–17.
Source of referral
Around 1,500 clients (5%) were formally referred to a SHS agency by an alcohol and drug treatment service, five times higher than the overall SHS population (1%).
- The main source of formal referrals to a specialist homelessness service agency for clients with problematic drug and/or alcohol use was by another specialist homelessness agency or outreach worker (16%), followed by another government or non-government agency (10%).
- One-third of clients (33%) had no formal referral to a SHS agency.
Reasons for seeking assistance
The main reasons for clients presenting with problematic drug and/or alcohol use were:
- ‘housing crisis’ (28% compared with 24% of the overall SHS population);
- ‘domestic and family violence’ (12% compared with 28%); and
- ‘inadequate or inappropriate dwelling conditions’ (11% compared with 9%);
The proportion of clients who presented to an SHS agency with ‘problematic drug or substance use’ as a main reason for seeking assistance was 6%, while for ‘problematic alcohol use’ it was 3%. This is higher than for other client groups as well as the overall SHS population (1% and less than 1%, respectively).
Services needed and provided
Of those clients with problematic drug and/or alcohol use, 37% (around 10,100 clients) identified a need for drug or alcohol based services:
- Thirty-seven per cent identified a need for drug and alcohol counselling; 47% of these requests were met.
61% (around 16,600) of clients reporting problematic drug and/or alcohol use needed short-term or emergency accommodation
Compared with the general SHS population, clients with problematic drug and/or alcohol use were more likely to identify a need for:
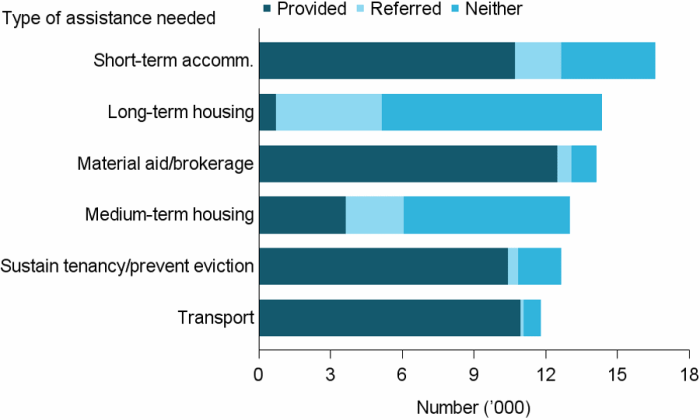
- Material aid/brokerage (52% compared with 35%) (Figure SUB.3).
- Meals (37% compared with 17%).
- Assertive outreach (32% compared with 18%).
Clients with problematic drug and/or alcohol use also identified needing:
- Living skills/personal development (41% or around 11,300 clients); with assistance able to be provided to 89% of these clients.
- Financial information (41% or nearly 11,200 clients); with assistance able to be provided to 84% of these clients.
- Assistance with challenging social/behavioural problems (35% or nearly 10,000 clients); with assistance able to be provided to 86% of these clients.
All of these services were needed at higher rates than the general SHS population (living skills/personal development 20%; financial information 25%; assistance with challenging social/behavioural problems 13%).
The services which were least likely to be provided to clients with problematic drug and/or alcohol use were:
- Long-term housing (52%, or around 14,300 needed assistance); with assistance provided to 5% of these clients (Figure SUB.3).
- Medium term/transitional housing (48%, or around 13,000 needed assistance); with assistance provided to 28% of these clients.
- Psychological services (12%, or around 3,000 needed assistance); with assistance provided to 35% of these clients.
Figure SUB.3: Clients with problematic drug and/or alcohol use, by top 6 services and service provision status, 2016–17
Notes
- Excludes ‘Other basic assistance’, ‘Advice/information’, and ‘Advocacy/liaison on behalf of client’.
- Short-term accommodation includes temporary and emergency accommodation; medium-term housing includes transitional housing; and sustain tenancy/prevent eviction includes assistance to sustain tenancy or prevent tenancy failure or eviction.
Source: Specialist homelessness services 2016–17, National supplementary table SUB.3.
Housing outcomes
For clients with problematic drug and/or alcohol use and whose support had ended:
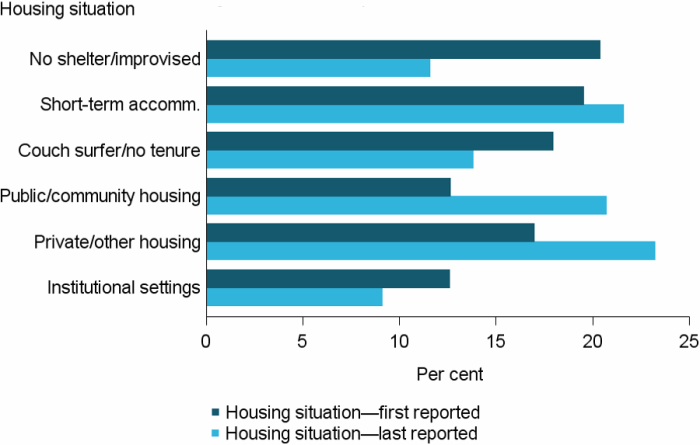
- Nearly 3 in 5 (58%) were homeless at the beginning of support, with 20% of clients ‘sleeping rough or in an improvised or inadequate dwelling’ or in ‘short-term or emergency accommodation’ (20%).
- Over 2 in 5 (42%) were ‘at risk of homelessness’ with the majority living in private or other housing (17%).
- The proportion of clients who were homeless at presentation to a SHS agency decreased from 58% to 47% by the end of support, with the majority of clients who were homeless being housed in ‘short term temporary accommodation’ (22%).
- Around 3,700 clients (23%) were in private rentals following support (increasing from 17% at the commencement of support).
- Around 3,300 clients (21%) were living in public/community housing following support (increasing from 13% at the commencement of support) – an 8 percentage point increase between the beginning and end of support (Figure SUB.4).
Figure SUB.4: Clients with problematic drug and/or alcohol use, by housing situation at beginning of support and end of support, 2016–17
Notes
- The SHSC classifies clients living with no shelter or improvised/inadequate dwelling, short-term temporary accommodation, or in a house, townhouse, or flat with relatives (rent free) as homeless. Clients living in public or community housing (renter or rent free), private or other housing (renter or rent free), or in institutional settings are classified as housed.
- No shelter/improvised includes inadequate dwellings; short-term accommodation includes temporary and emergency accommodation; couch surfer/no tenure includes living in a house, townhouse or flat with relatives rent free; public/community housing includes both renting or rent free; and private/other housing includes both renting or rent free.
- Proportions include only clients with closed support at the end of the reporting period.
Source: Specialist homelessness services 2016–17, National supplementary table SUB.4.
The transition to stable housing (public or community housing, private or other housing, or institutional settings) can be more difficult for some clients than others.
Of those clients with problematic drug and/or alcohol use who were homeless when they began support:
- Thirty-six per cent were assisted into stable housing at the end of support (Table SUB.2).
- Agencies were best able to assist those in short-term emergency accommodation into stable housing (42%, or nearly 1,200 clients). Those rough sleeping were the least likely to end support housed (30%).
Of those clients with problematic drug and/or alcohol use who were housed, but at risk of homelessness when they began support:
- Seventy-seven per cent were assisted into stable housing at the end of support (Table SUB.2):
- For those clients living in public or community housing 3 in 4 (77%, or 1,500 clients) were assisted to maintain their tenancy, with a further 6% moving into private/other housing.
- For clients living in private/other housing about 65% (or over 1,700 clients) were assisted to maintain their tenancy, with a further 9% moving into public or community housing.
Table SUB.2: Clients with problematic drug and/or alcohol use, housing situation at beginning and end of support, 2016–17 (per cent)
| Situation at beginning of support | Situation at end of support: homeless |
Situation at end of support: housed |
|---|---|---|
| Homeless | 64.2 | 35.8 |
| At risk of homelessness | 22.9 | 77.1 |
Notes
- The SHSC classifies clients living with no shelter or improvised/ inadequate dwelling, short-term temporary accommodation, or in a house, townhouse, or flat with relatives (rent free) as homeless. Clients living in public or community housing (renter or rent free), private or other housing (renter or rent free), or in institutional settings are classified as housed.
- Proportions include only clients with closed support at the end of the reporting period. Per cent calculations are based on total clients, excluding ‘Not stated/other’.
Source: Specialist homelessness services 2016–17, National supplementary table SUB.4.
References
- Johnson G & Chamberlain C 2008. Homelessness and substance abuse: Which comes first? Australian Social Work 61 (4): 342–356.
- Scutella R, Bevitt A, Chigavazira A, Herault N, Johnson G, Moschion J, Tseng Y, Wooden M & Kalb G 2014. Journeys Home Research Report No. 6: Complete findings from Waves 1 to 6. Melbourne Institute of Applied Economic and Social Research. A report prepared for the Australian Government Department of Social Services.
- AIHW (Australian Institute of Health and Welfare) 2014. Exploring drug treatment and homelessness in Australia: 1 July 2011 to 30 June 2014. Cat no. CSI 23. Canberra: AIHW.