Indigenous clients
Aboriginal and Torres Strait Islander people continue to be over-represented in both the national homeless population and as users of specialist homelessness services (see Clients, services and outcomes and [1]). Aboriginal and Torres Strait Islander people make up 3.3% of the Australian population [2], yet they made up 25% of the clients accessing specialist homelessness services in 2016–17: an estimated 64,644 clients. Indigenous status was not reported for 9% of SHS clients in 2016–17.
Key findings in 2016–17
- Indigenous client numbers increased by 5% since 2015–16 to around 64,600 in 2016–17, and grew at a faster rate than the general SHS population (3% increase).
- There were more returning Indigenous clients (58%) than new Indigenous clients in 2016–17, meaning over half the Indigenous clients in 2016–17 had received assistance at some time in the previous 5 years.
- The length of Indigenous client support continues to increase, up from 44 to 46 days in 2016–17, and remains notably longer than that of non-Indigenous clients (39 days in 2016–17).
- The proportion of Indigenous clients receiving accommodation services decreased to 42%, down from 44% in 2015–16; however, the median length of accommodation increased slightly (20 nights, up from 19 nights) but remains significantly shorter than non–Indigenous clients (41 nights).
- An estimated 3,000 (or 6%) more Indigenous clients ended support in public or community housing and fewer Indigenous clients were in short-term or emergency accommodation following assistance from SHS agencies in 2016–17.
Indigenous clients: 2012–13 to 2016–17
Over 186,000 Indigenous clients have been supported by homelessness agencies since the SHSC began in 2011–12. The number of Indigenous clients has been steadily increasing over this time. The key trends identified over the past 5 years have been:
- The rate of service use by Indigenous clients has increased from 654 clients per 10,000 Indigenous people in 2012–13 to 814 per 10,000 in 2016–17 (Table Indigenous Trends.1).
- The gap between Indigenous and non–Indigenous rates of service use continues to widen. In 2016–17 Indigenous people were 9.2 times more likely to use specialist homelessness services than non-Indigenous people, up from 8.2 times in 2012–13.
- After taking into account differences in population size, in 2016–17 Indigenous clients accessed services at the highest rate in Inner/outer regional areas, a change from previous years where the highest rate was in Major cities.
- The rate of service use by Indigenous clients living in Remote/ very remote areas has increased by the greatest margin over time; from 499 Indigenous clients per 10,000 population in 2012–13 to 721 in 2016–17. This is in contrast to non-Indigenous clients in the same areas where the rate decreased from 53 clients per 10,000 to 41 clients over the same time period.
- The proportion of Indigenous clients ending support in some form of social or private housing has improved. In 2016–17 around 39% of Indigenous clients assisted ended support in public or community housing compared with 35% in 2012–13.
Table Indigenous Trends.1: Indigenous clients: at a glance—2014–15 to 2016–17
| 2014–15 | 2015–16 | 2016–17 | ||||
|---|---|---|---|---|---|---|
| Indigenous | Non-Indigenous | Indigenous | Non-Indigenous | Indigenous | Non-Indigenous | |
| Number of clients | 53,301 | 173,955 | 61,700 | 190,488 | 64,644 | 196,689 |
| Proportion of all clients where Indigenous status reported | 23 | 77 | 24 | 76 | 25 | 75 |
| Rate (per 10,000 population) | 693.2 | 79.8 | 787.0 | 86.5 | 813.9 | 88.4 |
| Rate ratio | 8.7 | 9.1 | 9.2 | |||
| Rate difference | 613.4 | 700.5 | 725.6 | |||
| Remoteness rate (per 10,000 population) | ||||||
| Major cities | 710.9 | 75.2 | 823.9 | 80.6 | 832.4 | 80.7 |
| Inner/outer regional | 683.9 | 98.7 | 789.2 | 110.5 | 852.3 | 115.3 |
| Remote/very remote | 688.5 | 38.6 | 732.4 | 36.4 | 720.9 | 40.7 |
| Rate ratio | ||||||
| Major cities | 9.5 | 10.2 | 10.3 | |||
| Inner/outer regional | 6.9 | 7.1 | 7.4 | |||
| Remote/very remote | 17.9 | 20.1 | 17.7 | |||
| Housing situation at the beginning of first support period (proportion of all clients) | ||||||
| Homeless | 47 | 43 | 46 | 43 | 47 | 43 |
| At risk of homelessness | 53 | 57 | 54 | 57 | 53 | 57 |
| Length of support (median number of days) | 40 | 35 | 44 | 37 | 46 | 39 |
| Average number of support periods per client | 1.6 | 1.7 | 1.7 | 1.7 | 1.7 | 1.7 |
| Proportion receiving accommodation | 47 | 32 | 44 | 30 | 42 | 29 |
| Median number of nights accommodated | 20 | 42 | 19 | 42 | 20 | 41 |
| Proportion of a client group with a case management plan | 70 | 60 | 70 | 61 | 71 | 61 |
| Achievement of all case management goals (per cent) | 24 | 25 | 21 | 23 | 20 | 22 |
Notes
- Rates were directly age-standardised as detailed in the Technical information section. Minor adjustments in rates may occur between publications reflecting revision of the estimated resident population by the Australian Bureau of Statistics.
- Rate ratio is the Indigenous rate divided by the Non-Indigenous rate and is used to compare the 2 service use rates. Rate difference reveals the gap between the 2 rates.
- The denominator for the proportion achieving all case management goals is the number of client groups with a case management plan. Denominator values for proportions are provided in the relevant National supplementary table.
- Previous years’ data can be found in the 2014–15 and 2015–16 Specialist Homelessness Services Annual reports.
Source: Specialist Homelessness Services Collection 2014–15 to 2016–17
Characteristics of Indigenous clients 2016–17
Of the 64,644 Indigenous clients who received services in 2016–17:
- Around 1 in 4 (23%, or 14,500) were children aged under 10, compared with 14% (or nearly 28,000) of non-Indigenous children under 10.
- Just over half (53%) were aged under 25, compared with 40% of non-Indigenous clients.
- There were twice as many Indigenous female clients aged over 18 (42%, or over 27,000) than male Indigenous clients (21%). By comparison, 46% of non-Indigenous clients aged over 18 were female and 29% were male.
- Just over 1 in 4 (26%) sought assistance because of a housing crisis and a further 1 in 4 (23%) because of domestic and family violence. Non-Indigenous clients also reported these two main reasons most commonly (domestic and family violence 26%; housing crisis 23%).
- Over one-third (35%) were living as single parents with a child or children when they approached an agency for support, similar to non-Indigenous clients (34%).
The different age structure of Indigenous and non-Indigenous clients is illustrated in Figure INDIGENOUS.1.
Figure INDIGENOUS.1: Clients by Indigenous status, by age and sex, 2016–17
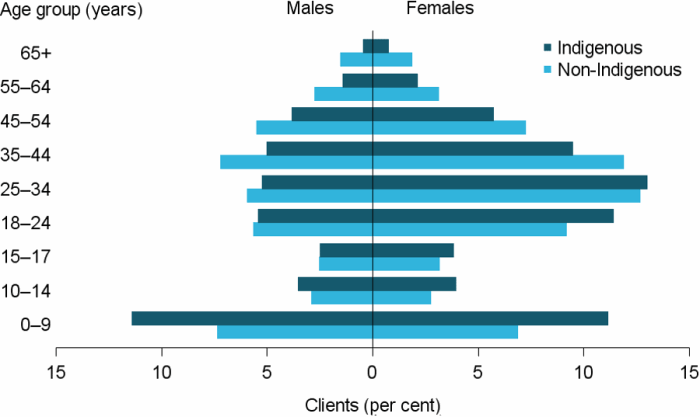
Source: Specialist homelessness services 2016–17, National supplementary table INDIGENOUS.1.
Clients may also be facing additional challenges when they present to an agency for assistance. Figure INDIGENOUS.2 outlines the multiple vulnerabilities reported by Indigenous and non–Indigenous clients (aged 10 and over) of homelessness services. Specifically, domestic and family violence, mental health issues and problematic drug and/or alcohol use identified within these populations. Over half (54%) of Indigenous clients reported one or more of these vulnerabilities, fewer than non–Indigenous clients (61%). One in 3 (35%) Indigenous clients reported domestic and family violence and of these clients the greatest overlap in vulnerabilities was with mental health:
- Eight per cent reported both domestic and family violence and mental health issues, while a further 1 in 20 (4%) reported all three vulnerabilities (domestic and family violence, mental health issues and problematic drug and/or alcohol use), similar to non–Indigenous clients (3%).
Figure INDIGENOUS.2: Clients, by Indigenous status, and by selected vulnerability characteristics, 2016-17
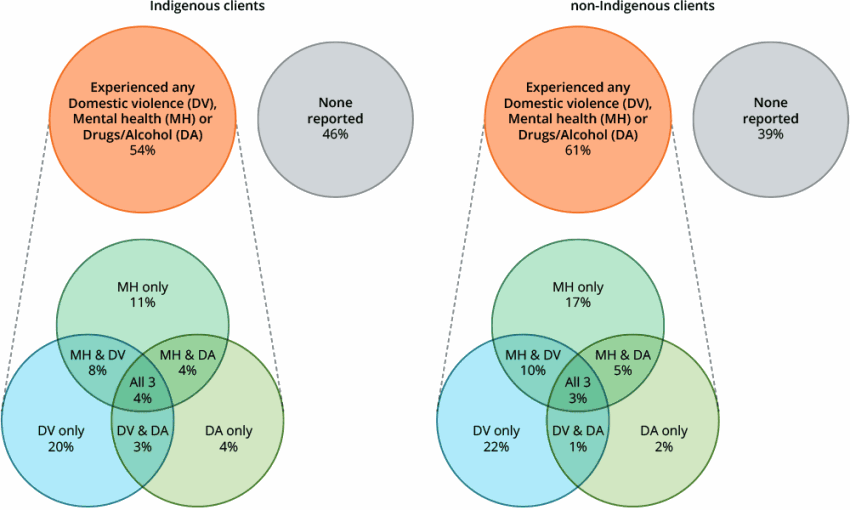
Notes
- Client vulnerability groups are mutually exclusive.
- Clients are aged 10 and over.
Source: Specialist Homelessness Services Collection 2016–17.
Services needed and provided
The need for accommodation assistance was broadly similar between Indigenous and non-Indigenous clients, with the exception of short-term or emergency accommodation (Figure INDIGENOUS.3).
- Half of the Indigenous clients (51%, or 33,000) needed short-term or emergency accommodation compared with 36% for non-Indigenous clients.
- For general services, needs were higher for Indigenous clients when compared with non-Indigenous clients. For example, general services including: meals (28% compared with 15%), laundry/shower facilities (25% compared with 12%) and transport (33% compared with 19%) were all notably higher for Indigenous clients.
Figure INDIGENOUS.3: Clients, by Indigenous status and by most needed services, 2016–17
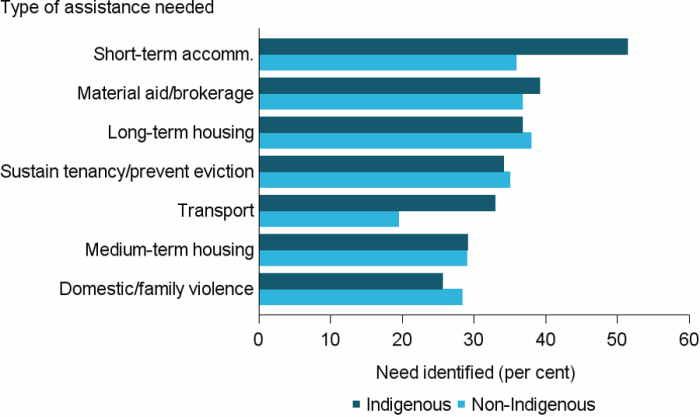
Notes
- Most needed excludes ‘Other basic assistance’, ‘Advice/information’ and ‘Advocacy/liaison on behalf of client’.
- Short-term accommodation includes emergency accommodation; and sustain tenancy/prevent eviction includes assistance to sustain tenancy or prevent tenancy failure or eviction; medium-term housing includes transitional housing.
Source: Specialist homelessness services 2016–17, National supplementary table INDIGENOUS.3.
Housing outcomes
For Indigenous clients whose support ended in 2016–17:
- The majority (54%) first presented at risk of homelessness, with the most common housing situation being public or community housing (30%), compared with 56% of non-Indigenous clients presenting at risk, with the most common housed in private or other housing (43%).
- The most common housing outcome following support was being housed in public or community housing (39%, or over 16,000) followed by private rental (26%, or nearly 11,000) (Figure INDIGENOUS.4). For non-Indigenous clients, the most common housing outcomes at the end of support were private rental (49%) followed by public or community housing (16%).
Figure INDIGENOUS.4: Clients, by Indigenous status and by housing situation at the beginning and end of support, 2016–17
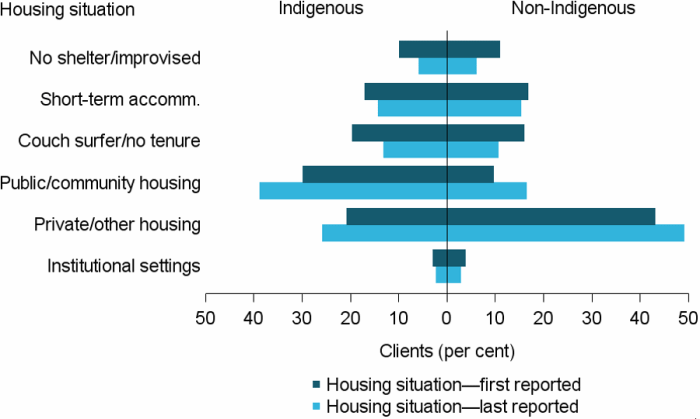
Notes
- The SHSC classifies clients living with no shelter or improvised/inadequate dwelling, short-term temporary accommodation, or in a house, townhouse, or flat with relatives (rent free) as homeless. Clients living in public or community housing (renter or rent free), private or other housing (renter or rent free), or in institutional settings are classified as housed.
- No shelter/improvised includes inadequate dwellings; short-term accommodation includes temporary accommodation; couch surfer/no tenure includes living in a house, townhouse or flat with relatives rent free; public/community housing includes both renting or rent free; and private/other housing includes both renting or rent free.
- Proportions include only clients with closed support at the end of the reporting period.
Source: Specialist homelessness services 2016–17, National supplementary table INDIGENOUS.4.
Differences in housing outcomes are largely dependent on whether a client is homeless or housed when they seek assistance. There was little difference in these outcomes for Indigenous and non–Indigenous clients (Table Indigenous.2). Stable housing is defined in the Glossary.
For Indigenous clients who were homeless when support commenced, following support:
- Four in 10 (40%) were assisted into stable housing (by comparison, 39% non–Indigenous).
- Almost half in short-term emergency accommodation were assisted into stable housing (47%, or over 3,000) (by comparison, 44% non–Indigenous).
For Indigenous clients who were housed but considered at risk of homelessness when support commenced, following support:
- Nine in 10 (90%) were assisted to maintain their tenancy (which is the same as non–Indigenous clients).
- Almost 9 in 10 of those living in public or community housing (87%) were assisted to maintain their tenancy, and a further 5% were assisted into private/other housing. By comparison, 83% of non–Indigenous clients living in public or community housing were assisted to maintain their tenancy, and a further 9% were assisted into private/other housing.
- Just over 3 in 4 (76%) of those living in private or other housing were assisted to maintain their tenancy, and a further 11% were assisted into public or community housing. By comparison, 85% of non-Indigenous clients living in private or other housing were assisted to maintain their tenancy, and only a further 5% were assisted into public or community housing.
Table Indigenous.2: Indigenous clients, housing situation at beginning and end of support, 2016–17 (per cent)
| Situation at end of support: homeless |
Situation at end of support: housed |
|||
|---|---|---|---|---|
| Situation at beginning of support | Indigenous | Non–Indigenous | Indigenous | Non–Indigenous |
| Homeless | 60.0 | 61.1 | 40.0 | 38.9 |
| At risk of homelessness | 10.2 | 9.7 | 89.8 | 90.3 |
Notes
- The SHSC classifies clients living with no shelter or improvised/inadequate dwelling, short-term temporary accommodation, or in a house, townhouse, or flat with relatives (rent free) as homeless. Clients living in public or community housing (renter or rent free), private or other housing (renter or rent free), or in institutional settings are classified as housed.
- Proportions include only clients with closed support at the end of the reporting period. Per cent calculations are based on total clients, excluding ‘Not stated/other’.
Source: Specialist homelessness services 2016–17, National supplementary table INDIGENOUS.4.
References
- Australian Bureau of Statistics (ABS), 2012. Census of population and housing: estimating homelessness, 2011. ABS cat no. 2049.0. Canberra: ABS.
- Australian Bureau of Statistics (ABS), 2017. Australian demographic statistics, Mar 2017. ABS cat no. 3101.0. Canberra: ABS.