Clients with disability
The 2015 Survey of Disability, Ageing and Carers (SDAC) estimates that almost 1 in 5 Australians (18.3% of the total population) have a disability. This estimate includes all those with any disability including mild and severe disabilities [1]. The Specialist Homelessness Services Collection (SHSC) identifies people with core activity limitations and their level of need for assistance in different life areas, including those that may impact on housing and employment, and differentiates them from people without such limitations. The analysis of the availability and appropriateness of homelessness services for this group of clients contributes to information about people with disability across a range of government services.
In 2016–17, 28,804 clients reported one or more limitations with a core activity (self-care, mobility, and/or communication). Of these, 10,998 clients reported that they always or sometimes needed assistance. It is this subgroup of people living with disability with severe or profound core activity limitation who are described in this section. In this report, ‘severe or profound core activity limitation’ is sometimes abbreviated to ‘severe or profound disability’.
Key findings in 2016–17
- 10,998 clients assisted by homelessness agencies reported a severe or profound activity limitation, a 12% increase since 2015–16.
- Most clients with a severe or profound disability were at risk of homelessness when they sought assistance (56%).
- The age group with the highest proportion of adult clients with a severe or profound disability was 45–54. This age group had similar proportions of male and female clients (48% male and 52% female), unlike the general SHS population of the same age group (41% and 59%, respectively).
- Housing outcomes improved following support, with fewer clients homeless (32%, down from 44% at the start of support).
- Most clients with severe or profound disability ended support housed in private or other housing (2,500, or 37%, up 4 percentage points from the beginning of support). Public and community housing saw the greatest increase in client numbers to 26%, up from 17% at the start of support.
- Clients with severe or profound disability received an average of 2.3 support periods, this is higher than the general SHS population (1.7).
- Over half of this client group (54%) in 2016–17 had received homelessness services at some time in the previous 5 years.
The reporting of disability in the SHSC
The SHSC disability questions are asked of all clients and are based on core activity limitations and whether the client has any need for assistance with these activities. In this report, people who identified that they have a limitation in core activities (self-care, mobility and/or communication) and who also reported that they always or sometimes needed assistance with one or more of these core activities are described. The term ‘severe or profound core activity limitation’ is used to refer to this subgroup of people living with disability, sometimes also referred to as ‘severe or profound disability’. Details about measuring disability in the SHSC and the definition of a client with severe or profound core activity limitation are provided in the Technical information section.
Clients with severe or profound disability: 2013–14 to 2016–17
This is the fourth year for which information on clients with disability has been collected. In 2016–17, of the 28,804 clients who had a core activity limitation, 10,988 clients (or 4% of all SHS clients) answered that they ‘always/sometimes need help and/or supervision’ with self-care, mobility or communication (Supplementary table DIS.1). It is these clients with severe or profound disability who are described in this section.
Since reporting began on disability in the SHSC in 2013–14, the number of clients with a severe or profound disability has increased. The key trends identified over the past 4 years have been:
- The number of clients with a severe or profound disability has increased by 57% across the 4 years (Table Disability Trends.1).
- Older clients within the client group are increasing: clients with a severe or profound disability aged 45–54 are the fastest growing adult age group, up 56% over the 4 years to 2016–17.
- Clients with a severe or profound disability need more services: The average number of services needed by these clients has consistently been higher than the general SHS population (around 10 per client with severe or profound disability compared with about 7 per SHS client).
- The median number of nights of accommodation has decreased from 58 nights in 2013–14 to 50 nights in 2016–17.
Table Disability Trends.1: Clients with severe or profound core activity limitation: at a glance—2013–14 to 2016–17
| 2013–14 | 2014–15 | 2015–16 | 2016–17 | |
|---|---|---|---|---|
| Number of clients | 6,979 | 8,789 | 9,812 | 10,988 |
| Proportion of all clients | 3 | 3 | 4 | 4 |
| Rate (per 10,000 population) | 3.0 | 3.7 | 4.1 | 4.5 |
| Housing situation at the beginning of first support period (proportion of all clients) | ||||
| Homeless | 43 | 43 | 44 | 44 |
| At risk of homelessness | 57 | 57 | 56 | 56 |
| Length of support (median number of days) | 68 | 59 | 64 | 65 |
| Average number of support periods per client | 2.3 | 2.2 | 2.3 | 2.3 |
| Proportion receiving accommodation | 42 | 40 | 39 | 39 |
| Median number of nights accommodated | 58 | 55 | 55 | 50 |
| Proportion of a client group with a case management plan | 73 | 68 | 70 | 70 |
| Achievement of all case management goals (per cent) | 18 | 19 | 18 | 18 |
Notes
- Rates are crude rates based on the Australian estimated resident population (ERP) at 30 June of the reference year. Minor adjustments in rates may occur between publications reflecting revision of the estimated resident population by the Australian Bureau of Statistics.
- The denominator for the proportion achieving all case management goals is the number of client groups with a case management plan. Denominator values for proportions are provided in the relevant national supplementary table.
- Indicates where previously published data have been revised to ensure consistent reporting.
Source: Specialist Homelessness Services Collection 2013–14 to 2016–17
Characteristics of clients with severe or profound core activity limitation 2016–17
Support received by clients with severe or profound disability was longer than the general SHS population, reflecting the more complex needs these clients present with. In 2016–17 clients with severe or profound disability:
- Were supported for 65 days (median), significantly longer than the general SHS population (median 37 days) (Table Disability Trends.1 and Table Client Trends.1).
- Were more likely to receive accommodation (57%) than the general SHS population (53%), and for those who did, the length of supported accommodation was much longer (median 50 nights compared with 33 nights for the general SHS population).
- Had an average of 2.3 support periods per client. This was higher than the general SHS population (1.7 support periods per client).
- Nationally, 54% of these clients were ‘returning’ clients in 2016–17, having received assistance at some time in the previous 5 years. This trend was observed in the majority of states and territories, ranging from as high as 66% in Western Australia to as low as 46% in New South Wales.
Client demographics
Of the 10,988 clients reporting a severe or profound core activity limitation in 2016–17:
- Just over 2 in 5 clients (44%) were homeless on presentation: this is similar to the general SHS population (44%).
- Around 1 in 3 (35%) were living alone when they approached homelessness services, higher than the general SHS population (29%).
- Nearly one-quarter of clients with severe or profound disability were Indigenous (23%), compared with 25% of all SHS clients.
- Two in 3 clients with severe or profound disability (66%) accessed services in Major cities and 1 in 5 (22%) in Inner regional areas. This is about the same distribution as the general SHS population (62% and 23%, respectively).
- Around 1 in 5 (23%) reported experiencing a housing crisis. This was the most common main reason clients with severe or profound disability sought homelessness services.
- Twice as many people aged over 55 with severe or profound disability sought assistance from SHS agencies, compared with the general SHS population (16% compared with 8%, respectively). And, unlike the general SHS population, there were similar proportions of male and female clients with severe or profound disability.
The age and sex distribution of clients with severe or profound core activity limitation compared with clients without is shown in Figure DIS.1.
Figure DIS.1: Clients, by severe or profound core activity limitation status, by age and sex, 2016–17
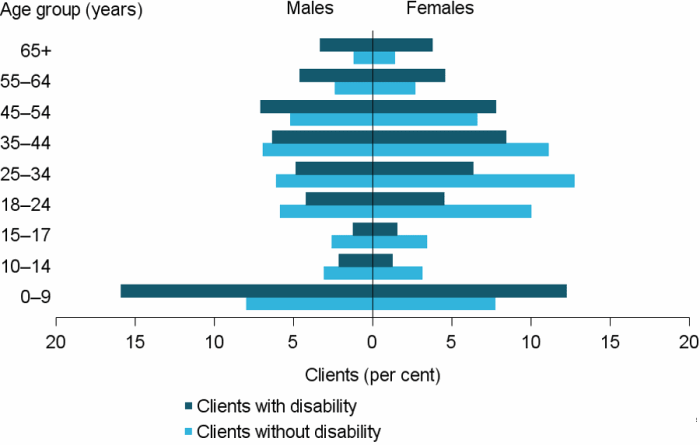
Notes
- For further information on the quality of Disability data, specifically for children aged 0–9, see the Data Quality Statement.
- Clients with disability refers to clients with a severe or profound core activity limitation.
Source: Specialist homelessness services 2016–17, National supplementary table DIS.3
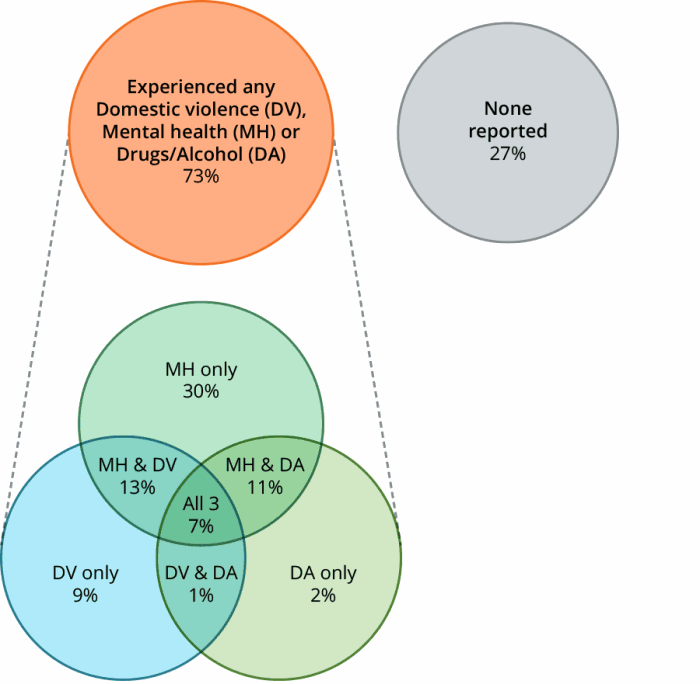
Living with disability may not be the only challenge faced by this group of clients. Almost 3 in 4 (73%, or nearly 5,700) clients with severe or profound disability aged 10 and over also presented with additional vulnerabilities (domestic and family violence, mental health issues or problematic drug and/or alcohol use) (Figure DIS.2). In addition to living with severe or profound disability, the majority (61%) reported experiencing mental health issues. Of these, about half had also experienced an additional vulnerability:
- At least 1 in 10 clients with severe or profound disability and reported mental health issues, also reported either domestic and family violence (13%) or problematic drug and/or alcohol use (11%).
- A further 7% of clients with severe or profound disability experienced all three vulnerabilities (mental health issues, domestic and family violence and problematic drug and/or alcohol use).
Figure DIS.2: Clients with severe or profound core activity limitation, by selected vulnerability characteristics, 2016–17
Notes
- For further information on the quality of Disability data, specifically for children aged 0–9, see the Data Quality Statement.
- Client vulnerability groups are mutually exclusive.
- Clients are aged 10 and over.
Source: Specialist Homelessness Services Collection 2016–17.
States and territories
Over one-third of clients with severe or profound disability accessed services in Victoria (36%, or 3,900 clients). This was followed by New South Wales (29%) and Queensland (12%) (Figure DIS.3).
- Compared with 2015–16, New South Wales and South Australia had the largest increase in clients with severe or profound disability (26% and 25%, respectively). This is consistent with the reported increases in overall client numbers in 2016–17 in New South Wales, but goes against the overall decrease in client numbers in South Australia in 2016–17.
- The Northern Territory (12.4 per 10,000 people) and Tasmania (9.7) had the highest rates of clients with severe or profound disability while Queensland (2.7) and South Australia (3.9) had the lowest rates.
Figure DIS.3: Clients with severe or profound core activity limitation, by state and territory, 2016–17
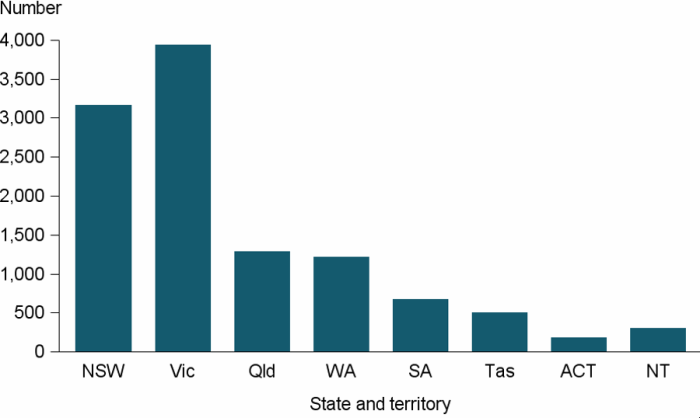
Source: Specialist homelessness services 2016–17, National supplementary table DIS.4
Main source of income
Of clients aged 15 and over with severe or profound disability (over 7,500), 88% reported that their main source of income was a government payment, in particular:
- Disability Support Pension (44%) (compared with 16% of all SHS clients)
- New Start Allowance (21%) (compared with 29% of all SHS clients)
- Age Pension (7%) (compared with 3% of all SHS clients) and
- Department of Veteran Affairs Disability Pension (3%) (compared with 1% of all SHS clients).
Clients who require assistance for severe or profound disability were less likely to report their main source of income as the parenting payment (6% compared with 18% of all SHS clients).
A larger proportion of male clients with severe or profound disability (47%) reported that their main source of income was from the Disability Support Pension, compared with females (41%).
Employment and education status
Of clients aged 15 and over with severe or profound disability (over 7,500):
- Over half were not in the workforce (56%). A further 40% were unemployed.
- Only 4% of these clients were employed. By comparison, 11% of the SHS client population were employed.
- The proportion aged 15–24 who were not enrolled in education was higher than the general SHS client group (70% and 64%, respectively).
Of those aged 5–14 with severe or profound disability whose educational enrolment status was reported, (over 1,100):
- Twenty-three per cent were not enrolled in education compared with 15% of the general SHS population.
Source of referral
Similar to other SHS clients, most clients with severe or profound disability seek support without a formal referral (32%). However, where a referral was made, it was most commonly made by:
- a specialist homelessness agency/outreach worker (16%)
- another (government/non-government) agency (11%) or,
- family and/or friends (8%).
Over two-thirds (68%) of clients with severe or profound disability were formally referred to the SHS agency
Reasons for seeking assistance
The most common main reason this group of clients reported for seeking assistance was due to a housing crisis (23%), similar to the SHS population (24%). However, 19% reported the main reason they had sought assistance was for domestic and family violence reasons, which is much lower than the general SHS population (28%).
Services needed and provided
Overall, clients with severe or profound core activity limitation needed more services than the general SHSC client population. In 2016–17:
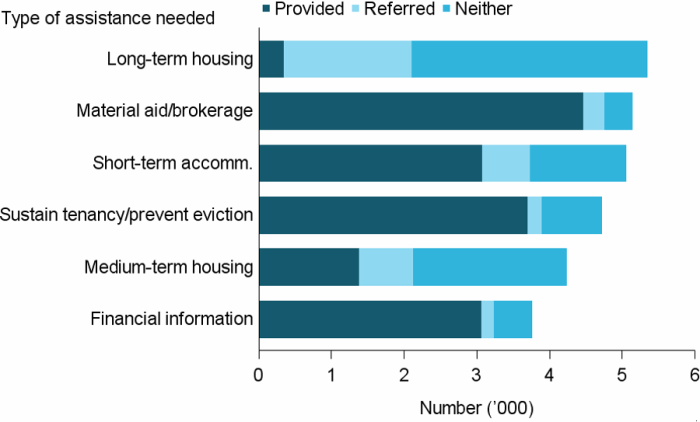
- Almost half of this client group needed long-term housing (49%); material aid/brokerage (47%); and short-term or emergency accommodation (46%) (Figure DIS.4).
- Less than 1 in 10 clients with severe or profound disability received the long-term housing needed. While most of the identified needs were provided: 87% for material aid/brokerage; and 61% for short-term or emergency accommodation, just 7% of requests for long-term housing were able to be met by the agency.
- Over 1 in 5 (22%, or around 2,400) clients with severe or profound disability were identified as in need of health/medical services and 17% were identified as in need of mental health services. Over half of these identified needs were provided for health/medical services (55%), while 48% of mental health related services were provided (Supplementary Table DIS.3).
- Just 4% (or about 400) of clients with severe or profound disability needed support and assistance specifically for their physical disability and similarly, 4% needed services specifically for their intellectual disability. Less than half (40%) of the identified need for disability services was met.
- Clients with severe or profound disability, were more likely to need family relationship assistance (24%, or over 2,600), assistance with challenging social/behavioural problems (21%) and assistance for trauma (17%) than the broader SHS population (18%, 13%, 12%, respectively).
Figure DIS.4: Clients with severe or profound core activity limitation, by most needed services and service provision status, 2016–17
Notes
- Excludes ‘Other basic assistance’, ‘Advice/information’, and ‘Advocacy/liaison on behalf of client’.
- Short-term accommodation includes emergency accommodation; sustain tenancy/prevent eviction includes assistance to sustain tenancy or prevent tenancy failure or eviction; and medium-term housing includes transitional housing.
- ‘Neither’ indicates a service was neither provided nor referred.
Source: Specialist homelessness services 2016–17, National supplementary table DIS.5.
Previous experience of homelessness
Around 2 in 5 (41%) clients with severe or profound disability indicated they had experienced homelessness in the month before their support commenced. This is similar to the general SHS population (40%).
Housing situation at the start of support
- Over two-fifths (44%) of all clients with severe or profound disability were homeless when their support commenced, similar to the general SHS population (45%) (Figure DIS.5).
- 1 in 3 (33%) clients with severe or profound disability were living in private housing at the start of their support, followed by short-term accommodation (20%).
Figure DIS.5: Clients with severe or profound core activity limitation, by housing situation at beginning of support, 2016–17
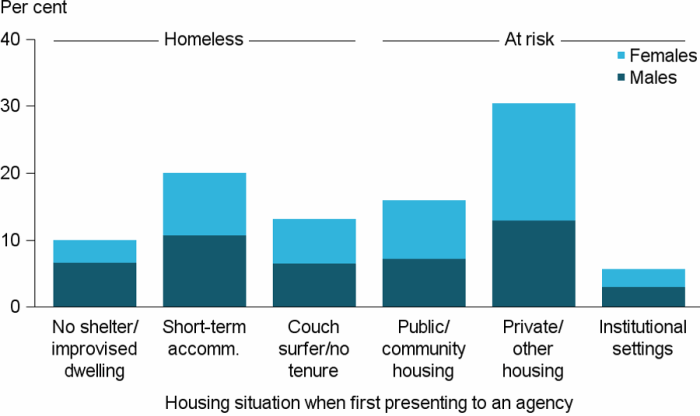
Note: Per cent calculations based on Total clients, excluding ‘Not stated’.
Source: Specialist homelessness services 2016–17, National supplementary table DIS.6.
Housing and other outcomes
Of those clients with severe or profound disability whose support had ended during 2016–17 (about 7,000 clients):
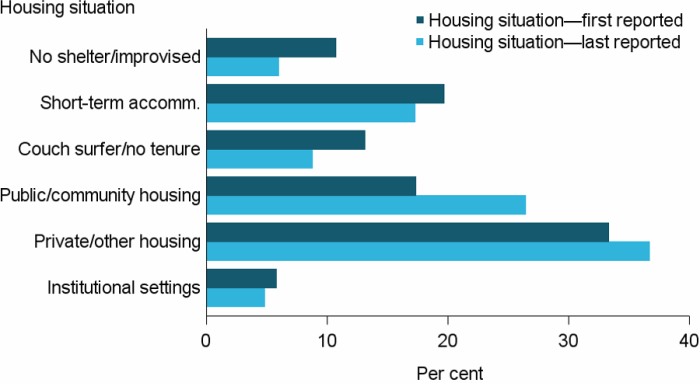
- Around 3,000 clients (44%) were homeless at the start of support and this decreased to 32% by the end of support (Figure DIS.6; supplementary table DIS.7).
- Almost 2 in 3 ended their support living in private housing (37% or 2,500 clients) or public or community housing (26% or 1,800 clients).
Figure DIS.6 Clients with severe or profound core activity limitation, by housing situation at beginning and end of support, 2016–17
Notes
- Per cent calculations based on Total clients, excluding ‘Not stated’.
- No shelter/improvised includes inadequate dwellings; short-term accommodation includes temporary and emergency accommodation; couch surfer/no tenure includes living in a house, townhouse or flat with relatives rent free; public/community housing includes both renting or rent free; and private/other housing includes both renting or rent free.
Source: Specialist homelessness services 2016–17, National supplementary table DIS.7.
For some, stable housing is more difficult to achieve than for others. The majority of clients with severe or profound disability began support housed, but at risk of homelessness (56%) (Table DIS.2). Of these clients who had ended support:
- Agencies were able to successfully maintain tenancies for around 9 in 10 clients (89%).
- For example, 82% living in public or community housing remained in this housing, while a further 7% moved into private/other housing.
- 79% living in private or other housing remained in this housing, while a further 10% were assisted into public or community housing.
For those clients with severe or profound disability who began support homeless, acheiving stable housing (see Glossary ) was more difficult:
- Agencies assisted 4 in 10 (41%) of these clients into stable housing.
- Agencies were best able to assist those clients with severe or profound disability living in either short-term or emergency housing, or couch surfing into stable housing (both 44%).
Table DIS.2: Clients with severe or profound core activity limitation, housing situation at beginning and end of support, 2016–17 (per cent)
| Situation at beginning of support | Situation at end of support: homeless | Situation at end of support: housed |
|---|---|---|
| Homeless | 58.7 | 41.3 |
| At risk of homelessness | 11.2 | 88.8 |
Notes
- The SHSC classifies clients living with no shelter or improvised/inadequate dwelling, short-term temporary accommodation, or in a house, townhouse, or flat with relatives (rent free) as homeless. Clients living in public or community housing (renter or rent free), private or other housing (renter or rent free), or in institutional settings are classified as housed.
- Proportions include only clients with closed support at the end of the reporting period. Per cent calculations are based on total clients, excluding ‘Not stated/other’.
Source: Specialist homelessness services 2016–17, National supplementary table DIS.4.
- Education and employment status remained nearly unchanged following support. For example, the proportion of pre-support clients unemployed (40%) or not in the labour force (56%) was nearly the same as post-support clients (39% and 57%, respectively).
- Agencies were successful in advocating on behalf of clients with severe or profound disability. Of those who needed assistance to obtain a government payment or allowance (16%, or around 1,800 clients), there was a reduction in the proportion with no income following support (16% to 8%) and a reduction in those awaiting a government benefit (5% to 2%).
Reference
- Australian Bureau of Statistics 2016. Disability, ageing and carers, Australia. First Results, 2015. ABS cat no. 4430.0. Canberra: ABS.