Older clients
During 2016–17 people aged 55 or older comprised 8% of all clients (23,567 people) of specialist homelessness services (SHS). Specialist homelessness service use by this group is increasing, with numbers up 37% since 2012–13 (around 17,000 clients to 23,600 clients). This rapid growth is at double the average annual growth of the general SHS population since 2012–13 (8% compared with 4%).
Key findings in 2016–17
- While relatively small, this group is growing rapidly: There were about 23,600 people aged 55 years or older seeking homelessness services in 2016–17; an increase of 9% from the previous year, and three times the growth rate of the general SHS population (3%).
- Almost 2 in 3 older clients presented housed, but at risk of homelessness (65%).
- Housing outcomes improved: Fewer older clients were homeless following support (down from 35% to 26%) with the largest decrease in the number of ‘rough sleepers’, down 5 percentage points to 7% at the end of support.
- Most older clients at risk of homelessness were successfully assisted to maintain a housing tenancy (95%).
Older clients: 2012–13 to 2016–17
Since 2012–13, the number of older clients seeking assistance from specialist homelessness services has increased at a greater rate than other age groups. Key trends identified in this client population over the past 5 years are:
- Service use rates are climbing: The rate of service use by older clients has increased from 8 older clients per 10,000 population in 2012–13 to 10 per 10,000 (Table Older Trends.1).
- The average annual growth rate of this group is high: This group represents one of the fastest growing populations seeking assistance from specialist homelessness agencies. While the proportion of older clients is small (8% in 2016–17) this client group has experienced an average annual growth rate of 8.2% each year since 2012–13.
- Older Indigenous clients are increasing the fastest: Since 2012–13 the number of Indigenous older clients has grown at an average annual rate of 15.4% each year, with the number of Indigenous older clients reaching over 3,000 in 2016–17. In comparison, non-Indigenous older client rates have grown on average 9.7% each year. Service use by male Indigenous older clients has grown at a higher rate (16.3% average annual rate) than female Indigenous older clients (14.8% each year).
- The days of support they receive is increasing: The median number of days older clients are receiving support has increased from 18 days in 2012–13 to 27 days in 2016–17, suggesting that services are having difficulty accessing appropriate housing options for older clients.
Table Older Trends.1: Older clients (55 years and older): at a glance—2012–13 to 2016–17
| 2012–13 | 2013–14 | 2014–15 | 2015–16 | 2016–17 | |
|---|---|---|---|---|---|
| Number of clients | 17,193 | 18,182 | 18,741 | 21,610 | 23,567 |
| Proportion of all clients | 7 | 7 | 7 | 8 | 8 |
| Rate (per 10,000 population) | 7.6 | 7.9 | 8.0 | 9.1 | 9.7 |
| Housing situation at the beginning of first support period (proportion of all clients) | |||||
| Homeless | 33 | 33 | 33 | 34 | 35 |
| At risk of homelessness | 67 | 67 | 67 | 66 | 65 |
| Length of support (median number of days) | 18 | 21 | 24 | 25 | 27 |
| Average number of support periods per client | 1.5 | 1.5 | 1.5 | 1.5 | 1.5 |
| Proportion receiving accommodation | 22 | 21 | 19 | 18 | 17 |
| Median number of nights accommodated | 34 | 33 | 31 | 31 | 30 |
| Proportion of a client group with a case management plan | 42 | 45 | 48 | 50 | 51 |
| Achievement of all case management goals (per cent) | 30 | 30 | 31 | 27 | 26 |
Notes
- Rates are crude rates based on the Australian estimated resident population (ERP) at 30 June of the reference year. Minor adjustments in rates may occur between publications reflecting revision of the estimated resident population by the Australian Bureau of Statistics.
- The denominator for the proportion achieving all case management goals is the number of client groups with a case management plan. Denominator values for proportions are provided in the relevant national supplementary table.
Source: Specialist Homelessness Services Collection 2012–13 to 2016–17.
Characteristics of older clients 2016–17
Of the 23,567 older clients who received SHS support during 2016–17:
- Almost half were men. Older clients were more likely than the general SHS population to be male (44% compared with 40% of all clients). This is similar to the proportion of male older clients in 2015–16 (45%).
- Almost 2 in 3 (65%) were aged 55–64 and the remaining one-third were 65 or over.
- About 3 in 5 were living alone. Older clients were more likely to be living alone (59%) than the overall SHS population (29%).
- Just 5% of Indigenous clients were aged 55 years or older compared with 9% of non-Indigenous clients.
- Most were housed on presentation. Older clients were less likely to be homeless on presentation than the general SHS population. For example, 35% of clients aged 55 years and over were homeless on presentation compared with 44% of the overall SHS population.
- There were 3 main reasons most commonly reported for seeking assistance: housing crisis (22%), domestic and family violence (19%) and financial difficulties (17%).
- Most had not received SHS support in the past. Just over half (54%) of older clients sought assistance for the first time in 2016–17; the remaining 46% had received assistance as some time in the previous 5 years.
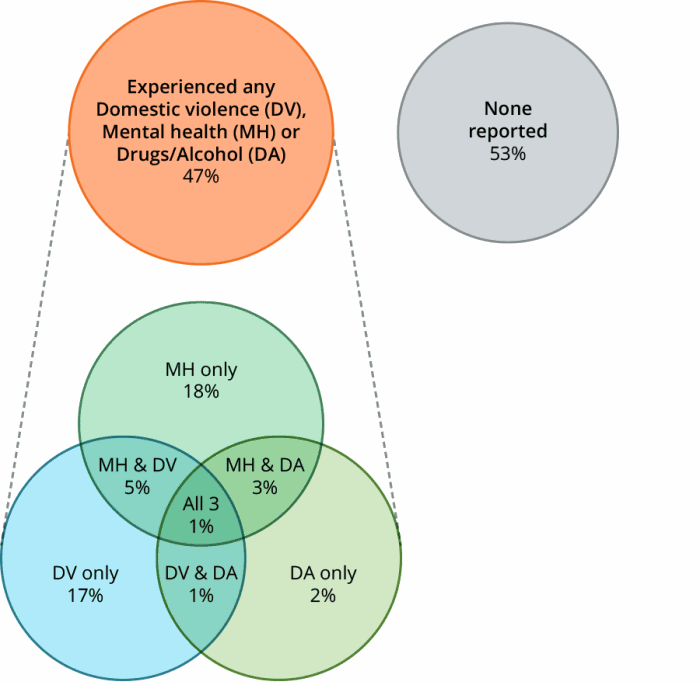
Nearly half (47%, or around 11,000) of older clients reported at least one vulnerability; most commonly mental health issues (27%) (Figure Older.1).
- Nearly 1 in 5 reported either only mental health issues or only domestic and family violence (18% and 17%, respectively); a further 5% reported both these issues.
- Two per cent reported only problematic alcohol and/or drug use, while a further 3% with mental health issues.
- Very few older clients reported all three vulnerabilities (1%) (mental health, domestic and family violence, and problematic drug and/or alcohol use).
Figure OLDER.1: Older clients, by selected vulnerability characteristics, 2016-17
Notes
- Client vulnerability groups are mutually exclusive.
- Clients are aged 55 or over.
Source: Specialist Homelessness Services Collection 2016–17.
Services needed and provided
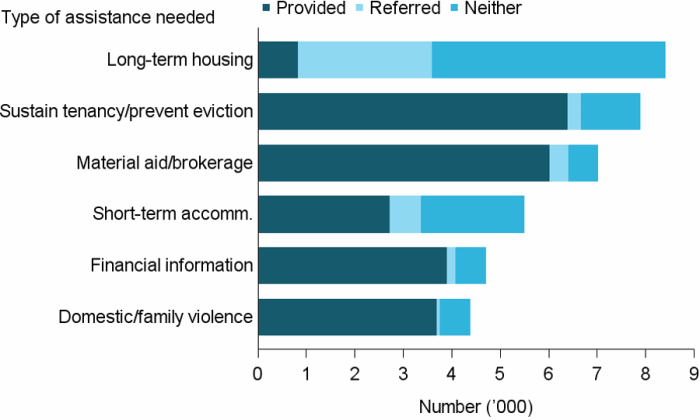
Older clients were less likely to request accommodation services (46%) than the general SHS population (56%). However, of those who did request accommodation, most needed long-term housing (36%); they were twice as likely as the general SHS population to be provided with this form of accommodation (10% of those older people who requested it compared with 5% of the general SHS population).
Other services most commonly needed by older clients during 2016–17 were:
- assistance to sustain tenancy or prevent tenancy failure or eviction (33%, or nearly 7,900); with 81% provided assistance.
- material aid/brokerage (30%); with 86% provided assistance.
- short-term or emergency accommodation (23%); with 50% provided assistance (Figure OLDER.2).
All these services were requested at the same or lower rates than the general SHS population (assistance to sustain tenancy or prevent tenancy failure or eviction 33%, material aid/brokerage 35%, short-term or emergency accommodation 37%).
Figure OLDER.2: Older clients by most needed services and service provision status (top 6), 2016–17
Notes
- Excludes ‘Other basic assistance’, ‘Advice/information’, and ‘Advocacy/liaison on behalf of client’.
- Short-term accommodation includes temporary and emergency accommodation; and sustain tenancy/prevent eviction includes assistance to sustain tenancy or prevent tenancy failure or eviction.
- ‘Neither’ indicates a service was neither provided nor referred.
Source: Specialist homelessness services 2016–17, National supplementary table OLDER.3.
Housing outcomes
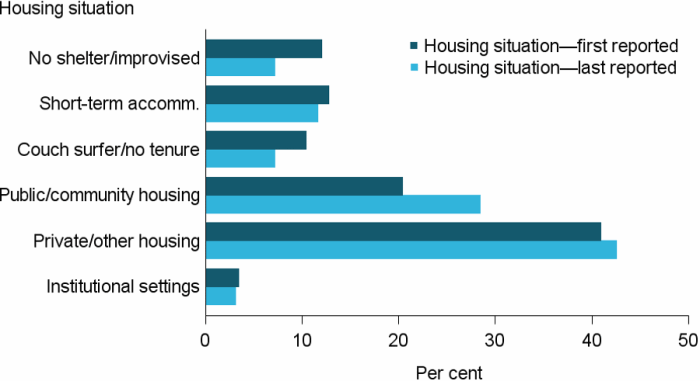
The majority of older clients with closed support were considered at risk of homelessness upon presentation to an SHS agency (65%): they were most commonly living in private or other housing at the time (42%).
This trend continued throughout support, with older clients most commonly ending their support in private or other housing (43%, or about 6,400). The proportion of older clients housed in public or community housing following support also increased from 20% to 28% in 2016–17.
There was a reduction in the proportion of older clients ‘rough sleeping’ (no shelter or improvised/inadequate dwelling), falling from just over 1 in 10 clients (12%, or 1,800 clients) at the commencement of support to 7% (or 1,085 clients) at the end (Figure OLDER.3).
Figure OLDER.3: Older clients, by housing situation at beginning of support and end of support, 2016–17
Notes
- The SHSC classifies clients living with no shelter or improvised/inadequate dwelling, short-term temporary accommodation, or in a house, townhouse, or flat with relatives (rent free) as homeless. Clients living in public or community housing (renter or rent free), private or other housing (renter or rent free), or in institutional settings are classified as housed.
- No shelter/improvised includes inadequate dwellings; short-term accommodation includes temporary and emergency accommodation; couch surfer/no tenure includes living in a house, townhouse or flat with relatives rent free; public/community housing includes both renting or rent free; and private/other housing includes both renting or rent free.
- Proportions include only clients with closed support at the end of the reporting period.
Source: Specialist homelessness services 2016–17, National supplementary table OLDER.4.
For some clients stable housing is more difficult to achieve than for others. The majority of older clients were housed but at risk of homelessness when they began support (Table Older.2). For these older clients who had ended support:
- agencies were best able to assist those housed in public or community housing or private/other housing; 95% were successfully assisted to maintain some form of housing.
- Around 9 in 10 older clients were able to maintain their public or community housing tenancy (92%, or 2,800 clients), with a further 4% assisted into private/other housing.
- Nearly 9 in 10 older clients were able to maintain their private/other housing tenancy (86%, or 5,200 clients), with a further 8% assisted into public or community housing.
For those older clients who were homeless when they began support, agencies were able to assist 35% into stable housing at the end of support (public or community housing, private or other housing, or Institutional settings).
- Just under 4 in 10 older clients who were living in short-term or emergency accommodation or who were ‘couch surfers’ were able to be assisted into stable housing following support (39%, or about 700 clients and 37%, or nearly 560 clients, respectively).
Table Older.2: Older clients, housing situation at beginning and end of support, 2016–17 (per cent)
| Situation at beginning of support | Situation at end of support: homeless |
Situation at end of support: housed |
|---|---|---|
| Homeless | 64.3 | 35.5 |
| At risk of homelessness | 5.4 | 94.6 |
Notes
- The SHSC classifies clients living with no shelter or improvised/inadequate dwelling, short-term temporary accommodation, or in a house, townhouse, or flat with relatives (rent free) as homeless. Clients living in public or community housing (renter or rent free), private or other housing (renter or rent free), or in institutional settings are classified as housed.
- Proportions include only clients with closed support at the end of the reporting period. Per cent calculations are based on total clients, excluding ‘Not stated/other’.
Source: Specialist homelessness services 2016–17, National supplementary table OLDER.4.