Clients who have experienced domestic and family violence
Domestic and family violence is the main reason women and children leave their homes in Australia [1] and is consistently one of the most common reasons clients have sought assistance from specialist homelessness agencies (see Clients, services and outcomes).
It is important to note that client numbers in the Specialist Homelessness Services Collection (SHSC) generally reflect the increased availability and accessibility of services, including domestic and family violence services.
While specialist homelessness service (SHS) agencies mainly assist people who are victims of domestic and family violence, they may also assist perpetrators of violence who seek homelessness services. Currently the SHSC is not able to separately identify these clients.
Key findings in 2016–17
- Overall, 40% of clients (or 114,757) seeking Specialist Homelessness Services were experiencing domestic and family violence. This is an increase from 38% in 2015–16.
- 61% were at risk of homelessness when they sought assistance, most commonly living in private/other housing.
- Nearly half (48%) were single parents with a child or children.
- Many were children: One-fifth of clients were children aged 0–9 (22%, or over 25,000), and nearly 40,000 (35%) clients were aged under 18 (a 10% increase from 2015–16 for the same age range).
- Almost all adults were female (91%): the largest number of adult females were aged 25–34 years (over 21,000) followed by those aged 35–44 (about 19,000).
- Half these clients (51%) had received homelessness services in the previous 5 years.
- On average, each client received assistance twice from homelessness agencies over the 12 month period (1.9 support periods per client) for a total of 39 days.
- 9 in 10 clients experiencing domestic and family violence who were at risk of homelessness, were assisted to maintain a housing tenancy.
- Of those clients experiencing domestic and family violence who were homeless when support began, nearly half (47%) were assisted into housing, the majority into private/other dwellings.
Clients experiencing domestic and family violence: 2012–13 to 2016–17
The number of clients reporting they had experienced domestic and family violence has increased since 2012–13. Various factors including increased community awareness, and reduced stigma have potentially contributed to the increase in reporting of domestic and family violence among SHS clients. Key trends identified over the past 5 years include:
- Clients experiencing domestic and family violence are increasing: Nationally, the number of clients reporting they had experienced domestic and family violence and sought assistance from specialist homelessness agencies has increased on average 10% each year since 2012–13 (Table DV Trends.1). The majority of these additional clients requesting assistance for domestic and family violence were single parent households (with a child or children).
- Jurisdictional increases: Tasmanian SHS agencies experienced the greatest average annual growth of domestic and family violence clients (16% each year), followed by the Northern Territory (14% each year) and Victoria (13% each year).
- Homelessness is rising among these clients: While it remains that the majority of clients who have experienced domestic and family violence are at risk of homelessness, the proportion of these clients who were homeless upon presentation has increased, from 35% in 2012–13 to 39% in 2016–17.
- Housing outcomes following support are improving: The proportion ending support with improved housing outcomes has increased, particularly for those in private rental or home owners (increased from 43% in 2012–13 to 48% in 2016–17).
Table DV Trends.1: Clients who have experienced domestic and family violence: at a glance—2012–13 to 2016–17
| 2012–13 | 2013–14 | 2014–15 | 2015–16 | 2016–17 | |
|---|---|---|---|---|---|
| Number of clients | 77,870 | 84,774 | 92,349 | 105,619 | 114,757 |
| Proportion of all clients | 32 | 33 | 36 | 38 | 40 |
| Rate (per 10,000 population) | 34.2 | 36.6 | 39.3 | 44.3 | 47.4 |
| Housing situation at the beginning of first support period (proportion of all clients) | |||||
| Homeless | 35 | 37 | 37 | 38 | 39 |
| At risk of homelessness | 65 | 63 | 63 | 62 | 61 |
| Length of support (median number of days) | 40 | 43 | 40 | 38 | 39 |
| Average number of support periods per client | 1.8 | 1.8 | 1.8 | 1.9 | 1.9 |
| Proportion receiving accommodation | 45 | 44 | 41 | 39 | 37 |
| Median number of nights accommodated | 32 | 34 | 32 | 31 | 31 |
| Proportion of a client group with a case management plan | 62 | 63 | 64 | 64 | 64 |
| Achievement of all case management goals (per cent) | 16 | 17 | 22 | 21 | 20 |
Notes
- Rates are crude rates based on the Australian estimated resident population (ERP) at 30 June of the reference year. Minor adjustments in rates may occur between publications reflecting revision of the estimated resident population by the Australian Bureau of Statistics.
- The denominator for the proportion achieving all case management goals is the number of client groups with a case management plan. Denominator values for proportions are provided in the relevant national supplementary table.
Source: Specialist Homelessness Services Collection 2012–13 to 2016–17.
Characteristics of clients experiencing domestic and family violence 2016–17
In 2016–17, specialist homelessness service agencies assisted 114,757 domestic and family violence clients. Compared with 2015–16:
- More clients received assistance: There were about 9,000 (9%) more clients seeking assistance for domestic and family violence from 2015–16, which is higher than the growth rate of the general SHS population (3%).
- Victoria continues to assists the greatest number of these clients: In 2016–17 about 50,000 clients experiencing domestic and family violence were assisted in Victoria (a 10% increase from 2015–16); New South Wales assisted the next largest number, nearly 26,000 (11% increase), while the Northern Territory had the largest percentage increase (31%, or 1,110 clients).
- More than 3 in 4 were female: Over three-quarters (77%) of domestic and family violence clients were female, the same as the previous year.
- Almost half were single parents: Nearly half of all clients (48%) seeking assistance for domestic and family violence were living in single parent households (with a child or children), similar to the previous year.
- Most were housed when seeking support: Sixty-one per cent were at risk of homelessness when first presenting for support, similar to the previous year (62%).
- Half had received services in the past: Within this client group, there was a similar distribution of ‘new’ and ‘returning’ clients in 2016–17 (51% and 49%, respectively). This trend was observed in all states and territories.
- One in 4 clients (25%) experiencing domestic and family violence were Indigenous, matching the overall SHS population.
Age and sex
The majority (94%) of clients of specialist homelessness services in 2016–17 who were experiencing domestic and family violence were females and children, a slight increase from 2015–16 (Figure DV.1). In 2016–17:
- Females aged 15 and over accounted for 62% (or nearly 72,000) of this group.
- Children aged 14 and under accounted for an additional 30% (or about 34,000).
- Males aged 15 and older accounted for 8% (or about 9,000) of the client group.
- Among children aged 0–9 years, there were similar numbers of boys and girls, totalling about 25,500 children.
Figure DV.1: Clients who have experienced domestic and family violence, by age and sex, 2016–17
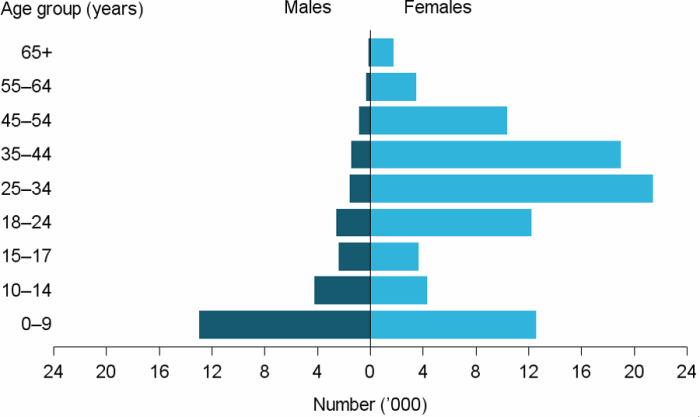
Source: Specialist homelessness services 2016–17, National supplementary table DV.1
The majority (64%) of the 89,000 clients experiencing domestic and family violence and aged over 10 did not report either mental health or problematic drug and/or alcohol use.
Of the domestic and family violence clients who did present with multiple vulnerabilities (Figure DV.2):
- One-quarter (25%) also reported a current mental health issue
- A further 1 in 13 (8%, or about 7,500 clients) reported both problematic drug and/or alcohol use, and a current mental health issue, in addition to experiencing domestic and family violence.
Figure DV.2: Clients experiencing domestic and family violence, by selected vulnerability characteristics, 2016–17
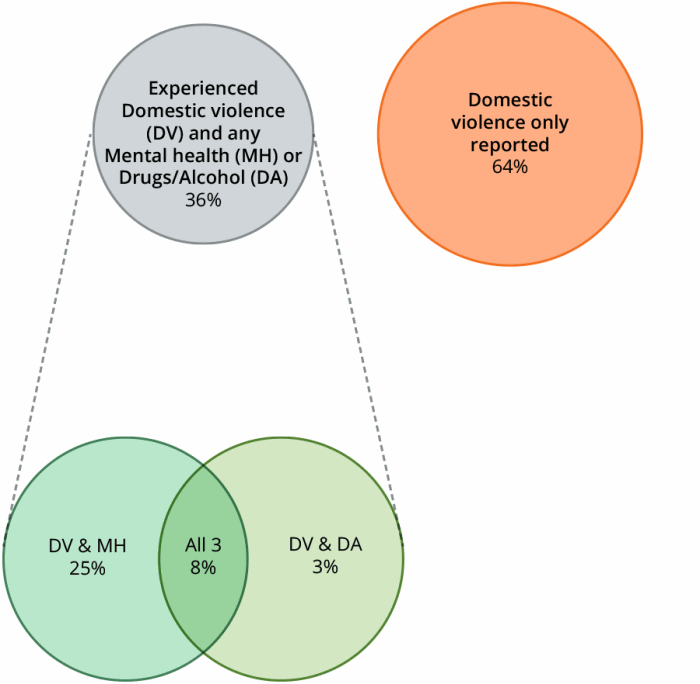
Notes
- Client vulnerability groups are mutually exclusive.
- Clients are aged 10 and over.
Source: Specialist Homelessness Services Collection 2016–17.
Services needed and provided
The majority of clients who had experienced domestic and family violence identified needing specific assistance for this reason, which may include therapeutic discussion or group sessions, counselling and specialised domestic violence support services (73%, or about 83,700). Of the persons identified as needing assistance for domestic and family violence, 87% were provided assistance.
83,700 clients needed specific assistance for domestic and family violence.
Almost 9 in 10 (87%) were provided this assistance.
The next most common services requested by this client group were (Figure DV.3):
- short-term or emergency accommodation (42%, or over 48,000) and 72% of these clients received this service;
- material aid/brokerage (38%), with 88% of those requesting this service receiving assistance;
- family/relationship assistance (30%), with 84% of these clients receiving assistance;
- long-term housing (30%), with just 4% of those requesting this service receiving assistance; and
- transport (28%) and 94% received this service.
Figure DV.3: Clients who have experienced domestic and family violence, by top 6 services and service provision status, 2016–17
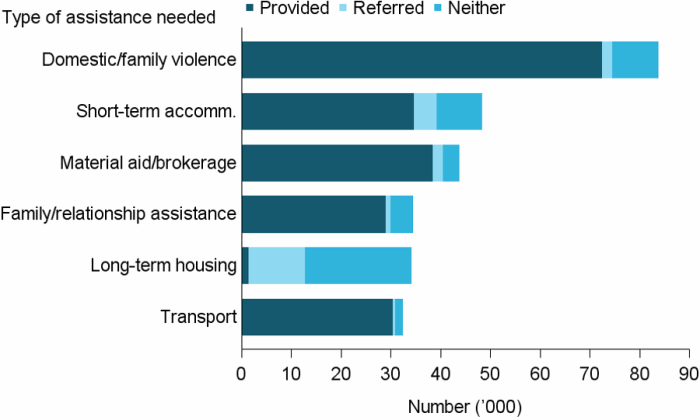
Notes
- Excludes ‘Other basic assistance’, ‘Advice/information’, and ‘Advocacy/liaison on behalf of client’.
- Short-term accommodation includes emergency accommodation.
Source: Specialist homelessness services 2016–17, National supplementary table DV.3.
Reasons for seeking assistance
There were 2 main reasons why clients experiencing domestic and family violence sought assistance from SHS agencies. Domestic and family violence was identified as the main reason for nearly 7 in 10 clients (69%), while housing crisis was identified as the main reason by 11% of clients.
Housing outcomes
Housing outcomes for clients who experienced domestic and family violence and whose support had ended are shown in Figure DV.4. At the start of their support:
- nearly 3 in 5 (59%) were housed, but at risk of homelessness
- clients were most commonly living in private rental accommodation (either as a renter or rent free) (42%).
Housing outcomes at the end of support for those clients who had experienced domestic or family violence revealed that:
- The proportion of homeless clients decreased; from 41% at the beginning to 28% at the end of their support.
- This decrease was particularly evident for those living in short-term temporary accommodation which decreased from 21% to 15% following support.
- Almost 1 in 4 (23%) were living in public or community housing following support—up from 16% at the start of support (Figure DV.4).
Figure DV.4: Clients who have experienced domestic and family violence, by housing situation at the beginning and end of support, 2016–17
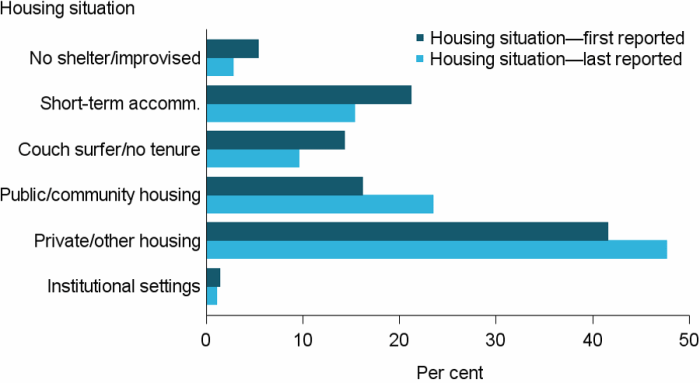
Notes
- The SHSC classifies clients living with no shelter or improvised/inadequate dwelling, short-term temporary accommodation, or in a house, townhouse, or flat with relatives (rent free) as homeless. Clients living in public or community housing (renter or rent free), private or other housing (renter or rent free), or in institutional settings are classified as housed.
- No shelter/improvised includes inadequate dwellings; short-term accommodation includes temporary accommodation; couch surfer/no tenure includes living in a house, townhouse or flat with relatives rent free; public/community housing includes both renting or rent free; and private/other housing includes both renting or rent free.
- Proportions include only clients with closed support at the end of the reporting period.
Source: Specialist homelessness services 2016–17, National supplementary table DV.4.
The majority of clients experiencing domestic and family violence were housed, but at risk of homelessness, when they sought assistance (see Glossary) (Table DV.2). Of those whose support had ended:
- 9 in 10 (89%, or about 34,000) were successfully assisted to maintain a housing tenancy.
- 82% (7,600 clients) remained in public/community housing and a further 8% were housed in private/other housing.
- 83% (19,500 clients) remained in private/other housing and a further 7% were housed in public/community housing.
Of those clients experiencing domestic and family violence who were homeless when they began support:
- 47% were assisted into stable housing at the end of support, the majority into private/other housing.
- 6,100 were assisted into private/other housing
- 4,200 were assisted into public or community housing.
Agencies were best able to assist those in short-term emergency accommodation into stable housing (52%, or over 6,000 clients) and couch surfers (43%, or about 3,400 clients).
Table DV.2: Clients who have experienced domestic and family violence, housing situation at beginning and end of support, 2016–17 (per cent)
| Situation at beginning of support | Situation at end of support: homeless |
Situation at end of support: housed |
|---|---|---|
| Homeless | 53.0 | 47.0 |
| At risk of homelessness | 10.9 | 89.2 |
Notes
- The SHSC classifies clients living with no shelter or improvised/ inadequate dwelling, short-term temporary accommodation, or in a house, townhouse, or flat with relatives (rent free) as homeless. Clients living in public or community housing (renter or rent free), private or other housing (renter or rent free), or in institutional settings are classified as housed.
- Proportions include only clients with closed support at the end of the reporting period. Per cent calculations are based on total clients, excluding ‘Not stated/other’.
Source: Specialist homelessness services 2016–17, National supplementary table DV.4.
Reference
- Spinney A, 2012. Home and safe? Policy and practice innovations to prevent women and children who have experienced domestic and family violence from becoming homeless. Final report no. 196. Melbourne: Australian Housing and Urban Research Institute.