All cancers combined and Australia’s most common cancers: COB and ROB comparisons
This page discusses the incidence of Australia's most common cancers by country and region of birth. The cancers discussed on this page are listed and by selecting the cancer the page will move to the discussion of the selected cancer:
More cancers are discussed in the Cancer incidence by country and region of birth for selected cancers page.
All cancers combined
All cancers combined comprises all cancers with the exception of basal and squamous cell carcinomas of the skin. These cancers are not notifiable in all jurisdictions and accordingly are not included in the Australian Cancer Database.
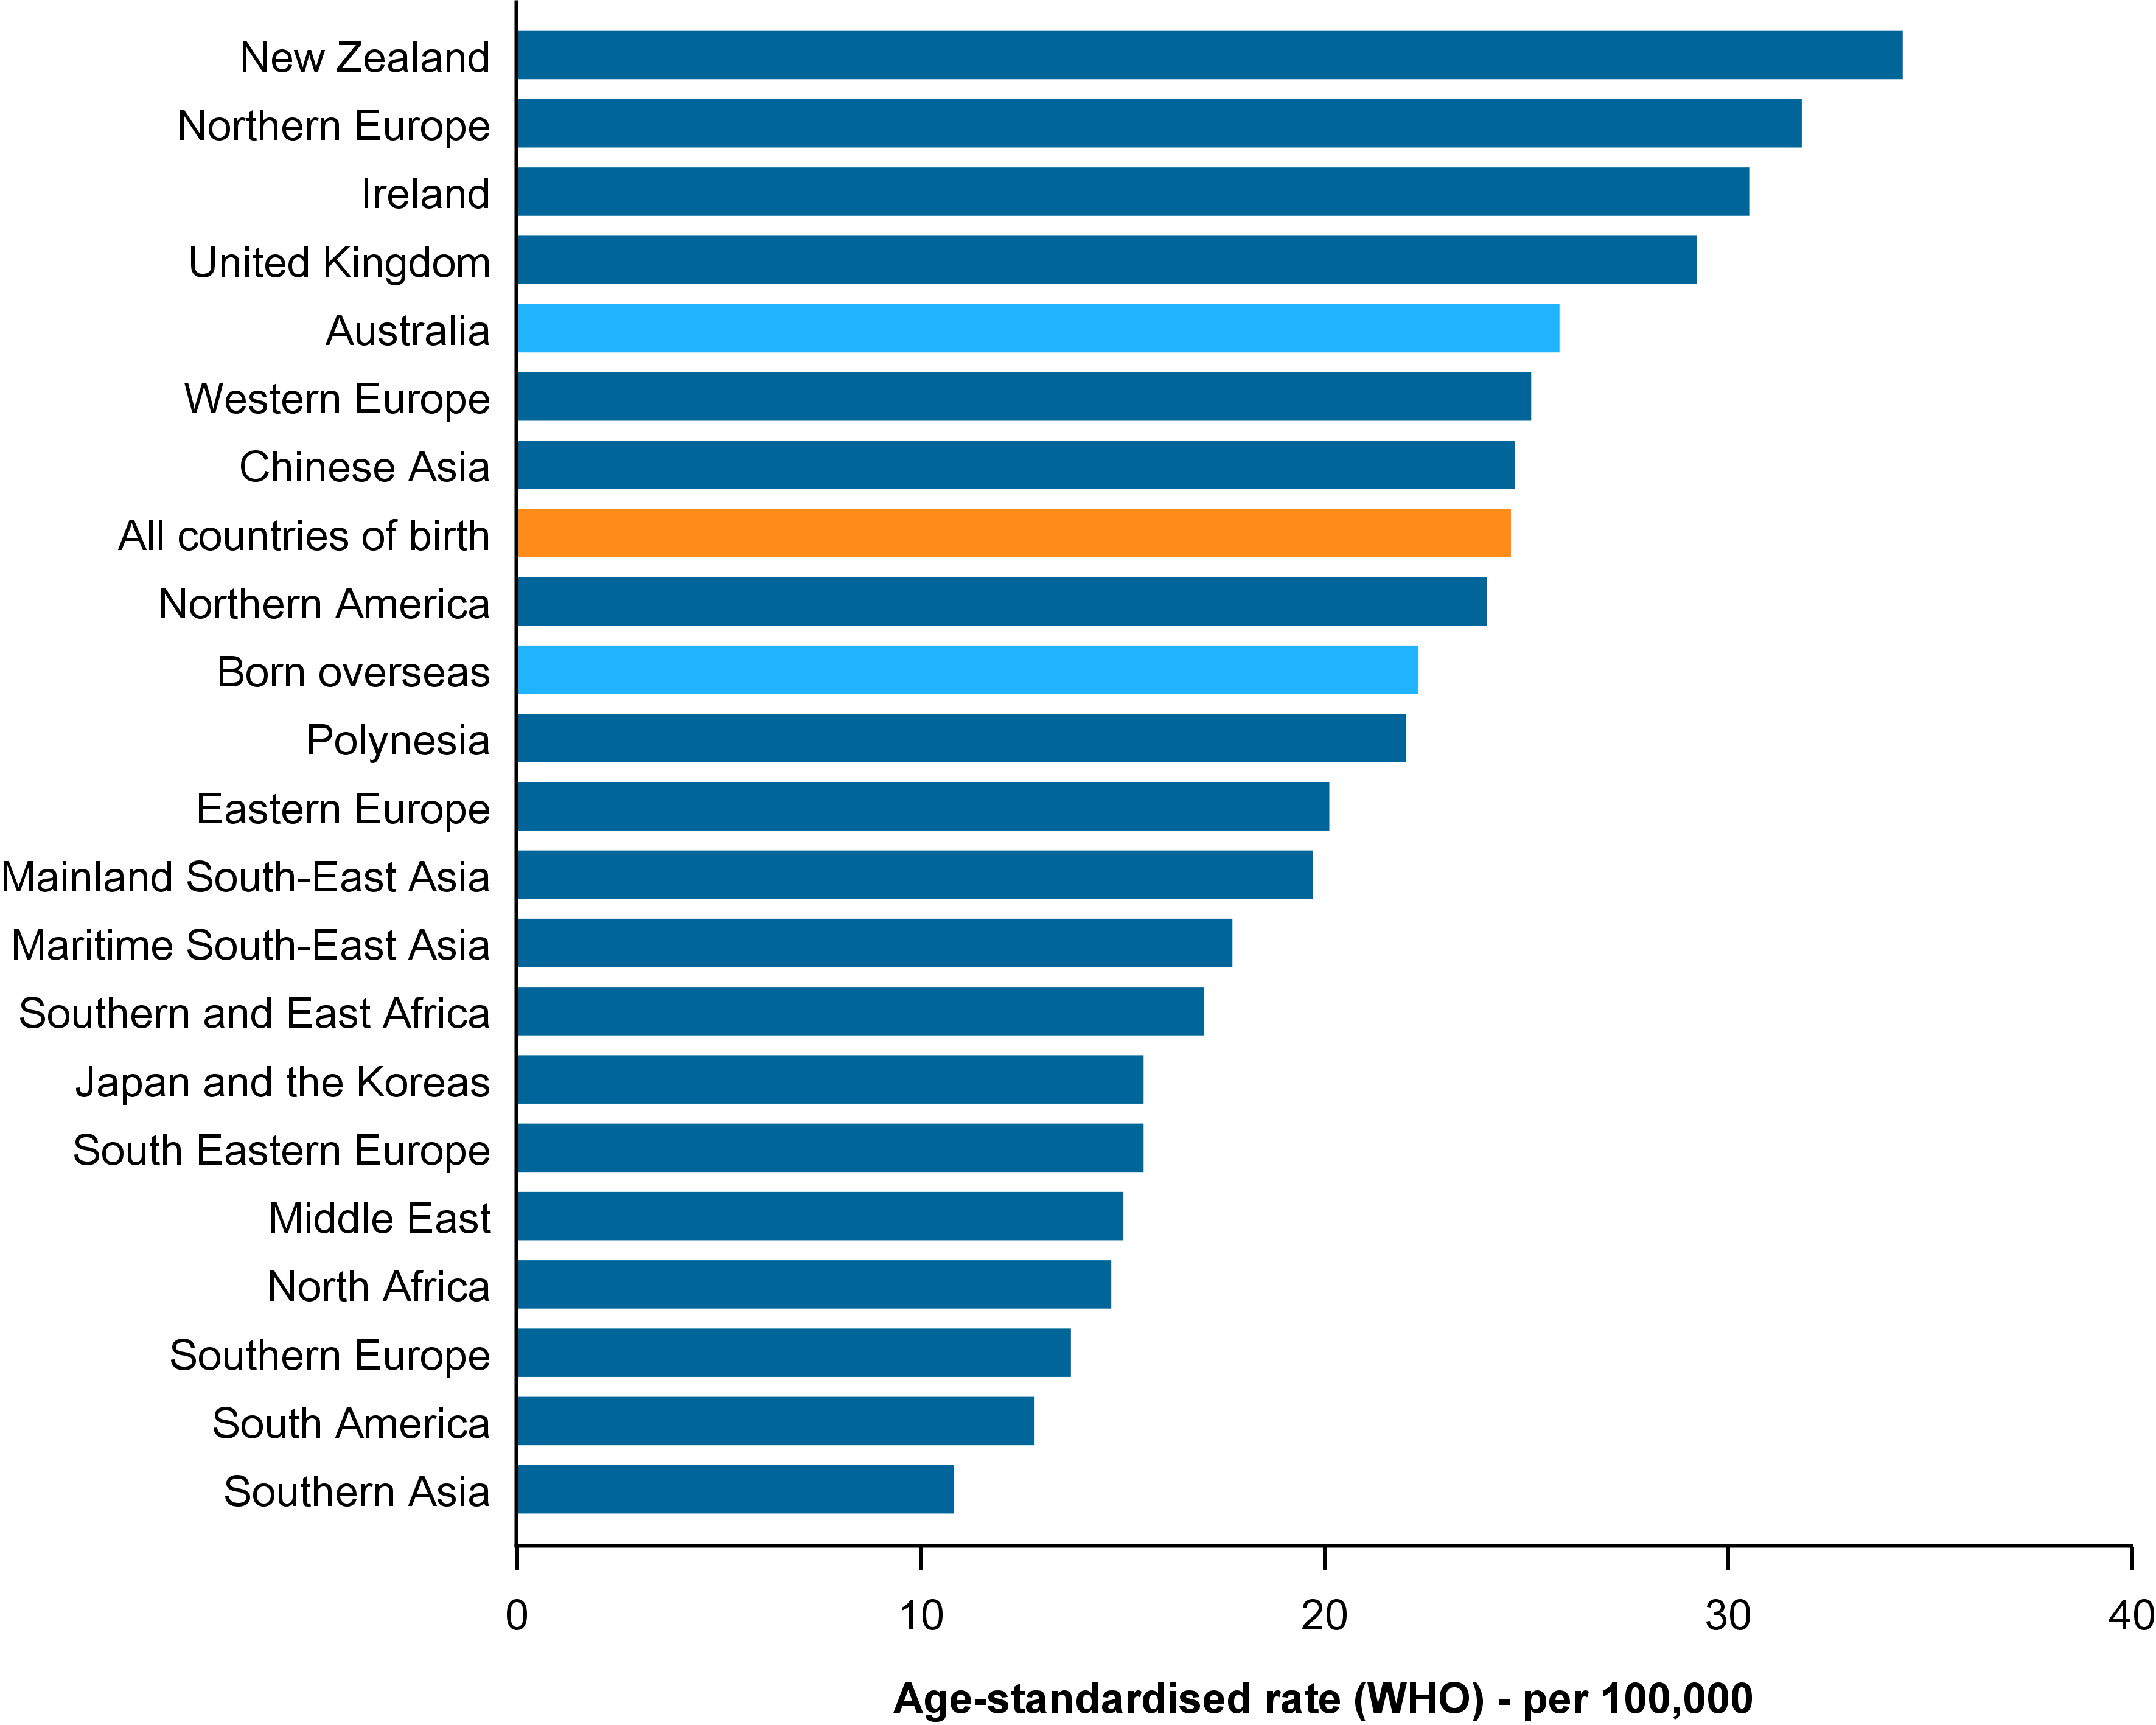
People born in Asia had the lowest cancer incidence rates
Cancer incidence rates (for all cancers combined) for the 2006–2020 period by region of birth (ROB) within Australia ranged from around 200 cases per 100,000 people to around 400 cases per 100,000 people. People born in Asian regions had the lowest cancer incidence rates. The highest rates of cancer were for populations born in Australia and New Zealand. European regions of birth (ROBs) also figured with higher incidence rates with the northern and western European regions being higher than eastern and southern European ROBs (Figure 2).
New Zealand-born and Australia-born cancer incidence rates were around 400 cases per 100,000 people for 2006–2020. These rates are substantially higher than Asian ROBs, which had cancer incidence rates ranging between 200 and 250 cases per 100,000 people (Figure 2).
Figure 2: All cancers combined age-standardised incidence rates, by region of birth: persons, Australia, 2006–2020

Notes:
- Rates are age-standardised to the WHO World Standard Population and expressed cases per 100,000 persons.
- Includes regions of birth with on average 20,000 people living in Australia between 2006 and 2020 and 20 or more cancer cases diagnosed for the period. Excludes the regions of Central Asia and Melanesia which are discussed separately in this section of this report.
- All cancers combined comprises ICD-10 codes C00–C97, D45, D46, D47.1 and D47.3–D47.5, except basal and squamous cell carcinomas of the skin (part of C44).
- Born overseas includes born in any country except for Australia. All countries of birth rates are the national rates for Australia and includes the population born in Australia and all other countries.
Source: Australian Cancer Database 2020
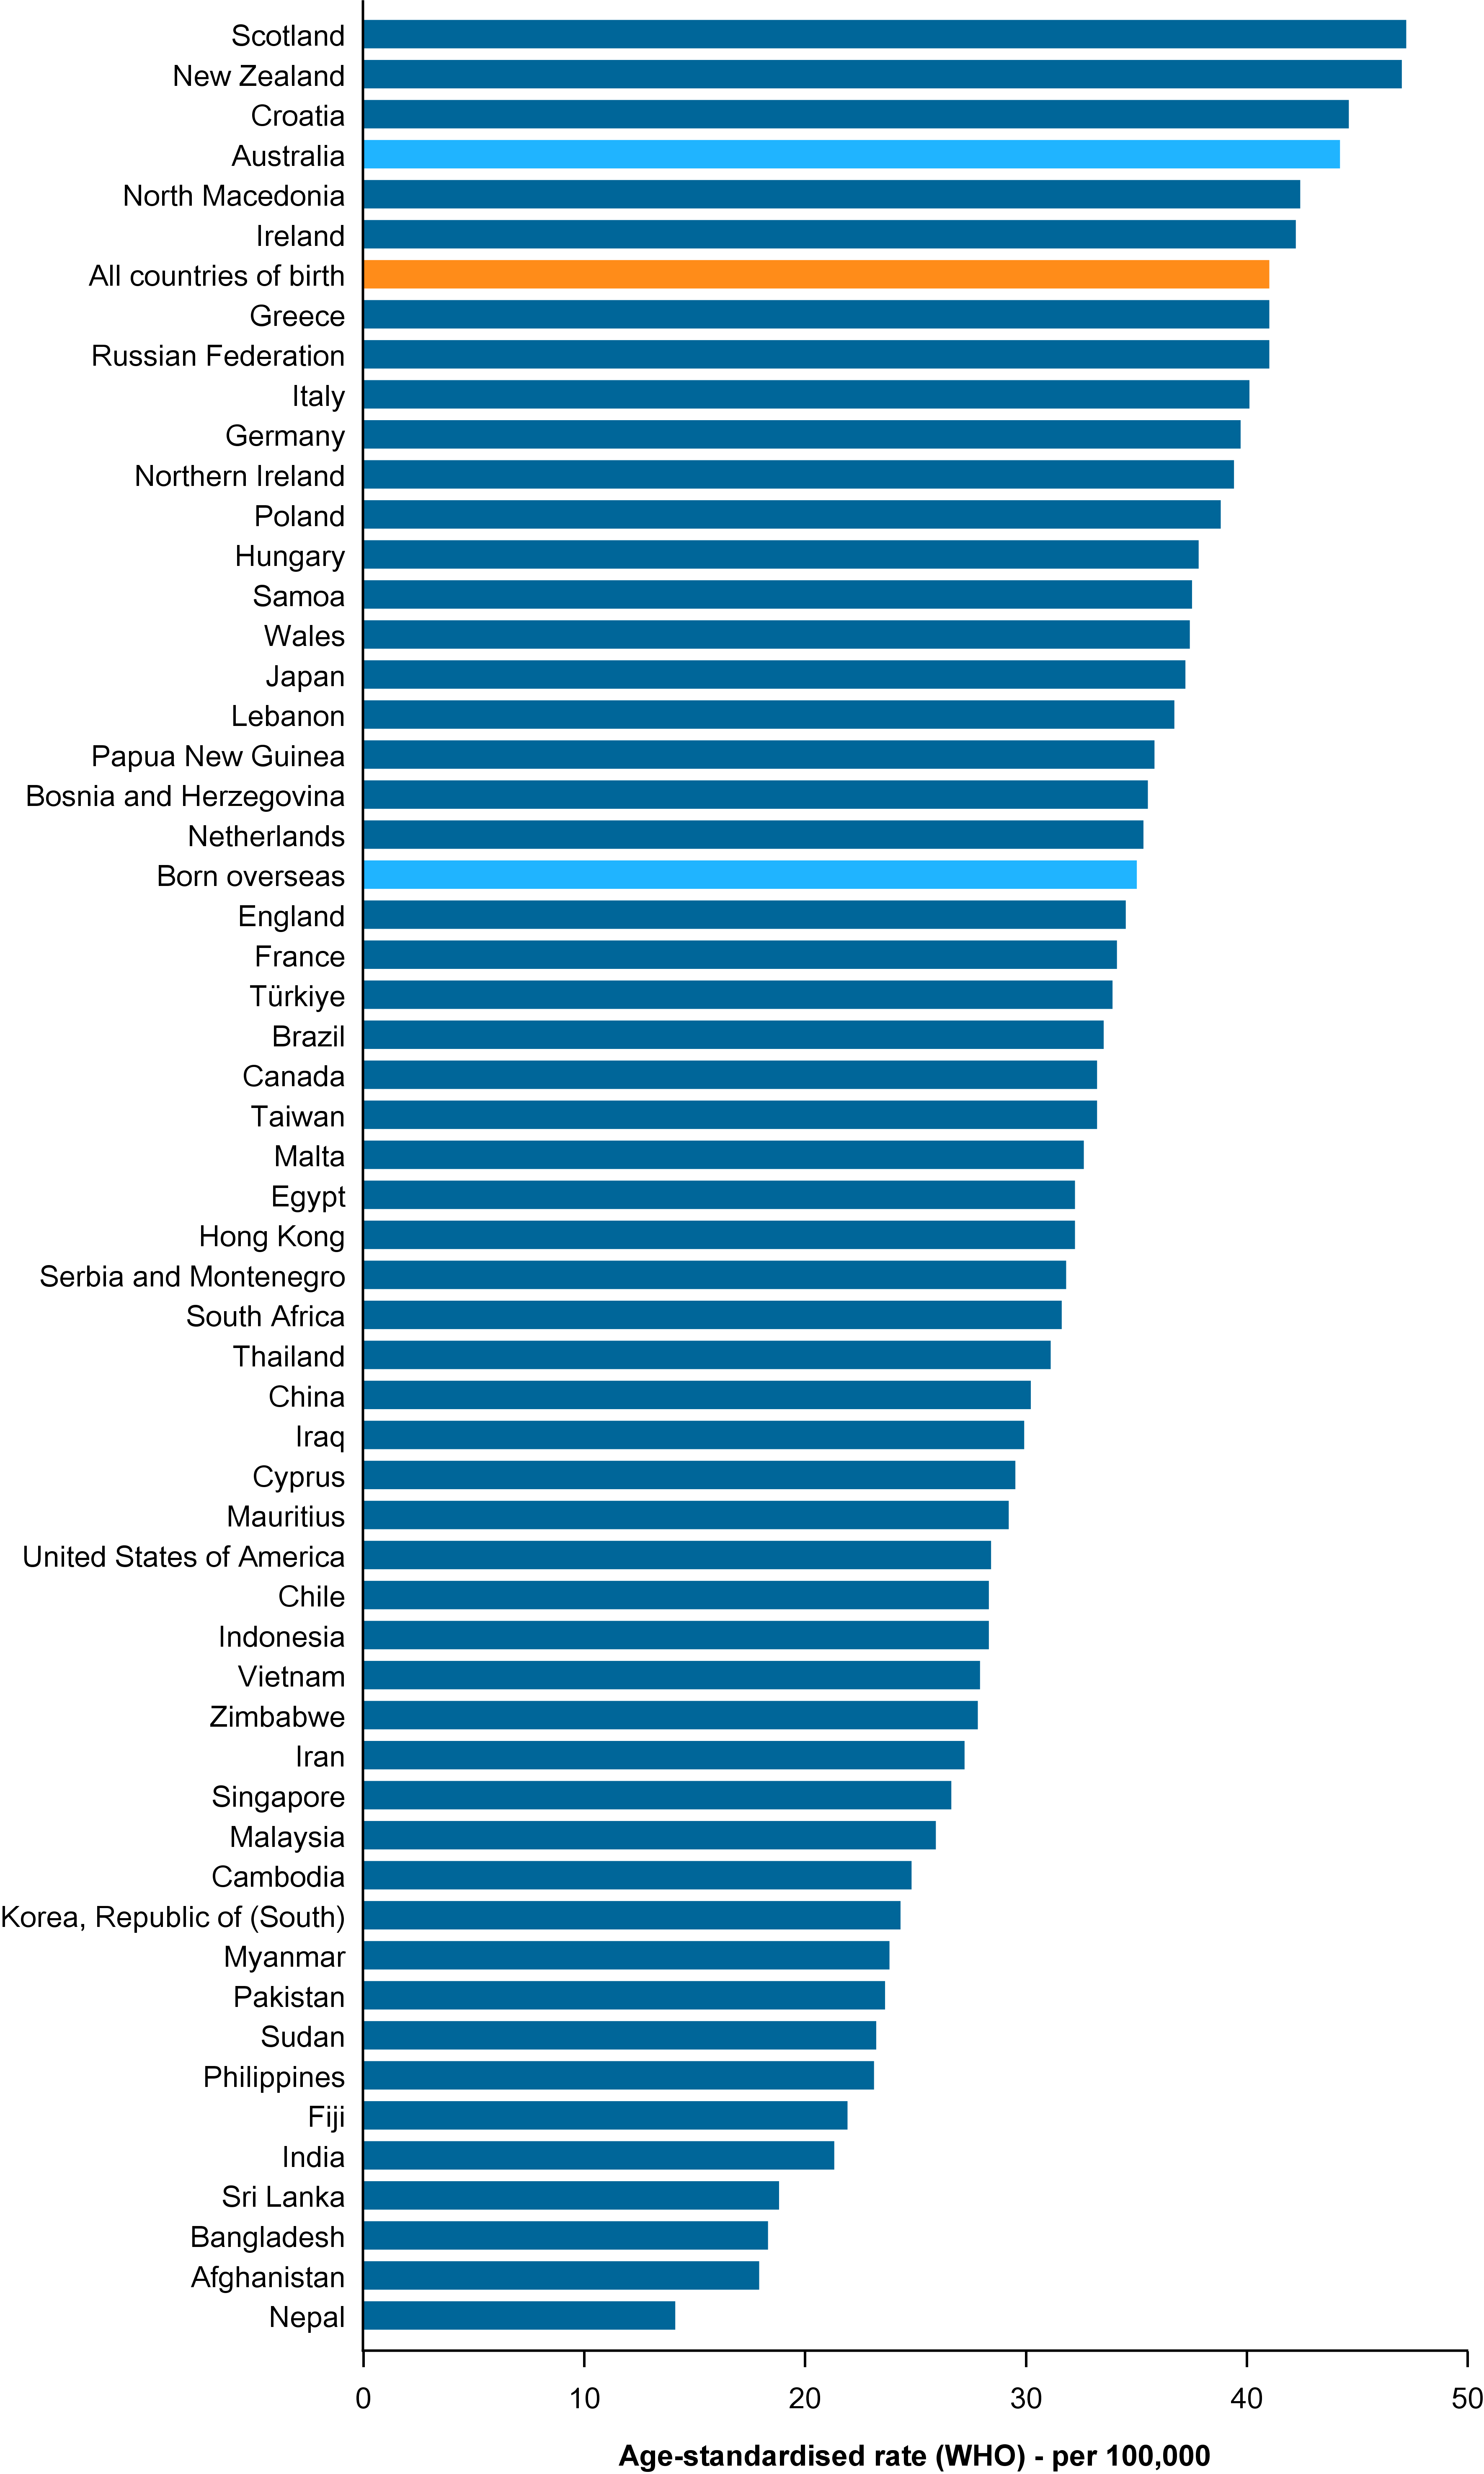
The countries of birth with the lowest cancer rates were around half that of those with the highest rates
The highest cancer incidence rates by country of birth (COB) in 2006–2020 were all over 400 cases per 100,000 people. These countries of birth (COBs) were Samoa (413 cases per 100,000 people), New Zealand (407 cases per 100,000 people), Scotland (405 cases per 100,000 people) and Australia (401 cases per 100,000 people) (Figure 3).
There were five COBs with cancer incidence rates below 210 cases per 100,000 people and these were all Asian COBs. The five COBs were Nepal, Sri Lanka, Cambodia, India and the Republic of Korea (161, 189, 202, 203 and 206 cases per 100,000 people respectively) (Figure 3).
After Scotland, the European COBs with the highest cancer incidence rates in 2006–2020 were Ireland, Hungary and Northern Ireland (375, 363, and 354 cases per 100,000 people). The European COBs with the lowest cancer incidence rates in 2006–2020 were Serbia and Montenegro, Bosnia and Herzegovina, and North Macedonia (252, 258 and 281 cases per 100,000 people respectively) (Figure 3).
The Asian COBs with the highest cancer incidence rates were Indonesia, Hong Kong, Japan and the Philippines (279, 262, 257 and 253 cases per 100,000 people respectively). The Asian COBs with the highest cancer incidence rates were similar to the European COBs lowest incidence rates (Figure 3).
Cancer incidence rates for COBs in the Middle East ranged between 311 cases per 100,000 people (Lebanon) and 261 cases per 100,000 people (Iran). These rates place the Middle East COBs at the high end of Asian COBs cancer incidence and towards the lower end of the European COBs.
There are only four COBs reportable for the Americas and the cancer incidence rates for Canada and the United States of America in 2006–2020 (346 and 336 cases per 100,000 people respectively) were above the South American COBs of Brazil and Chile (277 and 261 cases per 100,000 people respectively) (Figure 3).
Figure 3: All cancers combined age-standardised incidence rates, by country of birth: persons, Australia, 2006–2020

Notes:
- Rates are age-standardised to the WHO World Standard Population and expressed cases per 100,000 persons.
- Includes countries of birth with on average 20,000 people living in Australia between 2006 and 2020 and 20 or more cancer cases diagnosed for the period.
- All cancers combined comprises ICD-10 codes C00–C97, D45, D46, D47.1 and D47.3–D47.5, except basal and squamous cell carcinomas of the skin (part of C44).
- Born overseas includes born in any country except for Australia. All countries of birth rates are the national rates for Australia and includes the population born in Australia and all other countries.
Source: Australian Cancer Database 2020
For all cancers combined, the ROB cancer incidence rates are often generally representative of the COBs within but there are exceptions including the United Kingdom and Polynesia ROBs.
Scotland-born cancer incidence rates were much higher than other countries of birth within the United Kingdom
The United Kingdom ROB cancer incidence rate for 2006–2020 was 348 cases per 100,000 people. The rates by COB include England-born at 338 cases per 100,000 people, Northern Ireland-born at 354 cases per 100,000 people, Wales-born at 349 cases per 100,000 people and Scotland-born at 405 cases per 100,000 people. All COBs cancer incidence rates were near the United-Kingdom-born rate with the exception of the Scotland-born population. The Scotland-born cancer incidence rates were in the highest tier of cancer incidence in Australia for 2006–2020 and are discussed in Box 1.
Box 1: Lung cancer’s influence on Scotland-born cancer incidence rates
According to the 2016 Census, the median age of people living in Australia and born in Scotland was 58 years of age; the median age for Australia-born people was 34 and for overseas-born was 44. More than 50% of the Scotland-born population living in Australia in 2016 arrived in Australia before 1980 (ABS 2016).
A notable contributor to the high cancer incidence for the Scotland-born population was lung cancer. The Scotland-born lung cancer incidence rate for the 2006–2020 period was 50 cases per 100,000 people. The equivalent rates for both the Australia-born and overseas-born populations were around 30 cases per 100,000 people.
For the Scotland-born population in 2006–2020, lung cancer was the second most commonly diagnosed cancer and in 2016–2020 it was the most commonly diagnosed cancer. In contrast, for both of these periods, lung cancer was the fifth most commonly diagnosed cancer for the Australia-born population.
When lung cancer is excluded, the overall cancer incidence for the Scotland-born population is less than the Australia-born incidence rates (355 compared to 371 cases per 100,000 people). While broadly similar all cancers combined incidence rates occur when lung cancer is excluded, differences by cancer remain. For example, the Australia-born population had higher melanoma of the skin incidence rates (51 cases per 100,000 people compared to 32 cases per 100,000 people) while Scotland-born incidence was higher for bladder cancer (9.1 compared to 6.4 cases per 100,000 people), pancreatic cancer (9.5 compared to 8.1 cases per 100,000 people), stomach cancer (7.8 compared to 5.3 cases per 100,000 people), liver cancer (6.9 compared to 4.8 cases per 100,000 people) and oesophageal cancer (6.1 compared to 4.3 cases per 100,000 people). Smoking is a primary risk factor for lung cancer and it is also a common risk factor for the above-mentioned cancers where Scotland-born incidence was higher.
Mesothelioma is a rare cancer and is more commonly diagnosed in males. For 2006–2020, mesothelioma incidence rates for Scotland-born males were 6.4 cases per 100,000 males, double the Australia-born rate of 3.2 cases per 100,000 males. Higher mesothelioma cancer incidence rates were also evident for other COBs within the United Kingdom ROB. For example, males from England and Wales COBs had 4.7 and 5.1 cases per 100,000 males respectively. The main risk factor for mesothelioma is exposure to asbestos.
For the Polynesia region of birth, Fiji-born cancer incidence is very different to Samoan-born cancer rates
While it is not expected for COBs within a ROB to have the same cancer incidence, there is often a degree of commonality for many cancers and all cancers combined. For the Polynesia ROB, the 2006–2020 rate of 321 cases per 100,000 people is not a reflection of either of the two largest Polynesia-born populations living in Australia. For these, the Fiji-born population cancer incidence rate was 256 cases per 100,000 people while the Samoa-born population was 413 cases per 100,000.
Almost all of the leading 10 cancers for the Polynesia-born population saw the Samoan-born population record much higher incidence rates (Table 3). The Fiji-born population in 2006–2020 represented 60% of the Polynesia-born population, the Samoa-born population was 23% while the remainder are from populations are too small to individually report on within this report but are included within Polynesia-born rates.
Cancer | Polynesia-born | Fiji-born | Samoa-born |
|---|---|---|---|
Breast cancer (females) | 96.1 | 88.0 | 100.8 |
Prostate cancer (males) | 95.7 | 80.3 | 120.9 |
Colorectal cancer (persons) | 27.5 | 21.9 | 37.5 |
Lung cancer (persons) | 24.7 | 15.0 | 40.2 |
Uterine cancer (females) | 40.9 | 27.5 | 60.3 |
Thyroid cancer (persons) | 13.5 | 14.5 | 10.7 |
Stomach cancer (persons) | 9.8 | 5.1 | 21.1 |
Liver cancer (persons) | 8.9 | 4.9 | 10.0 |
Non-Hodgkin lymphoma (persons) | 9.5 | 7.8 | 14.3 |
Pancreatic cancer (persons) | 8.7 | 7.4 | 11.4 |
All cancers combined (persons) | 320.7 | 255.6 | 413.2 |
Notes:
- Rates are age-standardised to the WHO World Standard Population and expressed cases per 100,000 population (that is, per 100,000 females for females, per 100,000 males for males and per 100,000 people for persons).
- Rankings are ordered by the number of cases (for Polynesia) but for comparability are presented as age-standardised rates.
- All cancers combined comprises ICD-10 codes C00–C97, D45, D46, D47.1 and D47.3–D47.5, except basal and squamous cell carcinomas of the skin (part of C44).
Source: Australian Cancer Database 2020
Australia-born, Scotland-born and New Zealand-born males had the highest cancer incidence rates while the Samoa-born female population had the highest rate for females
For much of this report, discussion focusses on cancer rates for entire populations. However, rates by sex are also available and can provide finer level insights and interesting differences. For example, the Samoa-born population cancer incidence rate for 2006–2020 was 413 cases per 100,000 persons while the Australia-born rate was 401 cases per 100,000 persons. However, the rate for Samoa-born males was 409 cases per 100,000 males, lower than the Australia-born rate of 466 cases per 100,000 males. Conversely, the Samoa-born female rates were much higher than the Australia-born female rates (422 compared to 348 cases per 100,000 females).
Comparisons made by sex may provide extra insights to the population comparisons although in many instances if a COB has comparatively high rates of cancer for a sex, the same will be true of the other sex in the report. Table 4 provides the top 20 ASRs for all cancers combined by COB for males, females and persons.
Rank | Country of birth - Males | ASR | Country of birth - females | ASR | Country of birth - persons | ASR |
|---|---|---|---|---|---|---|
1 | Australia | 466.0 | Samoa | 421.5 | Samoa | 413.2 |
2 | Scotland | 459.8 | New Zealand | 367.8 | New Zealand | 407.0 |
3 | New Zealand | 448.6 | Scotland | 354.8 | Scotland | 405.2 |
4 | Ireland | 429.0 | Australia | 348.0 | Australia | 401.4 |
5 | Samoa | 408.9 | Papua New Guinea | 341.7 | Ireland | 374.6 |
6 | Papua New Guinea | 408.7 | Sudan | 332.9 | Papua New Guinea | 367.1 |
7 | Russian Federation | 401.2 | Hungary | 322.4 | Hungary | 363.0 |
8 | Wales | 399.7 | Ireland | 321.3 | Northern Ireland | 354.3 |
9 | Northern Ireland | 399.3 | Russian Federation | 319.4 | France | 350.2 |
10 | France | 398.7 | Northern Ireland | 310.4 | Russian Federation | 349.5 |
11 | Hungary | 396.6 | France | 309.0 | Wales | 348.7 |
12 | Germany | 392.7 | Netherlands | 306.8 | Netherlands | 347.5 |
13 | Netherlands | 389.3 | Canada | 306.4 | Sudan | 346.2 |
14 | Greece | 387.6 | Germany | 301.7 | Germany | 346.1 |
15 | Canada | 384.5 | England | 301.6 | Canada | 345.6 |
16 | Croatia | 379.1 | United States of America | 297.9 | England | 338.4 |
17 | England | 378.4 | Lebanon | 296.4 | Greece | 337.4 |
18 | Italy | 375.2 | Wales | 296.1 | United States of America | 336.0 |
19 | Poland | 374.9 | Egypt | 295.7 | Italy | 323.2 |
20 | United States of America | 366.3 | Greece | 294.9 | South Africa | 322.0 |
Notes:
- ASR = Age standardised rates. Rates are age-standardised to the WHO World Standard Population and expressed cases per 100,000 population (that is, per 100,000 females for females, per 100,000 males for males and per 100,000 people for persons).
- All cancers combined comprises ICD-10 codes C00–C97, D45, D46, D47.1 and D47.3–D47.5, except basal and squamous cell carcinomas of the skin (part of C44).
- Includes countries of birth with on average 20,000 people living in Australia between 2006 and 2020 and 20 or more cancer cases diagnosed in the period.
Source: Australian Cancer Database 2020
All cancers combined incidence rates provide general understandings of cancer
All cancers combined provides the overall cancer incidence. However, two different ROBs or COBs may have similar overall cancer incidence but differences in the composition of cancer types. Also, a COB/ROB may have very low incidence for all cancers combined, yet have exceptionally high incidence for one or more specific cancers. The following sections explore incidence for selected cancers by COB and ROB.
Prostate Cancer
The Australian national cancer incidence rates changed considerably within the time-period of analysis. In general, rates increased greatly from 2000 to around 2009 before decreasing to around 2013 to arrive at more stable levels. More information about the drivers for these trends is available within the Cancer data commentary number 9.
Prostate cancer was the most commonly diagnosed cancer for males for all regions of birth
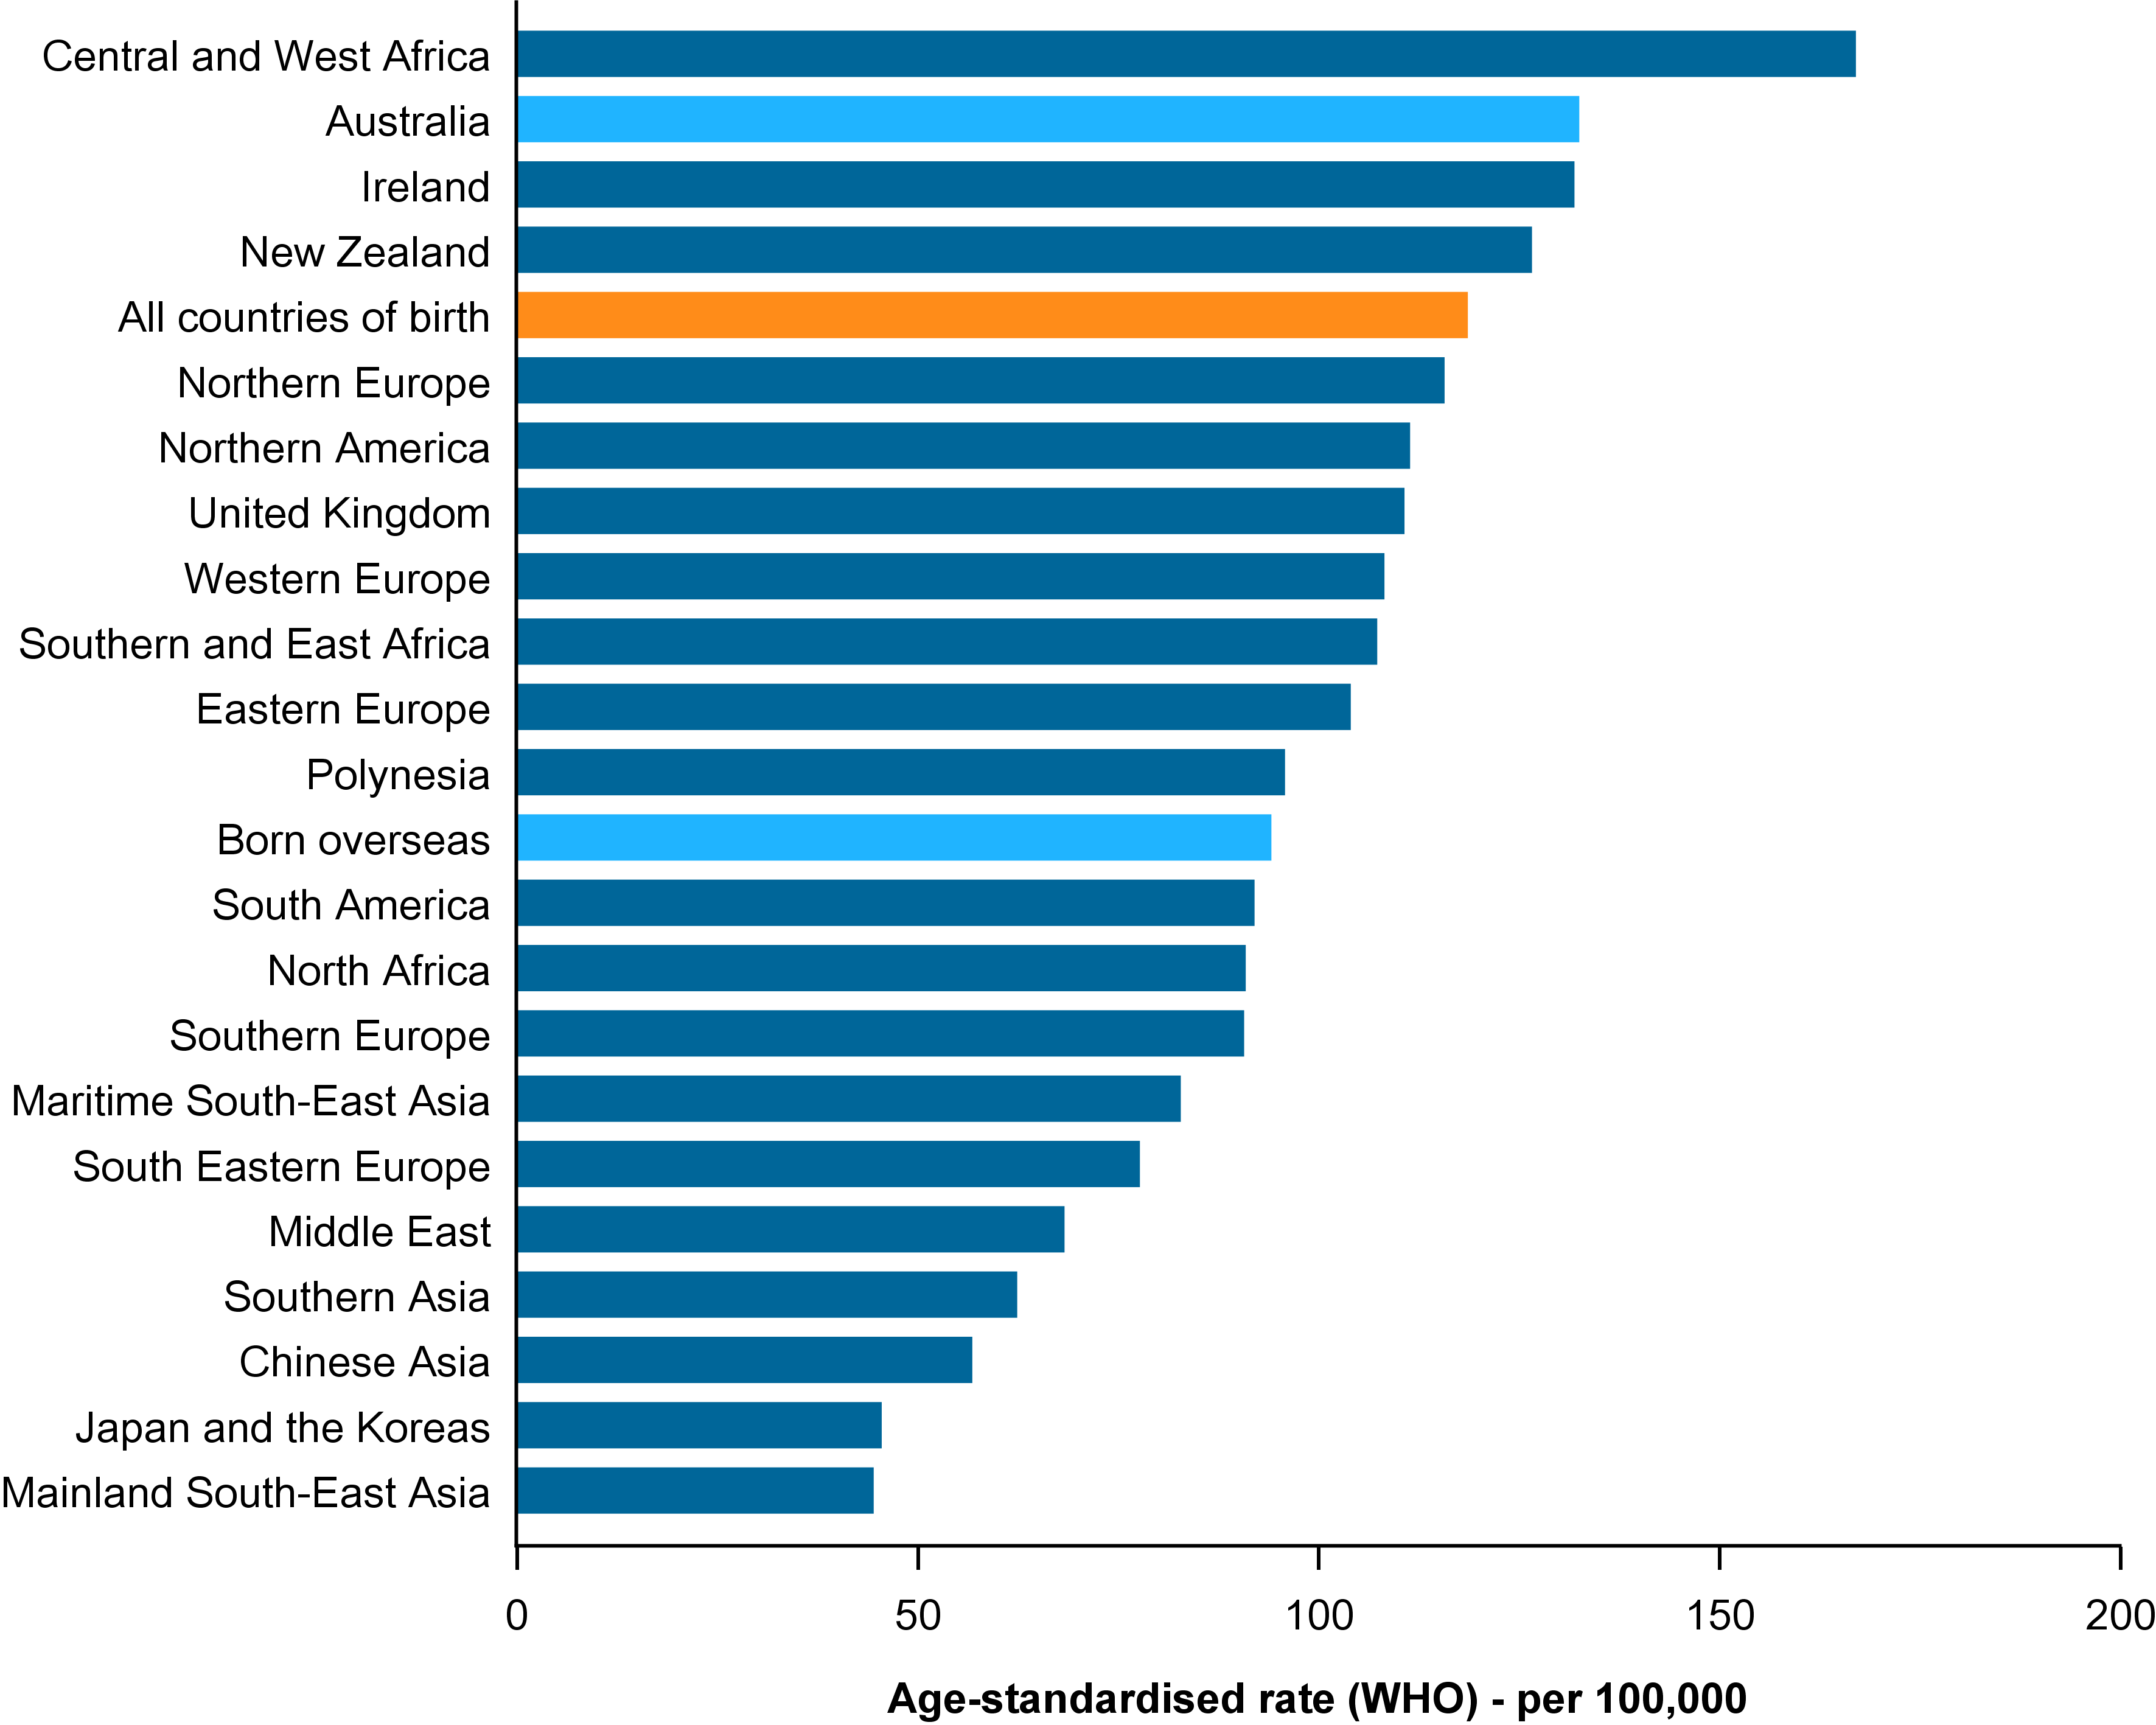
Prostate cancer was the most commonly diagnosed cancer for males in 2006–2020 for all regions of birth (ROBs) and ranged between 40 and 167 cases per 100,000 males (Figure 4). This was the greatest range of incidence rates for a cancer in males.
For the 2006–2020 period, the Australian-born male population had higher incidence rates of prostate cancer than the male population born overseas (132 cases per 100,000 males compared to 94 cases per 100,000 males). Prostate cancer incidence rates for males for the 2006–2020 period correlate highly with all cancers combined incidence rates and were a major contributor to the considerable disparity between Australia-born and overseas-born cancer incidence (that is, for all cancers combined) generally.
Prostate cancer incidence rates were highest for males born in Central and West Africa, Australia, Ireland and New Zealand
Males born in Central and West Africa had high prostate cancer incidence for 2006–2020 (167 cases per 100,000 males) (Figure 4). The Central and West Africa population residing in Australia is relatively small and there are no countries of birth (COBs) within it with a sufficiently large number of people diagnosed with cancer to report on. For 2006–2020, the COBs with the largest populations from the ROB were the Nigeria-born, Ghana-born, Democratic Republic of Congo-born, Sierra Leone-born and Liberia-born populations. These COBs combine for around 84% of the total Central and West Africa ROB population (Appendix D).
Males born in Australia, Ireland and New Zealand also recorded prostate cancer incidence over 125 cases per 100,000 males for 2006–2020, while rates for those born in Northern Europe, Northern America, the United Kingdom, Western Europe, and Southern and East Africa were over 105 cases per 100,000 males (Figure 4).
Prostate cancer incidence rates for populations born in mainland Asia regions were around half the Australian-born rates
Males born in Southern Asia, Chinese Asia, Japan and the Koreas and Mainland South-East Asia ROBs all recorded prostate cancer incidence rates less than half that of the equivalent rate for Australian-born males (62, 57, 45 and 44 cases per 100,000 males for the Asia-born ROBs respectively) (Figure 4). These were the lowest prostate cancer incidence rates by ROB for the 2006–2020 period.
For male populations born in the Middle East, South-Eastern Europe, Maritime South-East Asia, Southern Europe, North Africa, South America and Polynesia prostate cancer incidence rates ranged from 68 to 96 cases per 100,000 males (Figure 4).
Figure 4: Prostate cancer age-standardised incidence rates, by region of birth: males, Australia, 2006–2020
Notes:
- Rates are age-standardised to the WHO World Standard Population and expressed cases per 100,000 males.
- Includes regions of birth with on average 20,000 people living in Australia between 2006 and 2020 and 20 or more prostate cancer cases diagnosed for the period. Excludes the regions of Central Asia and Melanesia which are discussed separately in this section of this report.
- Born overseas includes born in any country except for Australia. All countries of birth rates are the national rates for Australia and includes the population born in Australia and all other countries.
Source: Australian Cancer Database 2020
The prostate cancer incidence for COBs broadly aligned with ROB findings but there were differences. As occurred with all cancers combined, Samoa-born prostate cancer incidence was much higher than Fiji-born for the Polynesia ROB (121 compared to 80 cases per 100,000 males).
The Maritime South-East Asia was the only Asian ROB which wasn’t in the lowest range of prostate cancer incidence rates. The four reportable COBs within this ROB of Indonesia, Philippines, Malaysia and Singapore all had prostate cancer incidence rates over 70 cases per 100,000 males (96, 87, 79 and 70 cases per 100,000 males) and higher than almost all other COBs from Asia. The Hong Kong-born population had prostate cancer incidence rates of 85 cases per 100,000 males and was the only other Asian COB with prostate cancer incidence rates above 70 cases per 100,000 males (Figure 5).
The European COBs with prostate cancer incidence rates below 70 cases per 100,000 males were limited to North Macedonia, Serbia and Montenegro, and Bosnia and Herzegovina (68, 53 and 52 cases per 100,000 males). All of these COBs were from South Eastern Europe but the other reportable COBs from this ROB ranged from 82 (Croatia) to 91 cases per 100,000 males (Cyprus) (Figure 5).
Figure 5: Prostate cancer age-standardised incidence rates, by country of birth: males, Australia, 2006–2020

Notes:
- Rates are age-standardised to the WHO World Standard Population and expressed cases per 100,000 males.
- Includes countries of birth with on average 20,000 people living in Australia between 2006 and 2020 and 20 or more prostate cancer cases diagnosed in males for the period.
- Born overseas includes born in any country except for Australia. All countries of birth rates are the national rates for Australia and includes the population born in Australia and all other countries.
Source: Australian Cancer Database 2020
Prostate cancer incidence rates for overseas-born populations in Australia can be much higher than those reported in the country of origin
In 2022, the estimated world age-standardised prostate cancer incidence rate for Cambodia was estimated at 5.2 cases per 100,000 males (IARC 2022). For the 2006–2020 period, the equivalent rate in Australia for males born in Cambodia was 32 cases per 100,000 males. The rate was one the lowest prostate cancer incidence rates by COB in Australia.
In Cambodia, prostate cancer was estimated to be the 9th most commonly diagnosed cancer for males in 2022 (IARC 2022) while in Australia for the Cambodia-born population it was the second most commonly diagnosed cancer for males in 2006–2020.
The difference in prostate cancer incidence rates between Cambodia and the Cambodia-born population living in Australia may be attributable to a variety of factors including the higher level of prostate cancer testing and diagnosis in Australia.
Australian prostate cancer incidence trends highlight how changes in detection practices can dramatically change prostate cancer incidence rates. For example, in 1987, the prostate cancer incidence rate in Australia was 53 cases per 100,000 males. Prostate specific antigen testing was introduced in Australia in 1987. By 1994, prostate cancer incidence rates reached 124 cases per 100,000 males. Given the potential for cancer detection to influence prostate cancer cases diagnosed, it is important to consider that international comparisons may also be strongly impacted by differences in prostate cancer detection capabilities and practices.
Breast cancer
Breast cancer is Australia’s most common cancer for females for all countries and regions of birth
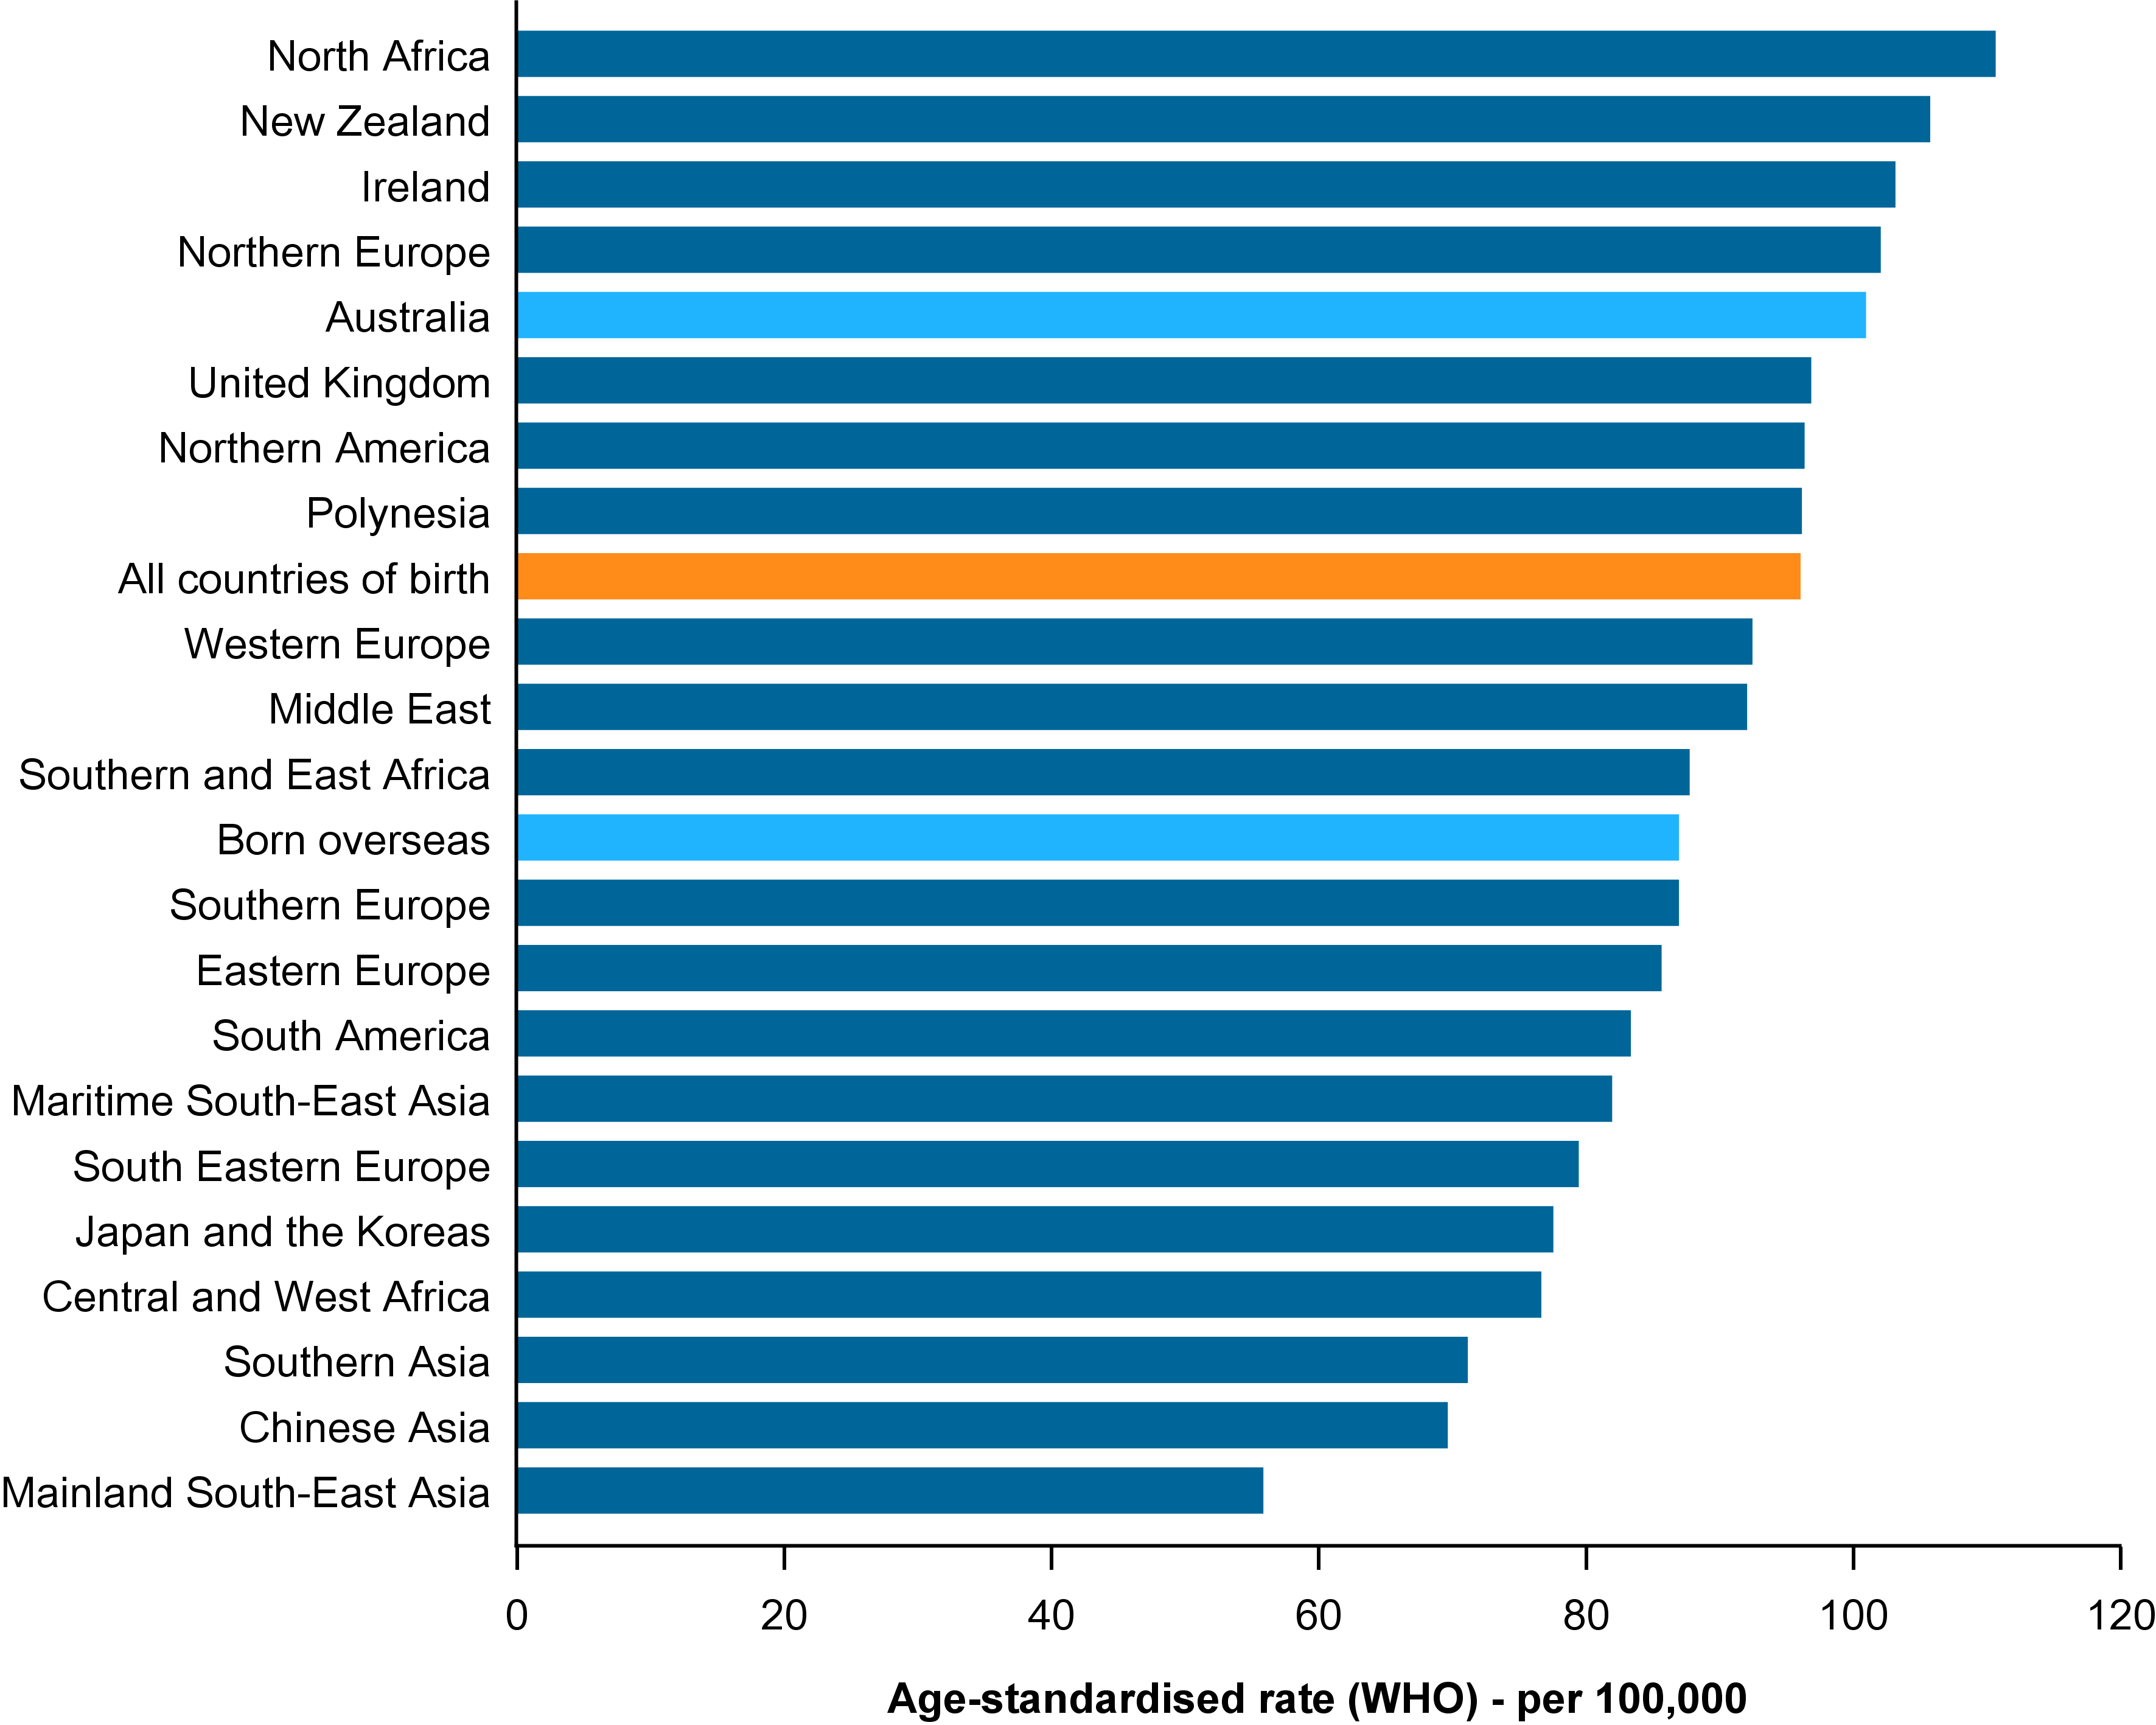
For the 2006–2020 period, breast cancer was the most commonly diagnosed cancer for females for all countries of birth (COBs) and regions of birth (ROBs). For Australia-born females, the rate of breast cancer was more than double that of colorectal cancer, the next most commonly diagnosed cancer (101 compared with 39 cases per 100,000 females). This was also the case for the overseas-born population but with lower incidence of both breast cancer and colorectal cancer (87 compared with 29 cases per 100,000 females).
The ROBs with breast cancer incidence above 100 cases per 100,000 females were North Africa, New Zealand, Ireland, Northern Europe and Australia (111, 106, 103, 102 and 101 cases per 100,000 females respectively) (Figure 6).
As with all cancers combined and prostate cancer incidence, breast cancer incidence rates for Asian ROBs were relatively low but the differences compared to other ROBs was not as great as for prostate cancer. Breast cancer incidence rates for Asian ROBs ranged between 56 cases per 100,000 females (Mainland South-East Asia) to 82 cases per 100,000 females (Maritime South-East Asia) (Figure 6).
South Eastern Europe-born females breast cancer incidence rates were around the same levels as the Maritime South-East Asia-born and Japan and the Koreas-born populations for 2006–2020 (79, 82 and 78 cases per 100,000 females respectively) (Figure 6).
Figure 6: Breast cancer age-standardised incidence rates, by region of birth: females, Australia, 2006–2020
Notes:
- Rates are age-standardised to the WHO World Standard Population and expressed cases per 100,000 females.
- Includes regions of birth with on average 20,000 people living in Australia between 2006 and 2020 and 20 or more breast cancer cases diagnosed in females for the period. Excludes the regions of Central Asia and Melanesia which are discussed separately in this section of this report.
- Born overseas includes born in any country except for Australia. All countries of birth rates are the national rates for Australia and includes the population born in Australia and all other countries.
Source: Australian Cancer Database 2020
Higher breast cancer incidence rates occurred across a wide range of regions of birth
Breast cancer incidence rates by COB ranged between 49 and 119 cases per 100,000 females (Figure 7).
The countries of birth (COBs) with breast cancer incidence rates over 100 cases per 100,000 females for 2006–2020 were Egypt (119), France (113), New Zealand (106), Scotland (104), Cyprus (104), Ireland (103), Sudan (103), Bangladesh (102), Papua New Guinea (102), Australia (101), Russian Federation (101) and Samoa (101) (Figure 7). These 12 COBs come from 11 different ROBs.
The incidence rates for North Africa were strongly influenced by the Egyptian-born population which represented around 57% of the female population born in the region and living in Australia in 2006–2020. The breast cancer incidence for Egypt was 119 cases per 100,000 females and in the highest tier of breast cancer rates for females in 2006–2020. The female Sudan-born population represented around 28% of the North Africa-born female population living in Australia and also had over 100 cases per 100,000 females (103 cases per 100,000 females).
Countries of birth with lower breast cancer incidence were predominantly within the continent of Asia
The COBs with breast cancer incidence rates at or below 60 cases per 100,000 females were the Republic of Korea (60), Bosnia and Herzegovina (58), Afghanistan (58), Vietnam (54), Myanmar (53) and Cambodia (49). Again, the lower COBs were predominantly from Asian COBs but it was more common for the Asian COBs to have rates similar to a wider range of COBs outside of Asia than all cancers combined or prostate cancer. It was however rare for Asian COBs to be amongst the higher rates (Figure 7).
Mainland South-East Asia COBs were most likely to be consistently within the lower range of breast cancer incidence with Thailand having the highest rate at 65 cases per 100,000 females for 2006–2020. The other reportable Mainland South-East Asia COBs of Vietnam, Myanmar and Cambodia breast cancer incidence rates were all below 55 cases per 100,000 females (Figure 7).
Figure 7 : Breast cancer age-standardised incidence rates, by country of birth: females, Australia, 2006–2020

Notes:
- Rates are age-standardised to the WHO World Standard Population and expressed cases per 100,000 females.
- Includes countries of birth with on average 20,000 people living in Australia between 2006 and 2020 and 20 or more breast cancer cases diagnosed in females for the period.
- Born overseas includes born in any country except for Australia. All countries of birth rates are the national rates for Australia and includes the population born in Australia and all other countries.
Source: Australian Cancer Database 2020
The Egypt-born population in Australia had higher breast cancer incidence than the population in Egypt
Females born in Egypt and France were the only populations with breast cancer incidence rates over 110 cases per 100,000 females in 2006–2020 (119 and 113 cases per 100,000 females respectively).
While France has one of the higher breast cancer incidence rates in the world (105 cases per 100,000 females in 2022 and noting this rate is for France metropolitan), Egypt does not. The breast cancer incidence rate for the Egypt-born population living in Australia between 2006–2020 was 119 cases per 100,000. This is more than double the rate reported by IARC for Egypt in 2022 (55 cases per 100,000).
The reason for the higher breast cancer incidence for people born in Egypt and living in Australia compared with that of Egypt cannot be determined from the data on hand. While the characteristics and risk behaviours of the Egypt-born population in Australia and the population Egypt may differ and contribute to the differing rates, differences in detection practices such as screening, may also have a role.
Melanoma of the skin
Data quality
For the 2006–2020 period, around 26% of records with a diagnosis of melanoma of the skin had the country of birth as ‘Not stated’. This possibly relates to access to skin cancer clinics, dermatologists and General Practitioners in Australia, all capable of performing a procedure generating a tissue sample for pathology, but not necessarily mandated to notify cancer depending on their State and Territory cancer registry policy directive or legislation. Therefore, many cancer notifications for melanoma of the skin will probably be from a pathology report, which often will not include country of birth (COB).
Due to the incompleteness of COB records for melanoma of the skin there is greater uncertainty regarding the precision of incidence rates by region of birth (ROB) and COB. However, melanoma of the skin incidence rates generally align with general understandings of melanoma of the skin, with higher rates occurring in populations that may generally be assumed to have higher proportions of people with fairer skin. People with fairer skin have increased risk of melanoma of the skin (Cancer Council 2022).
People born in Australia and New Zealand had the highest rates of melanoma of the skin
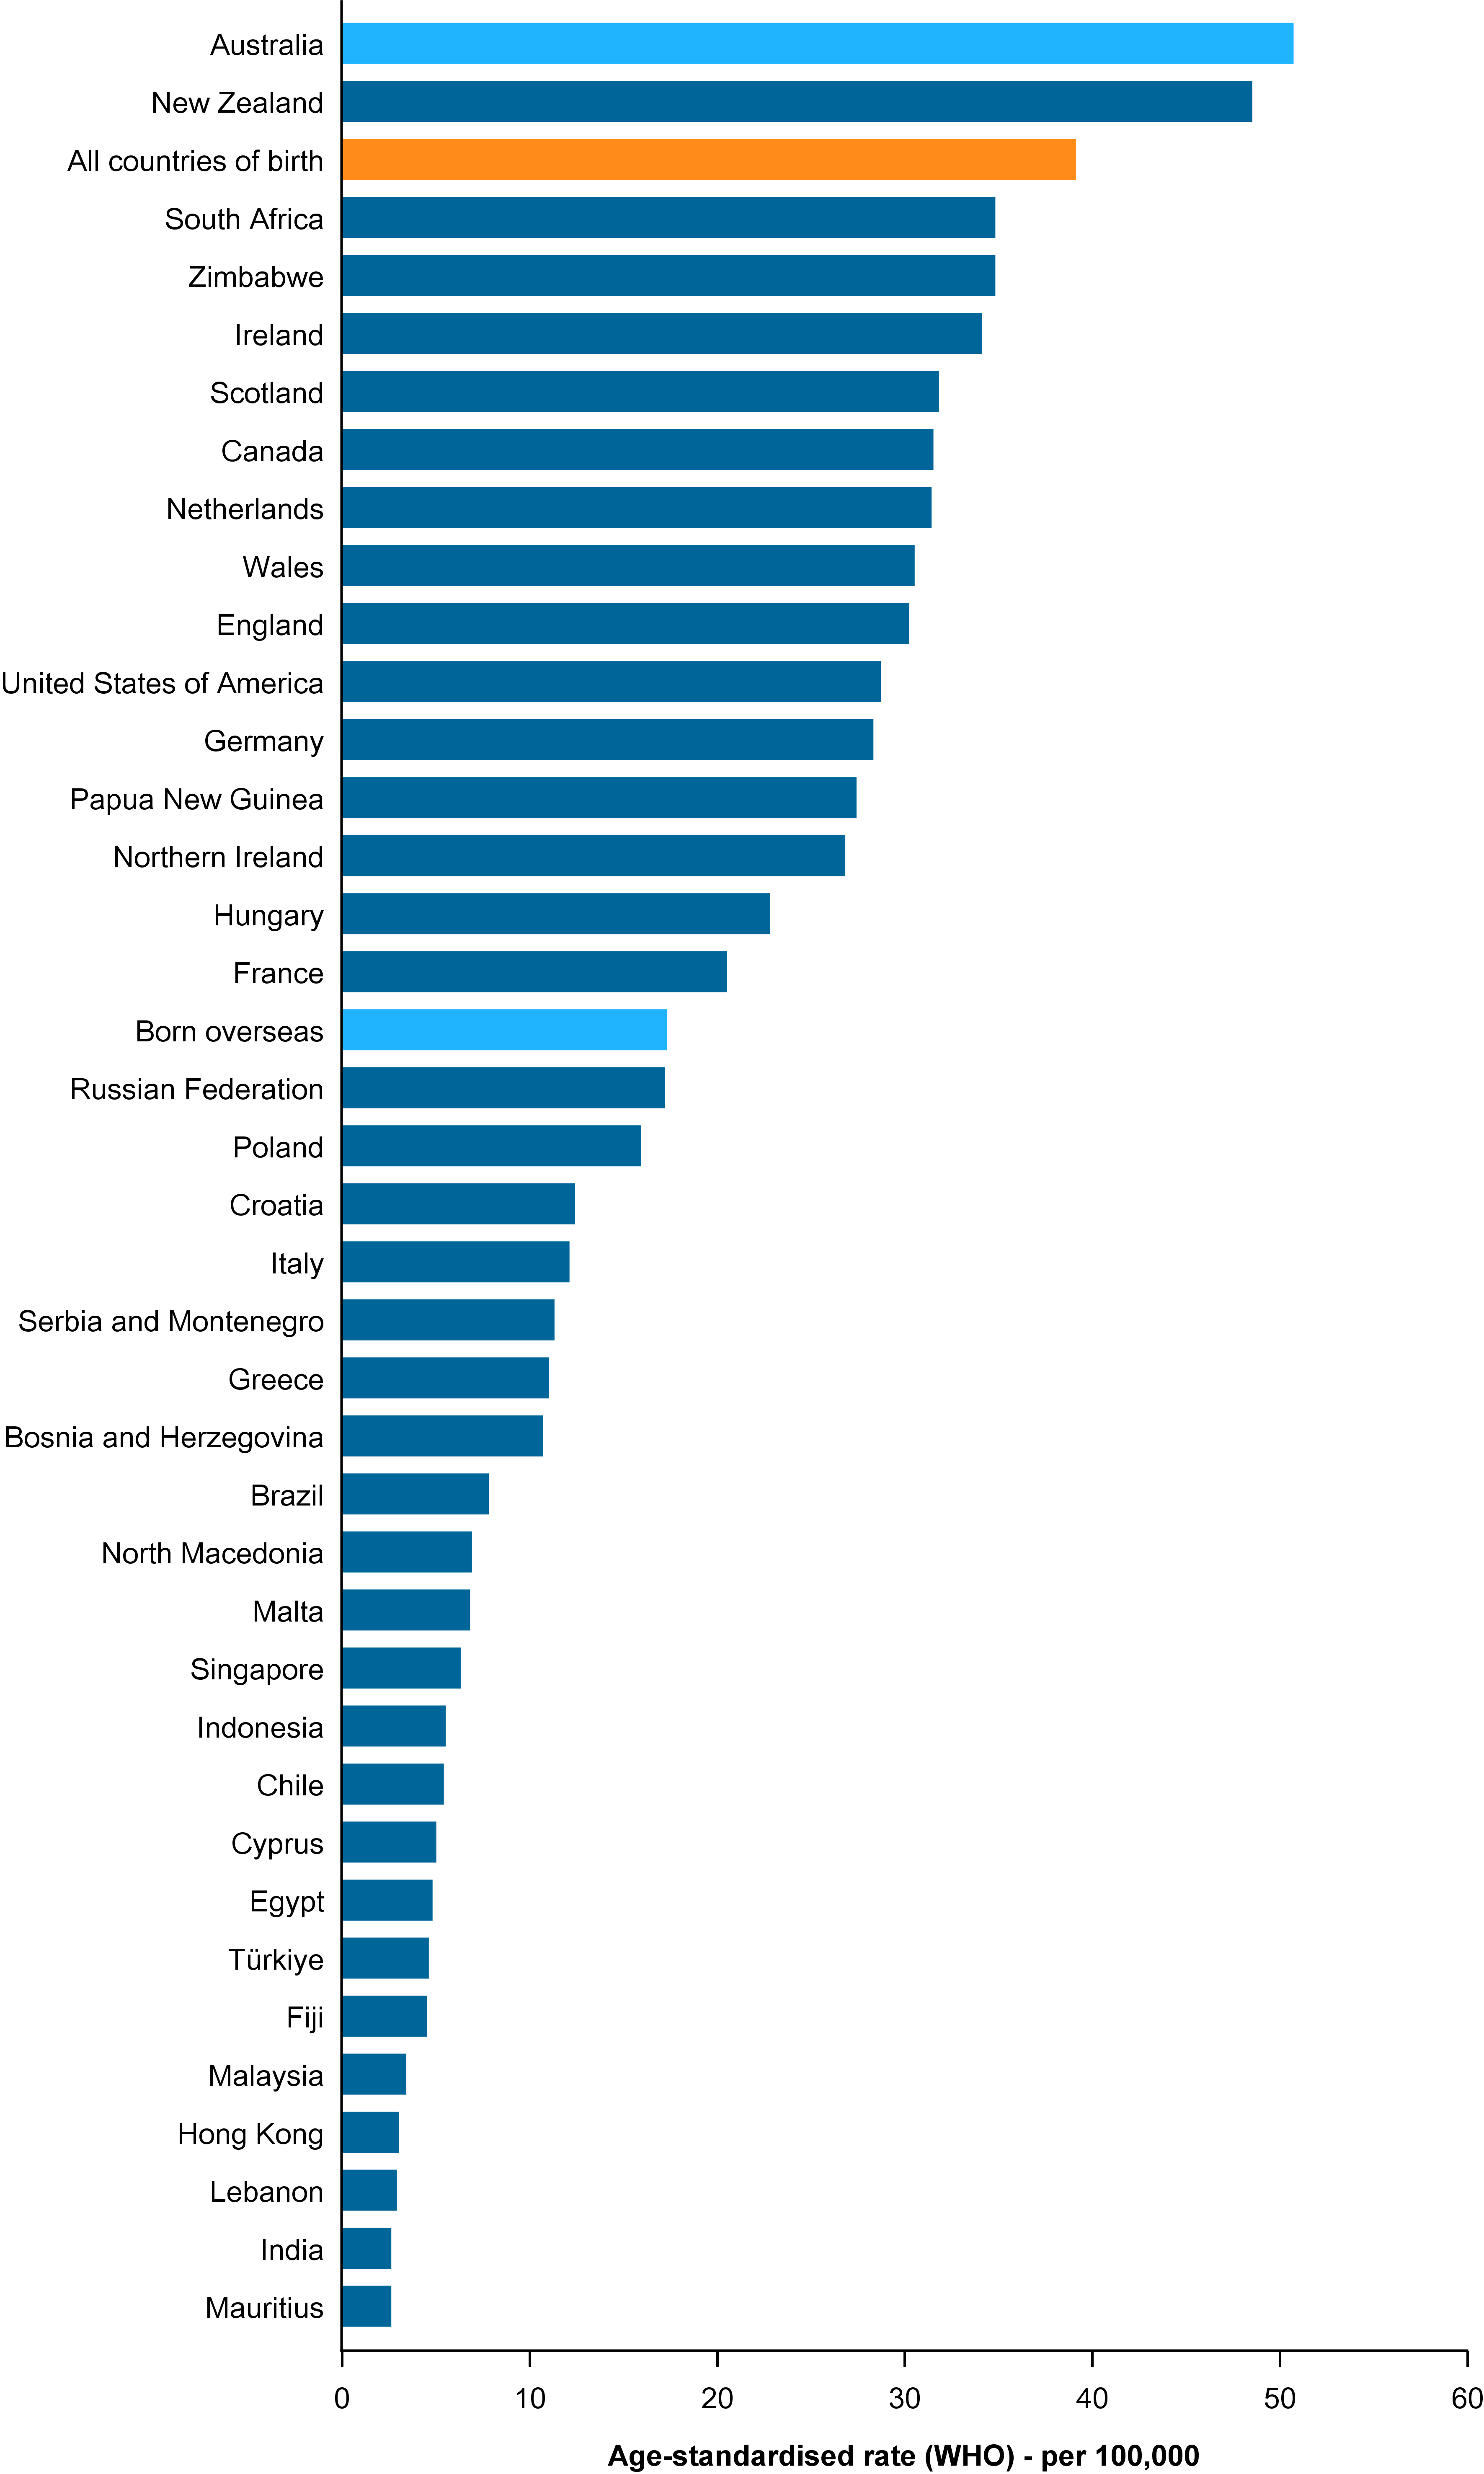
In 2006–2020, melanoma of the skin incidence rates by ROB ranged between 1.5 cases per 100,000 people (Japan and the Koreas) to 51 cases per 100,000 people (Australia). The only other ROB with melanoma of the skin incidence rates close to the Australia-born population was the New Zealand-born population (49 cases per 100,000 people) (Figure 8).
Ireland was amongst the regions of birth (ROBs) in the second highest tier of incidence at 34 cases per 100,000 people. In 2022, the melanoma of the skin incidence rate for Ireland (the country) was 18 cases per 100,000 people. The melanoma of the skin incidence rate for people born in Ireland and living in Australia for the 2006–2020 period is roughly double this rate.
The higher melanoma of the skin incidence rate for the Ireland-born population living in Australia compared with the incidence for Ireland may be due to various factors, including the higher risk environment in Australia. Exposure to ultraviolet UV radiation is the main risk for melanoma of the skin.
Like many cancers, skin cancer has a long latency period, and overexposure during childhood and adolescence increases the risk of developing skin cancer at a later age. In general, the Australia-born population will have spent most of their life in a high UV environment. For many people born in other countries, earlier years of life may be spent in countries where UV is not as high as the Australian environment.
Many different regions of birth had melanoma of the skin rates less than one tenth of those born in Australia
Outside of the ROBs of Australia and New Zealand, the ROBs with higher melanoma of the skin incidence rates were European and North American countries with the general tendency of decreasing incidence in Europe as the ROB moves east and south (Figure 8).
Asian ROBs had the lowest incidence rates of melanoma of the skin for the 2006–2020 period. North Africa, Polynesia, Middle East, Maritime South-East Asia, Southern Asia and Japan and the Koreas all had melanoma of the skin incidence rates below 5 cases per 100,000 people (Figure 8). Melanoma of the skin was not in the leading 20 cancers for all people born in Chinese Asia (that is, persons) for 2006–2020 and so rates are not presented for persons, but the rates for males and females were in the leading 20 cancers by sex and were 2.2 cases per 100,000 males and 1.6 cases per 100,000 females respectively. Similarly, melanoma of the skin was not in the leading 20 cancers for Mainland South-East Asia.
Figure 8: Melanoma of the skin age-standardised incidence rates, by region of birth: persons, Australia, 2006–2020

Notes:
- Rates are age-standardised to the WHO World Standard Population and expressed cases per 100,000 persons.
- Includes regions of birth with on average 20,000 people living in Australia between 2006 and 2020 and 20 or more melanoma of the skin cases diagnosed in the period. Excludes the regions of Central Asia and Melanesia which are discussed separately in this section of this report. Also excludes regions of birth where melanoma of the skin was not in the leading 20 cancers for the period.
- Born overseas includes born in any country except for Australia. All countries of birth rates are the national rates for Australia and includes the population born in Australia and all other countries.
Source: Australian Cancer Database 2020
People born in Zimbabwe and South Africa were among the countries of birth with higher incidence of melanoma of the skin
Melanoma of the skin COB aligns with the ROB findings. Asia, the Middle East, and North Africa were ROBs with lower melanoma of the skin incidence in 2006–2020. The highest incidence rates for a COB within each of these regions of birth (ROBs) were respectively 6.3 cases per 100,000 people for Singapore-born people, 4.6 cases per 100,000 people for Türkiye-born people and 4.9 cases per 100,000 people for Sudan-born people. All well below the Australia-born rate of 51 cases per 100,000 people.
For 2006–2020, there were several COBs where melanoma of the skin rate was so comparatively low that they were not in the leading 20 cancers for the COBs and therefore not included in this report (COBs include China, the Republic of Korea, the Philippines, Myanmar, Thailand, Vietnam, Cambodia, Iran, Iraq, Samoa, Sri Lanka and Bangladesh).
Behind Australia and New Zealand, in 2006–2020, the Zimbabwe-born and South Africa born people were amongst the COBs with higher melanoma of the skin incidence (35 cases per 100,000 people for each) (Figure 9). These relatively high rates are do not occur in the countries themselves.
In 2022, the melanoma of the skin incidence rate of the country of Zimbabwe was estimated to be 2.2 cases per 100,000 people while the rate for the country of South Africa was estimated at 4.1 cases per 100,000 people (IARC 2022). The melanoma of the skin rate for the country of Mauritius in 2022 was estimated to be 0.2 cases per 100,000 people and more similar to the Mauritian-born population living in Australia (2.6 cases per 100,000 people for 2006–2020) than their Southern East Africa ROB counterparts.
Figure 9: Melanoma of the skin age-standardised incidence rates, by country of birth: persons, Australia, 2006–2020
Notes:
- Rates are age-standardised to the WHO World Standard Population and expressed cases per 100,000 persons.
- Includes countries of birth with on average 20,000 people living in Australia between 2006 and 2020 and 20 or more melanoma of the skin cases diagnosed for period. Excludes regions of birth where melanoma of the skin was not in the leading 20 cancers for the period.
- Born overseas includes born in any country except for Australia. All countries of birth rates are the national rates for Australia and includes the population born in Australia and all other countries.
Source: Australian Cancer Database 2020
Colorectal cancer
New Zealand, Australia and Ireland regions of birth had the highest colorectal cancer incidence rates
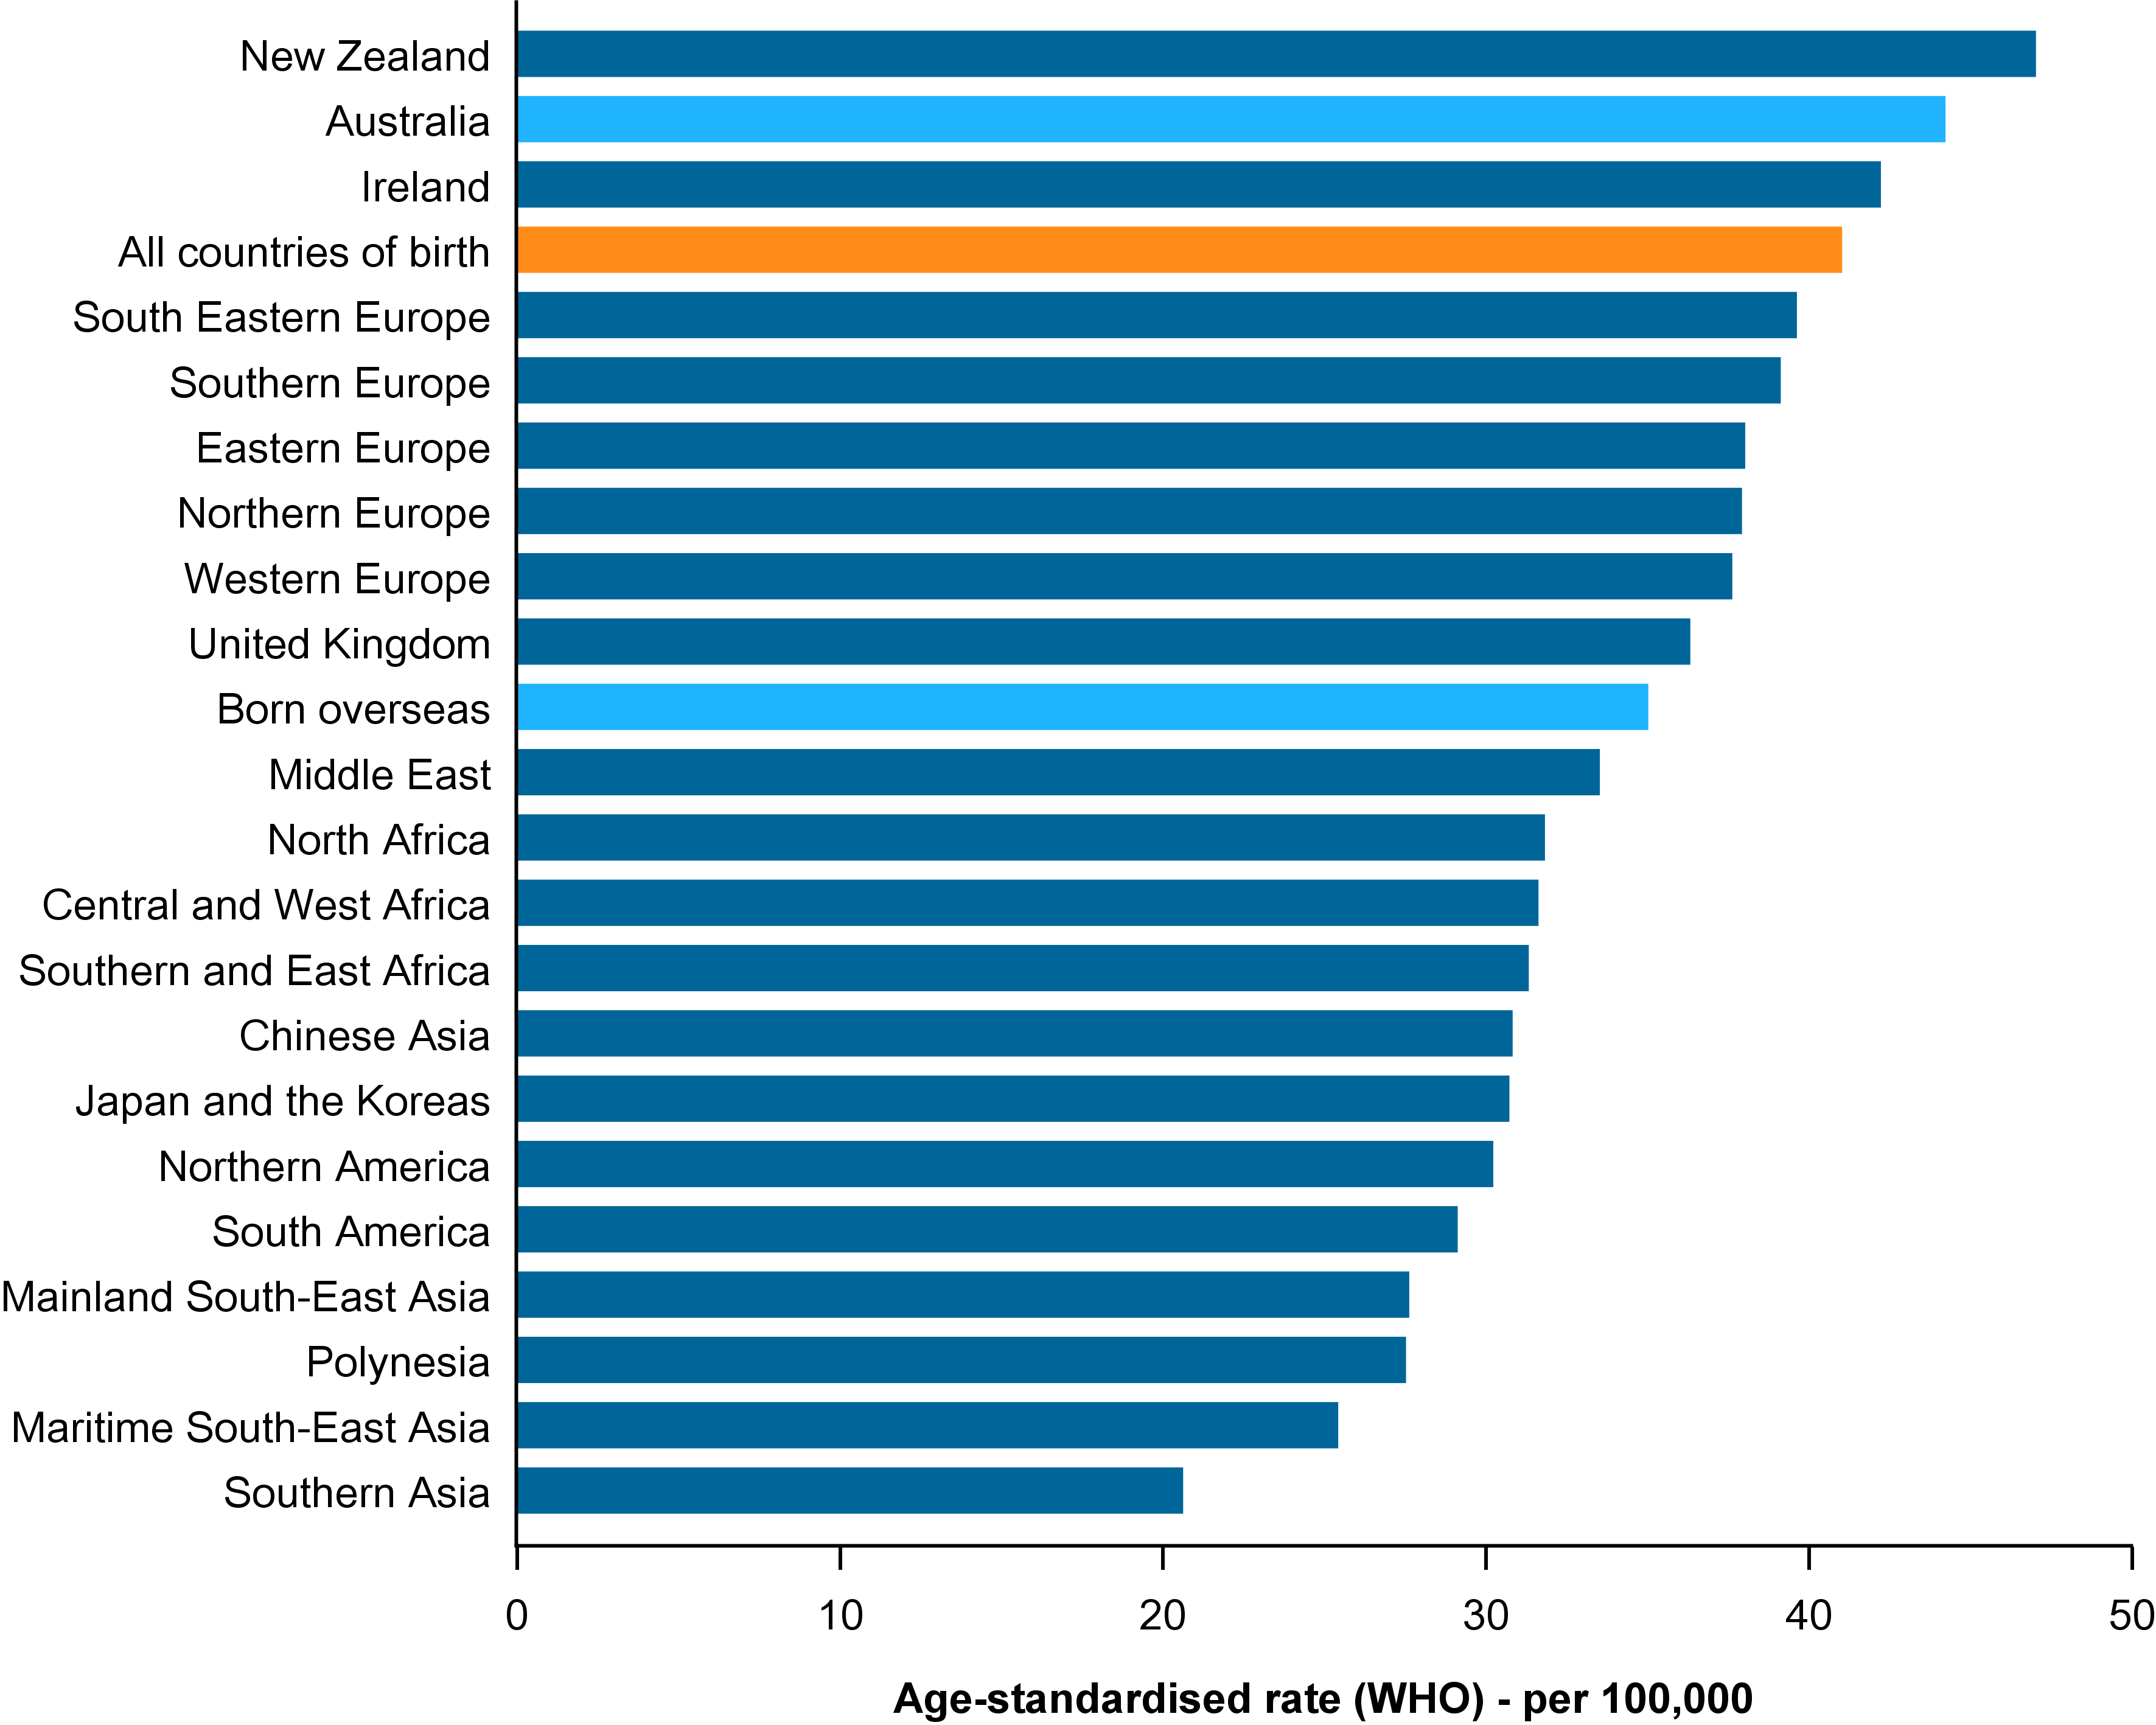
The Australia-born colorectal cancer incidence rate for 2006–2020 was 44 cases per 100,000 people compared with the overseas-born colorectal cancer incidence rate of 35 cases per 100,000 people.
In 2006–2020, Australia, New Zealand, and Ireland were the only ROBs with colorectal cancer incidence rates of over 42 cases per 100,000 people. European ROBs, followed with rates between 36 and 40 cases per 100,000 people (Figure 10).
The lowest colorectal cancer incidence ROBs for 2006–2020 were Southern Asia, Maritime South-East Asia, Polynesia and Mainland South-East Asia. For these ROBs, colorectal cancer incidence ranged from 21 cases per 100,000 people to 28 cases per 100,000 people).
Figure 10: Colorectal cancer age-standardised incidence rates, by region of birth: persons, Australia, 2006–2020
Notes:
- Rates are age-standardised to the WHO World Standard Population and expressed cases per 100,000 persons.
- Includes regions of birth with on average 20,000 people living in Australia between 2006 and 2020 and 20 or more colorectal cancer cases diagnosed in the period. Excludes the regions of Central Asia and Melanesia which are discussed separately in this section of this report.
- Born overseas includes born in any country except for Australia. All countries of birth rates are the national rates for Australia and includes the population born in Australia and all other countries.
Source: Australian Cancer Database 2020
Scotland, Croatia and North Macedonia were COBs with relatively high colorectal cancer incidence rates
In addition to Australia, New Zealand and Ireland, the countries of birth (COBs) of Scotland, Croatia and North Macedonia were COBs with colorectal cancer incidence rates of 42 cases per 100,000 people or more.
The trend of Australia-born, New Zealand-born and Europe-born people generally having higher colorectal cancer incidence rates is also evident by COB. In 2006–2020, Samoa-born, Japan-born, and Lebanon-born colorectal cancer incidence rates were the only COBs outside of Europe, Australia and New Zealand to have colorectal cancer incidence rates over 36 cases per 100,000 people (Figure 11).
The countries of birth within Southern Asia had low colorectal cancer incidence rates
People born in Sri Lanka, Bangladesh, Afghanistan and Nepal all had colorectal cancer incidence rates below 20 cases per 100,000 people in 2006–2020. All of these except Afghanistan were part of the Southern Asia ROB. The other COBs within the Southern Asia ROB of India and Pakistan also had relatively low colorectal cancer incidence rates (21 and 24 cases per 100,000 people respectively).
The disparity often apparent within the Polynesia ROB incidence is also apparent for colorectal cancer. The Fiji-born colorectal cancer incidence rate was 22 cases per 100,000 people while Samoa-born rates were 38 cases per 100,000 people and similar to the European ROB rates.
The reportable COBs within Mainland South-East Asia were Cambodia, Thailand, Myanmar, and Vietnam. The colorectal cancer incidence rates for Myanmar-born, Cambodia-born, and Vietnam-born people in 2006–2020 were 24, 25 and 28 cases respectively per 100,000 people while Thailand’s incidence rate was 31 cases per 100,000 people in 2006–2020. These rates are below the high Australia-born rate but generally around double the 2022 rates estimated by IARC for the general population living in the respective countries (Myanmar (9.9 cases per 100,000 people), Cambodia (13 cases per 100,000 people), Vietnam (14) and Thailand (16)).
Figure 11: Colorectal cancer age-standardised incidence rates, by country of birth: persons, Australia, 2006–2020
Notes:
- Rates are age-standardised to the WHO World Standard Population and expressed cases per 100,000 persons.
- Includes countries of birth with on average 20,000 people living in Australia between 2006 and 2020 and 20 or more colorectal cancer cases diagnosed for the period.
- Born overseas includes born in any country except for Australia. All countries of birth rates are the national rates for Australia and includes the population born in Australia and all other countries.
Source: Australian Cancer Database 2020
Lung cancer
Australian lung cancer incidence rates and trends differ substantially by sex (Australian lung cancer incidence trends can be viewed in the Cancer summary data visualisation). Country of birth (COB) and region of Birth (ROB) comparisons for lung cancer may be more impacted by the composition of the COB/ROB by sex than most cancers. To encourage better comparisons countries of birth (COBs) comparisons and regions of birth (ROBs) comparisons, lung cancer incidence is discussed for males and females separately and does not focus on persons.
Tobacco smoking is linked to around 90% of the lung cancer cases in men and 65% of the cases in women in Australia (Cancer Council 2023). Australian smoking rates by ROB and COB may differ from the country of origin, differ by COB within Australia as well as change over time.
Lung cancer (males)
Southern European and the Middle East regions of birth had the highest lung cancer incidence for males
The national lung cancer incidence rate for Australia in the period 2006–2020 was around 37 cases per 100,000 males and was the same for both the Australia-born and overseas-born male populations. Lung cancer incidence rates for males ranged between 17 cases per 100,000 males for those born in Southern Asia to 46 cases per 100,000 males for those born in South Eastern Europe (Figure 12).
European ROBs (except Ireland) and the Middle East ROB had lung cancer rates above 38 cases per 100,000 males. Southern and East Africa-born, Central and West Africa-born and Southern Asia-born were the only ROBs with lung cancer incidence rates below 22 cases per 100,000 males.
Figure 12: Lung cancer age-standardised incidence rates, by region of birth: males, Australia, 2006–2020

Notes:
- Rates are age-standardised to the WHO World Standard Population and expressed cases per 100,000 males
- Includes regions of birth with on average 20,000 people living in Australia between 2006 and 2020 and 20 or more lung cancer cases diagnosed in males for the period. Excludes the regions of Central Asia and Melanesia which are discussed separately in this section of this report.
- Born overseas includes born in any country except for Australia. All countries of birth rates are the national rates for Australia and includes the population born in Australia and all other countries.
Source: Australian Cancer Database 2020
Lung cancer incidence rates for the countries within a region of birth can vary considerably
The ROB lung cancer incidence rates for males were often comprised of quite different COB incidence rates. For example, as a ROB, Middle East-born males were in the higher range of lung cancer incidence (42 cases per 100,000 males in 2006–2020). Lung cancer incidence rates ranged by COB within this ROB from 19 to 54 cases per 100,000 males. Türkiye-born males had very high rates at 54 cases per 100,000 males, Lebanon-born males were also among those with higher incidence with 46 cases per 100,000 males, Iraq-born with 40 cases per 100,000 was closer to the Australian national rate of 37 cases per 100,000 males and Iran-born had a relatively low rate of 19 cases per 100,000 males.
The lung cancer incidence for males born in the United Kingdom was also quite disparate. The United Kingdom-born lung cancer incidence rate was 39 cases per 100,000 males. The highest lung cancer incidence rate for a COB within the United Kingdom ROB was Scotland with 58 cases per 100,000 males while the lowest was England with 36 cases per 100,000 males. Northern Ireland was another COB from this ROB with a rate above 50 cases per 100,000 males (51 cases per 100,000) while Wales-born people had a lung cancer incidence rate of 40 cases per 100,000 males.
The Fiji-born male lung cancer incidence rate was 16 cases per 100,000 males in 2006–2020. In comparison, Samoa-born lung cancer incidence rates for males were 43 cases per 100,000 people. The lung cancer incidence rate for males born in Polynesia for 2006–2020 was 28 cases per 100,000 males and is another instance where the overall Polynesia-born incidence rate is not particularly representative of all the individual COBs within the ROB.
Males born in Scotland, Türkiye and Bosnia and Herzegovina, Northern Ireland, Greece and France had the highest rates of lung cancer
Lung cancer incidence rates by COB ranged from a low of 12 cases per 100,000 males for the Zimbabwe-born male population up to almost 5 times this rate for Scotland-born males (58 cases per 100,000 males) (Figure 13).
Lung cancer incidence rates for males were highest for those born in Scotland, Türkiye, Bosnia and Herzegovina, Northern Ireland, France and Greece. Each of these COBs had lung cancer incidence rates around 50 cases per 100,000 males or more.
Table 5 lists ten countries with the highest lung cancer incidence rates in the world for males in 2022 and the comparison with the population born in those countries who were living in Australia. Often and to varying degrees, the countries with the highest lung cancer incidence also see their respective populations living in Australia with higher lung cancer incidence rates than most other COBs within Australia. Note that the rates of Scotland and Northern Ireland are not included within the lung cancer incidence rates in IARC’s 2022.
Country | Country (2022) | Country of birth and living in Australia (2006–2020) Age-standardised rate (cases per 100,000 males) |
|---|---|---|
Türkiye | 68.0 | 54.3 |
Hungary | 64.4 | 46.7 |
Serbia | 59.6 | 46.0* |
Bosnia and Herzegovina | 59.5 | 53.1 |
New Caledonia | 59.3 | n.p. |
Montenegro | 58.8 | 46.0* |
Armenia | 57.4 | n.p. |
French Polynesia | 57.4 | n.p. |
Belarus | 56.5 | n.p. |
Croatia | 56.4 | 40.7 |
All countries | 32.1 | 37.0 |
Sources: Australian Cancer Database 2020 and Cancer Today International Agency for Research on Cancer 2022
Notes:
- Rates are age-standardised to the WHO World Standard Population and expressed per 100,000 males
- Rates not published (n.p.) for populations with less than 20,000 people, on average, living in Australia between 2006 and 2020.
Males born in Pakistan, Sri Lanka and Zimbabwe had low lung cancer rates
Iran, Malaysia, India, Fiji, Afghanistan, Pakistan, Sri Lanka and Zimbabwe COBs had lung cancer incidence rates at or below 20 cases per 100,000 males for the 2006–2020 period (19, 19, 18, 16, 16, 15, 14, 12 cases per 100,000 males respectively). The lung cancer incidence rates in 2022 for the country in which these people were born were all below the world rate of 32 cases per 100,000 people (estimated 17, 23, 8.5, 9.1, 11, 9.5, 11 and 9.2 cases per 100,000 males).
Figure 13: Lung cancer age-standardised incidence rates, by country of birth: males, Australia, 2006–2020

Notes:
- Rates are age-standardised to the WHO World Standard Population and expressed cases per 100,000 males.
- Includes countries of birth with on average 20,000 people living in Australia between 2006 and 2020 and 20 or more lung cancer cases diagnosed in males for the period.
- Born overseas includes born in any country except for Australia. All countries of birth rates are the national rates for Australia and includes the population born in Australia and all other countries.
Source: Australian Cancer Database 2020
Lung cancer (females)
Lung cancer incidence rates for females are generally lower than males, and incidence trends by COB and ROB can be very different to males.
The 2006–2020 national lung cancer incidence rate for females in Australia was 25 cases per 100,000 females. The rate for Australia-born females was 26 cases per 100,000 females and for overseas-born females it was 22 cases per 100,000 females.
Females born in New Zealand, Northern Europe, Ireland and the United Kingdom had relatively high rates of lung cancer
New Zealand-born females were one of three ROBs with lung cancer incidence above 30 cases per 100,000 females (34 cases per 100,000 females). New-Zealand born male lung cancer incidence rates were 37 cases per 100,000 males. The closeness of rates between the male and female populations living in Australia is not apparent within New Zealand itself. In 2022, the estimated lung cancer incidence rate within New Zealand for males was 33 cases per 100,000 males while the rate for females was 22 cases per 100,000 females (IARC 2022).
The other ROBs with lung cancer incidence above 30 cases per 100,000 females were Ireland and Northern Europe. The United Kingdom-born female population also had relatively high lung cancer incidence rates (29 cases per 100,000 females) (Figure 14).
Populations from four different continents had the lowest lung cancer incidence rates for females
Females born in North Africa, Southern Europe, South America and Southern Asia had the lowest lung cancer incidence in 2006–2020 (15, 14, 13 and 11 cases per 100,000 females respectively) (Figure 14).
Figure 14: Lung cancer age-standardised incidence rates, by region of birth: females, Australia, 2006–2020
Notes:
- Rates are age-standardised to the WHO World Standard Population and expressed cases per 100,000 females
- Includes regions of birth with on average 20,000 people living in Australia between 2006 and 2020 and 20 or more lung cancer cases diagnosed in females for the period. Excludes the regions of Central Asia and Melanesia which are discussed separately in this section of this report.
- Born overseas includes born in any country except for Australia. All countries of birth rates are the national rates for Australia and includes the population born in Australia and all other countries.
Source: Australian Cancer Database 2020
Females born in the Middle East, Southern Europe and South Eastern Europe have much lower rates of lung cancer than their male counterparts
For 2006–2020, lung cancer incidence for females born in the Middle East was 15 cases per 100,000 females and lower than the overseas-born rate of 22 cases per 100,000 females while for males it was one of the highest at nearly 3 times this rate (42 cases per 100,000 males).
Similar to the Middle East ROB, males born in Southern Europe and South Eastern Europe were in the higher lung cancer incidence rate ranges but females were towards the lower rate range (14 and 16 cases per 100,000 females respectively) (Figure 15).
Females born in Scotland and Samoa were the COBs with the highest rates of lung cancer
Similar to males, females born in Scotland had a high rate of lung cancer at 43 cases per 100,000 females (Figure 15). Females born in Samoa also had a relatively high rate of lung cancer (39 cases per 100,000 females) though this is based on a much smaller number of cases (100). New Zealand-born, Northern Ireland-born, Ireland-born, Wales-born and Hungary-born females also had incidence rates above 30 cases per 100,000 females were (Figure 15).
India, Pakistan and Sri Lanka countries of birth had lung cancer incidence rates less than half the Australian rate for both sexes
Females born in Iraq, Greece, Italy, Pakistan, Chile, India, Iran, Mauritius, Sudan and Sri Lanka had lung cancer incidence rates that were less than half the Australia-born rate (rates ranged from 12.5 cases per 100,000 females (Iraq) to 7.6 cases per 100,000 females (Sri Lanka)). For these COBs, males born in India, Pakistan and Sri Lanka also had lung cancer incidence rates that were less than half that of the Australia-born rate of 37 cases per 100,000 males) (Figure 15).
Figure 15: Lung cancer age-standardised incidence rates, by country of birth: females, Australia, 2006–2020

Notes:
- Rates are age-standardised to the WHO World Standard Population and expressed cases per 100,000 females.
- Includes countries of birth with on average 20,000 people living in Australia between 2006 and 2020 and 20 or more lung cancer cases diagnosed in females for the period.
- Born overseas includes born in any country except for Australia. All countries of birth rates are the national rates for Australia and includes the population born in Australia and all other countries.
Source: Australian Cancer Database 2020