Injury in Australia:
Transport accidents
Web article
Last updated:
Topic: Injury
Citation
AIHW (Australian Institute of Health and Welfare) (2026) Transport accidents, AIHW, Australian Government, accessed 27 July 2026.
This article is part of Injury in Australia
Unintentional causes
Intentional causes
-

People aged 15–24 (392.5 hospitalisations per 100,000), and 65 and over (9.0 deaths per 100,000)
Definitions
This article describes unintentional transport injuries resulting in hospitalisation or death. Intentional injuries are included under Self-harm injuries and suicide or Assault and homicide.
ICD-10-AM defines the following:
- A transport accident (V00–V99) is any accident involving a device designed primarily for, or being used at the time primarily for, conveying persons or goods from one place to another.
- A public highway [trafficway] or street is the entire width between property lines (or other boundary lines) of land open to the public as a matter of right or custom for purposes of moving persons or property from one place to another. A roadway is that part of the public highway designed, improved and customarily used for vehicular traffic.
- A traffic accident is any vehicle accident occurring on the public highway [that is, originating on, terminating on, or involving a vehicle partially on the highway]. A vehicle accident is assumed to have occurred on the public highway unless another place is specified, except in the case of accidents involving only off-road motor vehicles, which are classified as non-traffic accidents unless the contrary is stated.
- A non-traffic accident is any vehicle accident that occurs entirely in any place other than a public highway.
- Where a transport accident involves a vehicle in motion, and results in a subsequent collision, the accident is classified as a collision. If an accident other than a collision resulted, it is classified as a non-collision accident according to the vehicle type involved. This includes, for example, breakage of any part of vehicle, and falls, jumps or being accidentally pushed from vehicles.
ICD-10-AM excludes accidents involving vehicles but unrelated to the hazards associated with the means of transportation from the transport external cause category, for example, injuries sustained during maintenance of vehicles not in motion, assault or self-harm by crashing vehicle, and vehicles involved in cataclysms.
External causes of injury are not currently able to be ascertained reliably from emergency department data. For more detail, please see the Injury in Australia technical notes.
Injuries by type of transport
In 2024–25, most transport-related injury hospitalisations involved cars, motorcycles and pedal cycles, largely because cars are widely used (Figure 1). According to the 2021 Census (ABS 2022), cars were the main mode of commuting, and passenger vehicles accounted for over two-thirds of kilometres travelled in 2019–20 (ABS 2020).
Figure 1: Transport-related injury hospitalisations, by type of transport, 2024–25
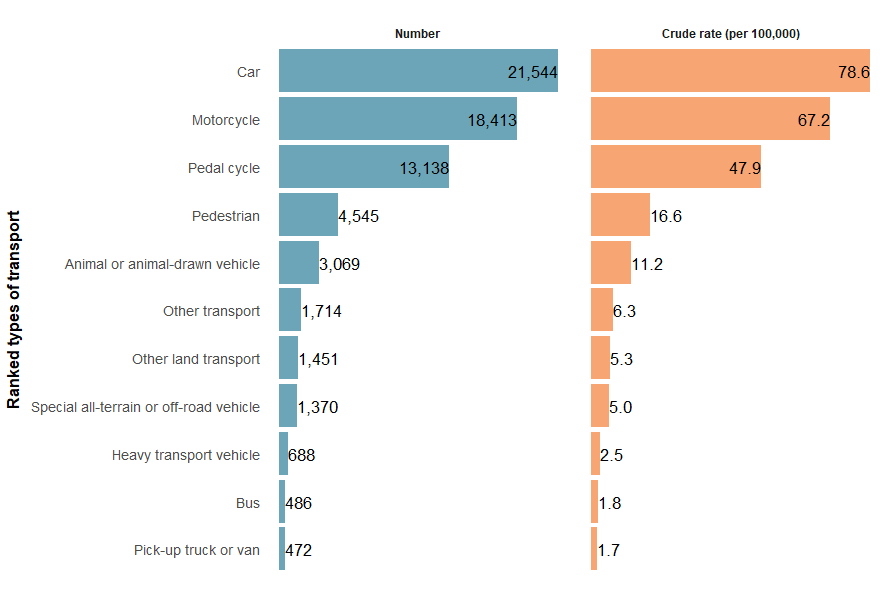
Sources: AIHW National Hospital Morbidity Database and ABS National, state and territory population.
In 2023–24, most transport-related deaths involved car occupants, motorcyclists and pedestrians (Figure 2).
Figure 2: Transport-related injury deaths, by type of transport, 2023–24
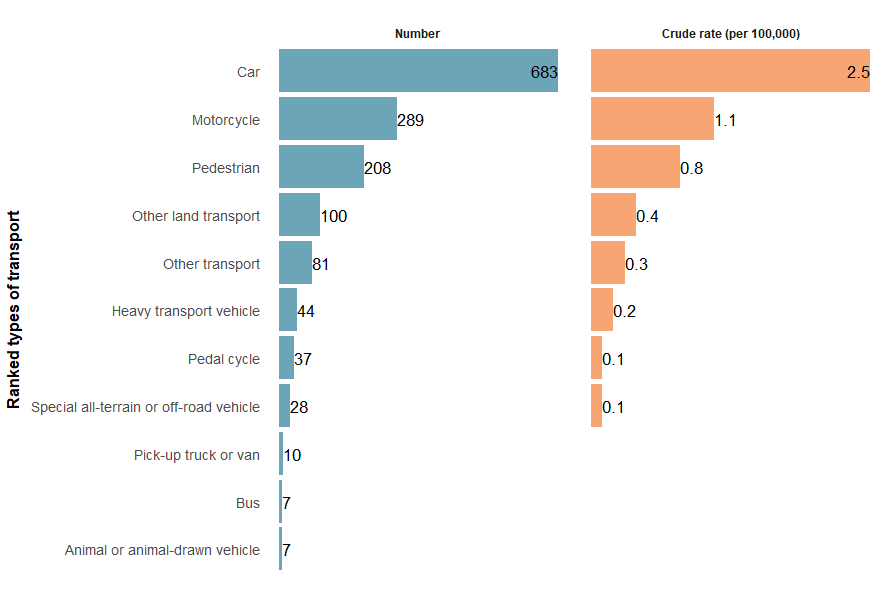
Note: Crude rates where the numerator is less than 10 are not shown due to data volatility.
Sources: AIHW National Mortality Database and ABS National, state and territory population.
For more detail, see Supplementary data tables (Transport Tables 1 and 8).
Collision vs non-collision traffic injury hospitalisations
In 2024–25, 61.2% of transport-related injury hospitalisations were due to collisions, with 29.2% involving a car, pick-up truck or van and 11.6% involving a fixed or stationary object. In addition, 12.2% were classified as other and unspecified transport accidents.
For more detail, see the Department of Infrastructure, Transport, Regional Development, Communications and the Arts data dashboard.
Trends over time
There is a break in the time series for hospitalisations between 2016–17 and 2017–18 due to a change in data collection methods (see the technical notes for details).
Over the past decade, the rate of transport-related injury hospitalisations has gradually decreased, from 255.9 in 2015–16 to 244.1 per 100,000 in 2024–25 (Figure 3). The hospitalisation rate in 2024–25 was 0.3% lower than the previous 5-year average of 244.9 per 100,000 population.
Figure 3: Transport-related injury hospitalisations, 2015–16 to 2024–25
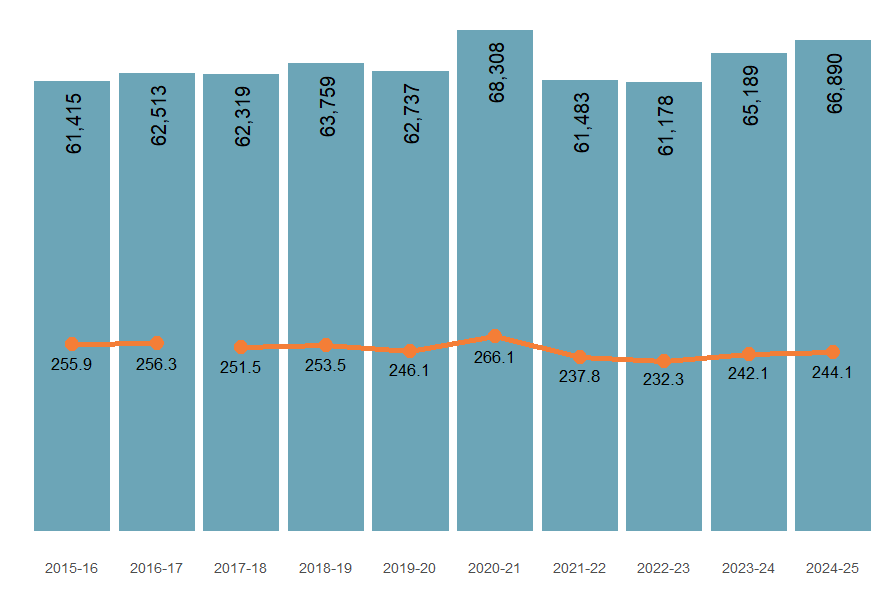
Note: Columns represent the number of hospitalisations, the line graph represents the crude rate per 100,000 population.
Sources: AIHW National Hospital Morbidity Database and ABS National, state and territory population.
The number of transport-related injury deaths has generally increased over time. In 2023–24, the rate was 0.4% higher than the previous 5-year average rate of 5.6 per 100,000 population (Figure 4).
Figure 4: Transport-related injury deaths, 2014–15 to 2023–24
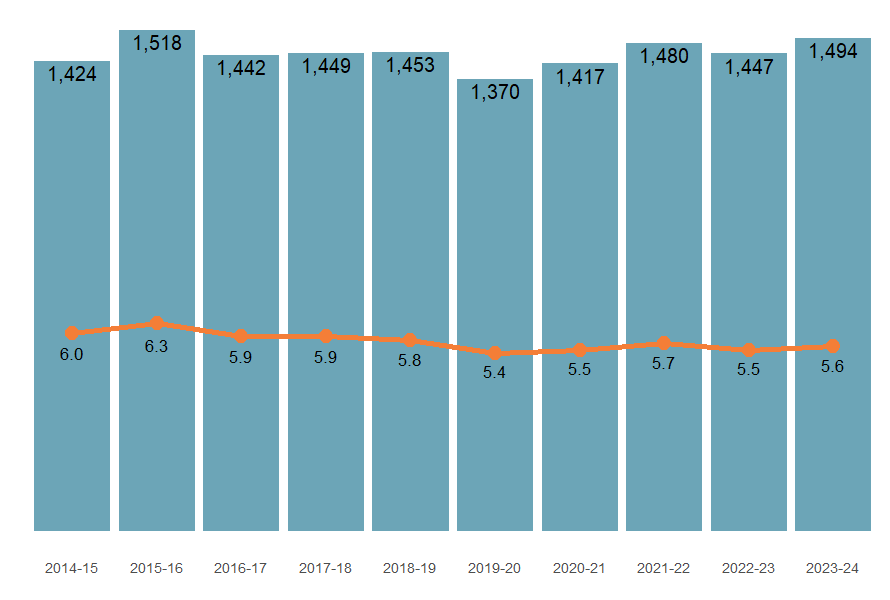
Note: Columns are number of deaths, the line graph represents crude rate per 100,000 population.
Sources: AIHW National Mortality Database and ABS National, state and territory population.
The trends differed depending on the type of transport. Compared to the previous 5-year average, in 2024–25 hospitalisation rates involving:
- pedestrians increased by 13.5%
- pedal cycles decreased by 12.9% (Figure 5).
For injury deaths involving cars, rates have decreased by 10.7% compared to the previous 5-year average (Figure 5).
Figure 5: Transport-related injury hospitalisations (2015–16 to 2024–25) and deaths (2014–15 to 2023–24), by type of transport and type of accident
Crude rates of hospitalisation and death among the top four transport types. Rates have generally decreased or remained stable.
Figure 6: Transport-related injury hospitalisations (2024–25) and deaths (2023–24), by transport type and calendar month
An interactive tableau visualisation showing the number of injury hospitalisations and deaths by month for the most recent financial year, and the previous 5-year average. Users can toggle the type of transport.
Figure 7: Transport-related injury hospitalisations by main body part injured, 2024–25
An interactive tableau visualisation showing human figure with injury hospitalisation data for each body part. The trunk reported the highest number of injury cases.

Figure 8: Transport-related injury hospitalisations (2015–16 to 2024–25) and deaths (2014–15 to 2023–24), by type of transport, age group and sex
Interactive Tableau dashboard with a hospitalisations, and a deaths tab. Each tab shows a time series of rates by age group, and by sex. Users can toggle to select the specific type of transport being shown on the dashboard.
For more detail, see Supplementary data tables (Transport Tables 1 and 2).
First Nations people
Among Aboriginal and Torres Strait Islander (First Nations) people:
- there were 4,430 hospitalisations due to transport accidents in 2024–25 (422.1 per 100,000)
- males were 2.3 times as likely as females to be hospitalised (586 and 256.7 per 100,000 population respectively)
- hospitalisation rates were highest among people aged 15–24 (Figure 9).
Figure 9: Transport-related injury hospitalisations among First Nations people, by age and sex, 2024–25
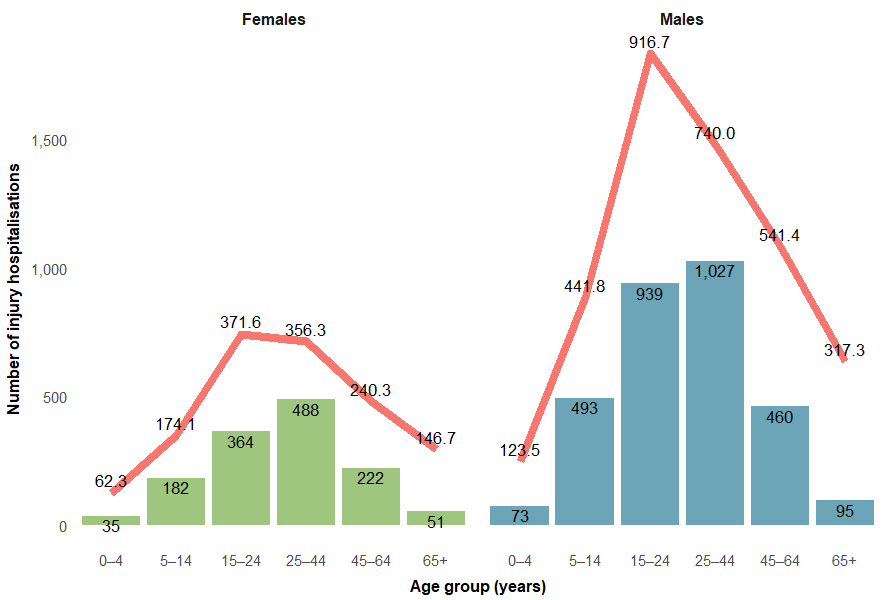
Note: Columns are number of hospitalisations, and the line graph represents crude rates (per 100,000 population).
Sources: AIHW National Hospital Morbidity Database and ABS Estimates and Projections, Aboriginal and Torres Strait Islander Australians.
Among First Nations people:
- there were 122 deaths due to transport accidents in 2023–24 (11.8 per 100,000)
- males were 2.8 times as likely as females to die from transport accidents (17.4 and 6.2 per 100,000 population respectively) (Table 2).
Sex | Number of injury deaths | Mortality rate per 100,000 population |
|---|---|---|
Males | 90 | 17.4 |
Females | 32 | 6.2 |
Persons | 122 | 11.8 |
Note: Numbers and rates are reported for 5 jurisdictions combined – New South Wales, Queensland, Western Australia, South Australia and the Northern Territory. These jurisdictions are considered to have adequate levels of Indigenous identification in mortality data.
Sources: AIHW National Mortality Database and ABS Estimates and Projections, Aboriginal and Torres Strait Islander Australians.
For more detail, see Supplementary data tables (Table H5 and Transport Table 5).
Comparison between First Nations people and non-Indigenous Australians
Figure 10: Transport-related injury hospitalisations (2017–18 to 2024–25) and deaths (2017–18 to 2023–24), by Indigenous status
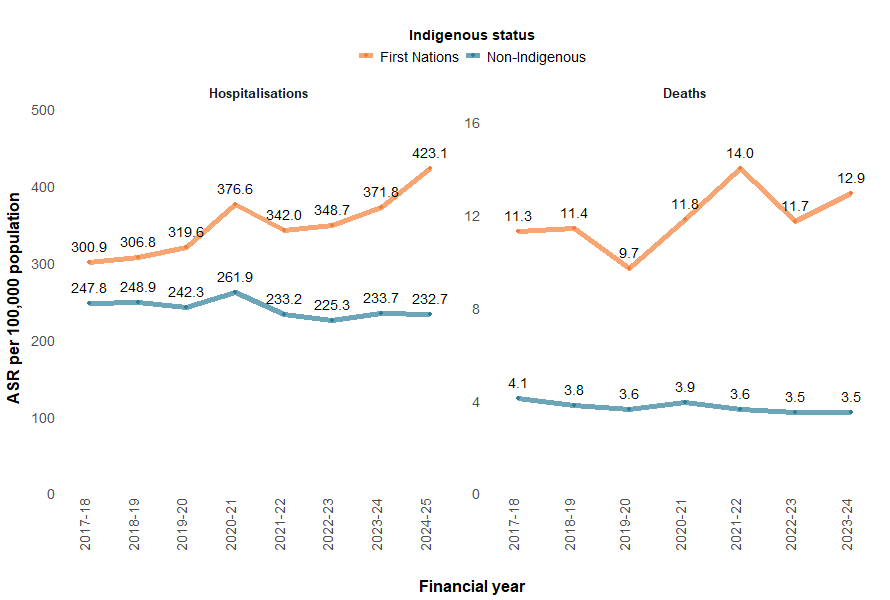
Notes:
- Age-standardised rates per 100,000 population.
- ‘Non-Indigenous Australians’ excludes cases where Indigenous status is missing or not stated.
- Numbers and rates of deaths are reported for 5 jurisdictions combined – New South Wales, Queensland, Western Australia, South Australia and the Northern Territory. These jurisdictions are considered to have adequate levels of Indigenous identification in mortality data.
Sources: AIHW National Hospital Morbidity Database, AIHW National Mortality Database and ABS Estimates and Projections, Aboriginal and Torres Strait Islander Australians.
In 2024–25, the transport-related injury hospitalisation rate was highest among the 15–24 age group for both First Nations people and non-Indigenous Australians (Figure 11). Data for deaths are not presented because of small numbers.
Figure 11: Transport-related injury hospitalisations, by Indigenous status and age group, 2024–25
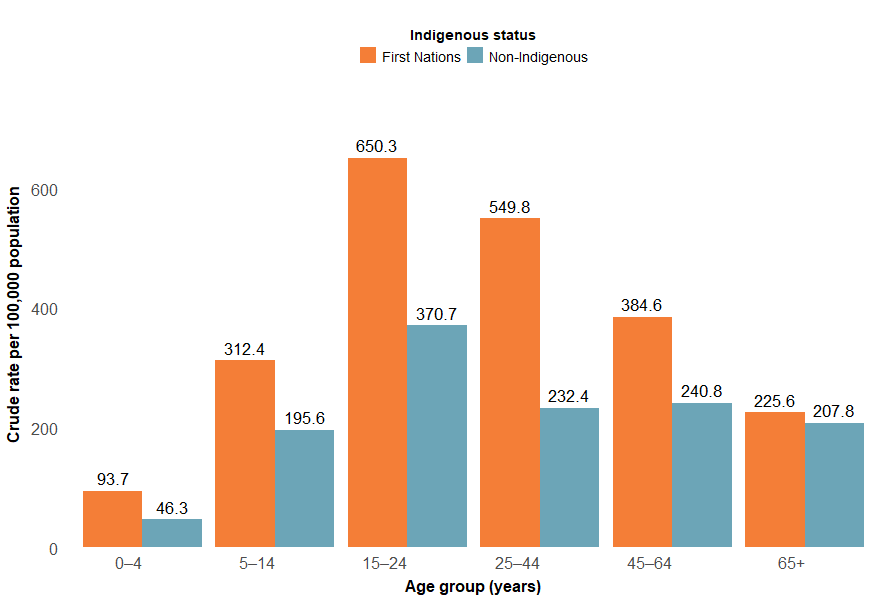
Notes:
- Crude rates per 100,000 population.
- ‘Non-Indigenous’ excludes cases where Indigenous status is missing or not stated.
Sources: AIHW National Hospital Morbidity Database and ABS Estimates and Projections, Aboriginal and Torres Strait Islander Australians.
For more detail, see Supplementary data tables (Transport Table 5).
State and territory
The states and territories with the highest rates of transport injury hospitalisation in 2023–24 were:
- Northern Territory (444.2 per 100,000)
- Queensland (299.3 per 100,000)
- Tasmania (273.8 per 100,000).
The states and territories with the highest rates of transport injury death in 2022–23 were:
- Northern Territory (13.2 per 100,000)
- Tasmania (8.2 per 100,000)
- Western Australia (7.1 per 100,000) (Figure 13).
Figure 12: Age-standardised rate of transport injury hospitalisations (2023–24) and deaths (2022–23), by state or territory of usual residence, Australia
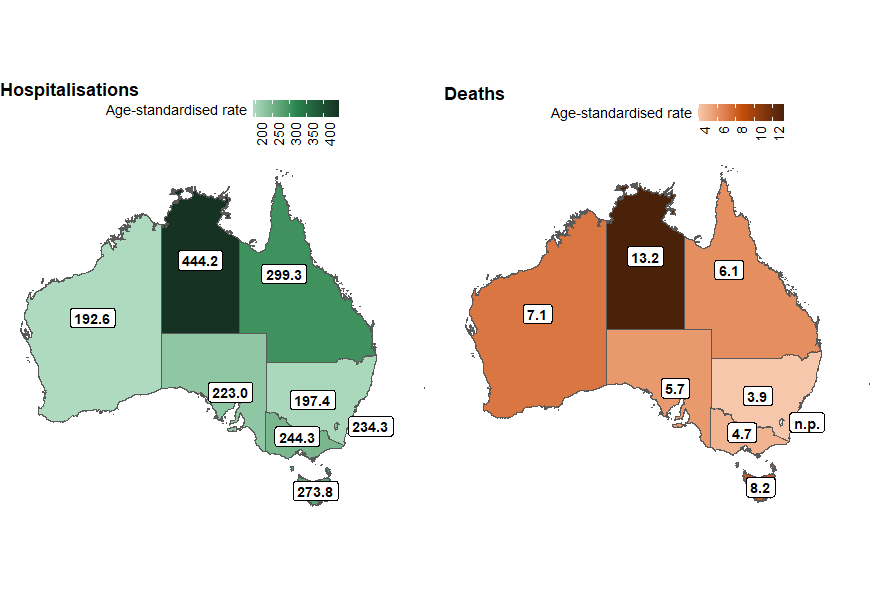
Note:
- State and territory refers to the state and territory of usual residence for the individual.
- Age-standardised rates per 100,000 population.
Sources: AIHW National Hospital Morbidity Database, AIHW National Mortality Database, and ABS National, state and territory population.
There are some differences in trends across states by type of transport involved (Figure 14). As compared to the previous 5-year average, 2023–24 saw an increased percentage of pedestrian transport injury hospitalisations across all states and territories except South Australia and the Australian Capital Territory, and 2022–23 saw an increase in overall transport deaths in Victoria, Western Australia and Tasmania. Victoria also saw increased pedestrian deaths as compared to the previous 5-year average.
Figur 13: Percentage difference in age-standardised rates of transport injury hospitalisations (2023–24) and deaths (2022–23) compared to the previous 5-year average, by state or territory of usual residence, Australia
Maps of Australia showing trends in age-standardised rate of transport hospitalisation and death by state or territory by type of transport.
Figure 14: Age-standardised rates of transport injury hospitalisations, by remoteness, type of transport and financial year, Australia
Interactive tableau dashboard showing a line graph of the rate of transport hospitalisations and deaths by year and remoteness. There are two tabs - one for hospitalisations, and one for deaths. Users can toggle to select different types of transport to display.

Figure 15: Age-standardised rates of transport injury hospitalisations, by socioeconomic areas, type of transport and financial year, Australia
Interactive tableau dashboard showing a line graph of the rate of transport hospitalisations and deaths by year and socioeconomic status. There are two tabs - one for hospitalisations, and one for deaths. Users can toggle to select different types of transport to display.
