This content contains information some readers may find distressing.

If you, or someone you know needs help, contact Lifeline on 13 11 14. Go to the crisis and support services page for a list of support services.

Water-based activities such as swimming and bathing are usually safe, when risks are managed. However, environmental conditions or accidents can lead to submersion injuries or death by drowning. Some submersion injuries can have long-term effects, such as when the brain goes without oxygen for too long.

Drowning and submersion injuries caused:

520 hospitalisations in 2021–22

2.0 per 100,000 population

270 deaths in 2020–21

1.1 per 100,000 population

This represents 0.1% of injury hospitalisations and 2.0% of injury deaths.

Both swimming pools and natural bodies of water were common locations of drowning and submersion accidents that led to hospitalisation. Children aged under 5 had the highest rate of hospitalisation. Natural bodies of water were the most common location for drowning deaths. Males were 4.0 times as likely as females to die by drowning.

This report summarises data on accidental drowning and submersion events only. Intentional events are included under Self-harm injuries and suicide. Falling overboard from a watercraft is included under Transport accidents.

Locations where drowning and submersions occur

Swimming pools are the most common location of drowning and submersion accidents that lead to hospital admission, closely followed by natural bodies of water (Table 1).

Table 1: Locations of drowning and submersion accidents which led to hospitalisation, 2021–22

Location

Hospitalisations

%

Rate (per 100,000)

Swimming pool (including following a fall into a pool) (W67–68)

175

34

0.7

Natural water (including following a fall into natural water) (W69–70)

156

30

0.6

Bathtub (including following a fall into a bathtub) (W65–66)

160

31

0.6

Other or unspecified (W73–74)

24

5

0.1

Total

515

100

2

Notes

  1. Rates are crude per 100,000 population, calculated using estimated resident population as at 31 December of the relevant year. Percentages may not total 100 due to rounding.
  2. Codes in brackets refer to the ICD-10-AM (11th edition) external cause codes (ACCD 2019).

Source: AIHW National Hospital Morbidity Database

Natural bodies of water are the most common location of drowning and submersion accidents that led to death (Table 2).

Table 2: Locations of drowning and submersion accidents which led to death, 2020–21

Location

Number

%

Rate (per 100,000)

Natural water (including following a fall into natural water) (W69–70)

139

51

0.5

Swimming pool (including following a fall into a pool) (W67–68)

33

12

0.1

Bathtub (including following a fall into a bathtub) (W65–66)

16

6

0.1

Other, unspecified or elsewhere classified (W73–74, T75.1)

84

31

0.3

Total

272

100

1.1

Notes

Notes

  1. Rates are crude per 100,000 population, calculated using estimated resident population as at 31 December of the relevant year.
  2. Percentages may not total 100 due to rounding.
  3. Codes in brackets refer to the ICD-10 external cause codes (WHO 2011).

Source: AIHW National Mortality Database

For more detail, see Data tables B3–4 and E4–5.

Over the period from 2017–18 to 2021–22, the age-standardised rate of hospitalisations due to drowning and submersion fell by an annual average of 6.3%. From 2012–13 to 2016–17 there was an average annual increase of 1.3%.

There is a break in the time series for hospitalisations between 2016–17 and 2017–18 due to a change in data collection methods (see the technical notes for details).

For drowning deaths, the age-standardised rate for 2020–21 was 16% higher than a year earlier, when a similar sized dip had occurred coinciding with COVID-19 restrictions. Between 2012–13 and 2020–21 there was an annual average decrease of 1.5% (Figure 1).

Figure 1: Drowning and submersion hospitalisations and deaths, by sex and year

2 matching line graphs on separate tabs, 1 tab for hospitalisations and 1 for deaths. The 3 lines represent the trend for males, persons and females. The reader can choose to display rate per 100,000 population or number.

For more detail, see Data tables C1–3 and F1–4.

Seasonal differences

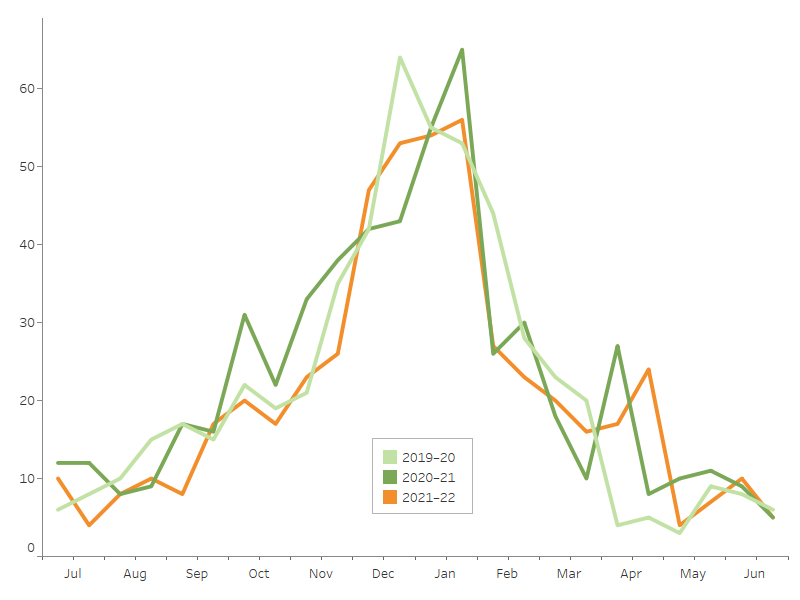
Hospitalisations due to drowning and submersion show a strong seasonal pattern, and are highest in summer (Figure 2).

Figure 2: Seasonal differences in drowning and submersion hospitalisations, 2019–20 to 2021–22

3 line graph representing the trends for 2019-20, 2020-21 and 2021-22

Notes
1. Admission counts have been standardised into two 15-day periods per month.
2. A scale-up factor has been applied to June admissions to account for cases not yet separated.

Source: AIHW National Hospital Morbidity Database.

Age and sex differences

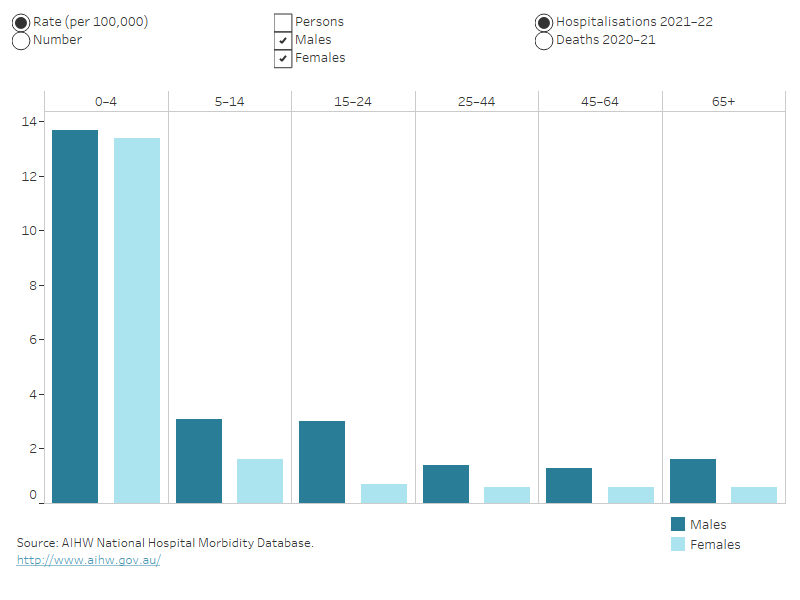
Rates of hospitalisation and death due to drowning and submersion differ by age group and sex (Figure 3).

For hospitalisations caused by drowning and submersion in 2021–22:

  • 63% were for males
  • children aged 0–4 had the highest rate
  • the age-standardised rates were:
    •  2.7 cases per 100,000 males and
    • 1.6 cases per 100,000 females.

For drowning deaths in 2020–21:

  • males aged 65 and over had the highest rates
  • the age-standardised rates were:
    • 1.6 per 100,000 males and
    • 0.4 per 100,000 females.

Figure 3: Drowning and submersion hospitalisations and deaths, by age group and sex

Column graph representing sex within 6 life-stage age groups. The reader can choose to display either rate per 100,000 population or number. The reader can choose to display hospitalisations or deaths. The default displays rate of hospitalisations for males and females and the reader can also choose to display persons.

For more detail, see Data tables A1–3 and D1–3.

Severity

There are many ways that the severity, or seriousness, of an injury can be assessed. Some of the ways to measure the severity of hospitalised injuries are:

  • number of days in hospital
  • time in an intensive care unit (ICU)
  • time on a ventilator
  • in-hospital deaths.

The average number of days in hospital and the rate of in-hospital deaths were both lower than the average for all injuries, while the percentage of cases that included time in the ICU, the percentage that involved continuous ventilatory support were among the highest of all injury causes (Table 3).

Table 3: Severity of hospitalised injuries due to drowning and submersion, 2021–22
 

Drowning and submersion

All injuries

Average number of days in hospital

2.7

4.7

% of cases with time in an ICU

7.6

2.0

% of cases involving continuous ventilatory support

6.8

1.1

In-hospital deaths (per 1,000 cases)

0.0

5.9

Note: Average number of days in hospital (length of stay) includes hospitalisations that are transfers from 1 hospital to another or transfers from 1 admitted care type to another within the same hospital, except where care involves rehabilitation procedures.

Source: AIHW National Hospital Morbidity Database.

For more detail, see data tables A12 and A13.

Aboriginal and Torres Strait Islander people

Among Aboriginal and Torres Strait Islander people:

  • there were 29 hospitalisations in 2021–22 (Table 4)
  • and 10 deaths in 2020–21

caused by drowning and submersion.

Table 4: Number and of drowning and submersion hospitalisations by sex, Indigenous Australians, 2021–22


Males

Females

Persons

Hospitalisations

13

16

29

Source: AIHW National Hospital Mortality Database.

Indigenous and non-Indigenous Australians

In 2021–22, Indigenous Australians, compared with non-Indigenous Australians , after adjusting for differences in population age structure, were 1.2 times as likely to be hospitalised due to a drowning and submersion injury. Readers are advised to use these data with caution due to small numbers.

Deaths data are not compared here because of the small numbers but are available in the data tables.

For more detail, see Data tables A4–A6 and D4–D8.


Remoteness

In 2021–22, the rate of hospitalisation due to drowning and submersion for people living in Outer regional areas was 1.5 times the rate of those living in Major cities (age-standardised) (Figure 5) (Data table A9). Rates of death are not compared here due to small numbers.

Figure 4: Drowning and submersion injury hospitalisations by remoteness and sex, 2021–22

This is a column graph of hospitalisations by each of the 5 remoteness categories for males, females and persons. The reader can choose to display age-standardised rate per 100,000 population or number.

For more detail, see Data tables A7–9 and D9–10.

For information on how the statistics were calculated by remoteness, see the technical notes.

Data details