Injury in Australia:
Overexertion
Web article
Last updated:
Topic: Injury
Citation
AIHW (Australian Institute of Health and Welfare) (2026) Overexertion, AIHW, Australian Government, accessed 25 July 2026.
This article is part of Injury in Australia
Unintentional causes
Intentional causes
Types of overexertion
In 2024–25, nearly all injury hospitalisations due to overexertion were classified as overexertion and strenuous or repetitive movements (99.7%) (Table 1).
| Cause | Hospitalisations | Rate (per 100,000) |
|---|---|---|
Overexertion and strenuous or repetitive movements (X50) | 14,413 | 52.6 |
Travel and motion (X51) | 22 | 0.1 |
Lack of food or water, or other privation (X52–X57) | 21 | 0.1 |
Total | 14,456 | 52.8 |
Note: Crude rate per 100,000 population.
Sources: AIHW National Hospital Morbidity Database and ABS National, state and territory population.
Trends over time
There is a break in the time series for hospitalisations between 2016–17 and 2017–18 due to a change in data collection methods (see the technical notes for details).
The number of injury hospitalisations due to overexertion has remained stable over the past decade (Figure 1).
Between 2015–16 and 2024–25, the rate decreased from 60.2 to 52.8 per 100,000 population (Figure 1). The hospitalisation rate in 2024–25 was 3.7% lower than the previous 5-year average rate of 54.8 per 100,000 population.
Figure 1: Injury hospitalisations due to overexertion, 2015–16 to 2024–25
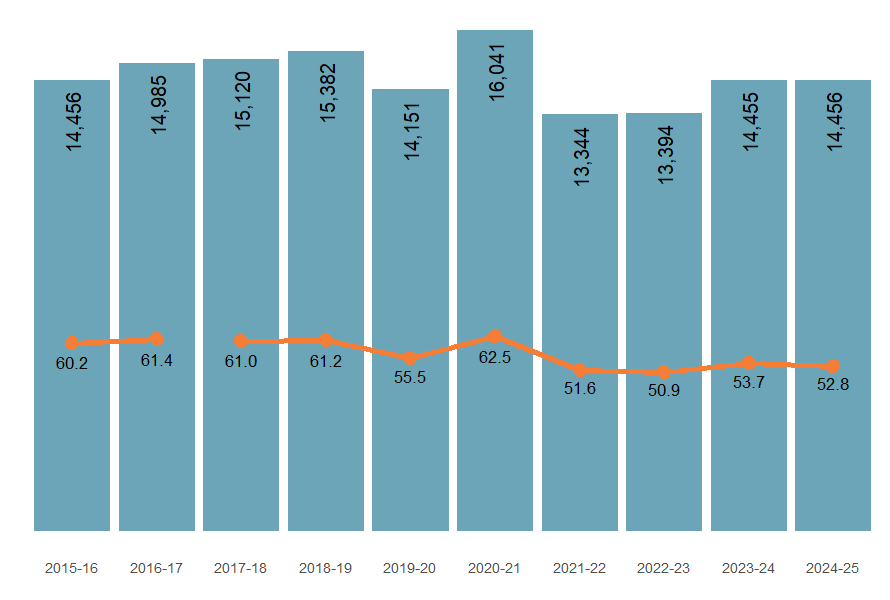
Note: Columns represent the number of hospitalisations, and the line graph represents the crude rate (per 100,000 population).
Sources: AIHW National Hospital Morbidity Database and ABS National, state and territory population.
The number of deaths due to overexertion has generally increased over time, however the number of injury deaths in 2024–25 was the lowest since 2018–19 (Figure 2).
Figure 2: Injury deaths due to overexertion, 2014–15 to 2023–24
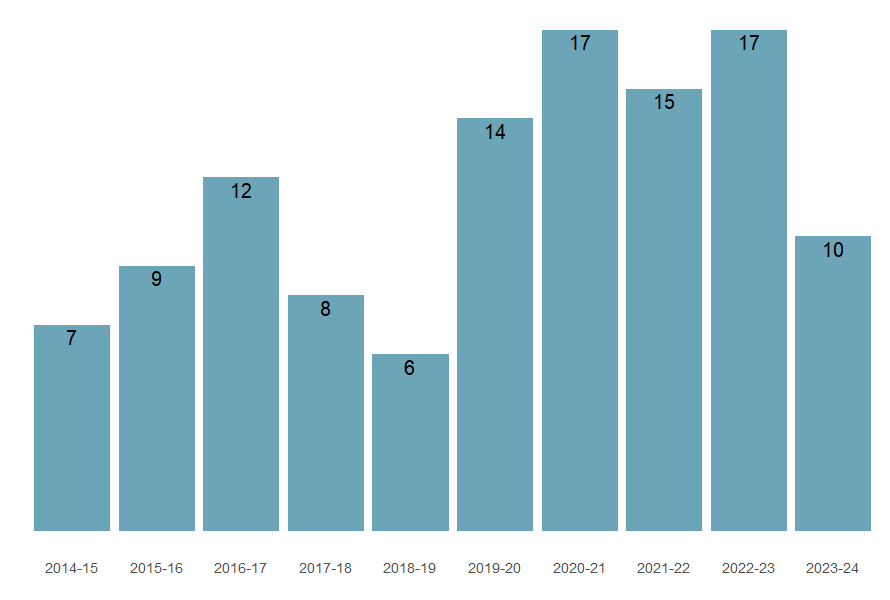
Note: Columns are the number of deaths due to overexertion injuries.
Source: AIHW National Mortality Database.
What injuries occur?
Body part injured and type of injury
In 2024–25, the hip and lower limb was the most common site of overexertion injury hospitalisations (25.6 per 100,000 population), followed by the trunk (10.2 per 100,000) (Figure 3).
Figure 3: Injury hospitalisations due to overexertion, by main body part injured, 2024–25
An interactive tableau visualisation showing human figure with injury hospitalisation data for each body part. The hip and lower limb reported the highest number of injury cases.

Figure 4: Injury hospitalisations due to overexertion, by age group and sex, 2015–16 to 2024–25
Interactive Tableau dashboard displaying hospitalisations. It shows a time series of rates by age group, and by sex.

For more detail, see supplementary data tables H3 and H4.
First Nations people
Among Aboriginal and Torres Strait Islander (First Nations) people:
- there were 641 hospitalisations due to overexertion injuries in 2024–25 (61.1 per 100,000 population)
- males were 1.3 times as likely as females to be hospitalised (69.9 and 52.2 per 100,000 population, respectively)
- hospitalisation rates were highest among people aged 25–44 (Figure 5).
Figure 5: Injury hospitalisations due to overexertion among First Nations people, by age and sex, 2024–25
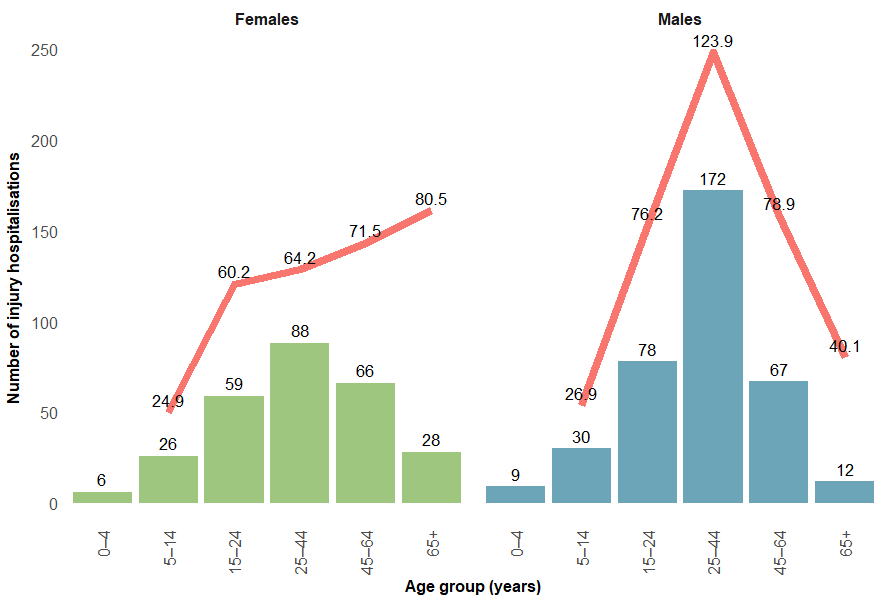
Note: Columns are number of hospitalisations, the line is the crude rate (per 100,000 population).
Sources: AIHW National Hospital Morbidity Database and ABS Estimates and Projections, Aboriginal and Torres Strait Islander Australians.
Comparison between First Nations and non-Indigenous Australians
Compared with non-Indigenous Australians, First Nations people were 1.4 times as likely to be hospitalised due to an overexertion-related injury in 2024–25 (Figure 6).
Figure 6: Injury hospitalisations due to overexertion, by Indigenous status, 2017–18 to 2024–25
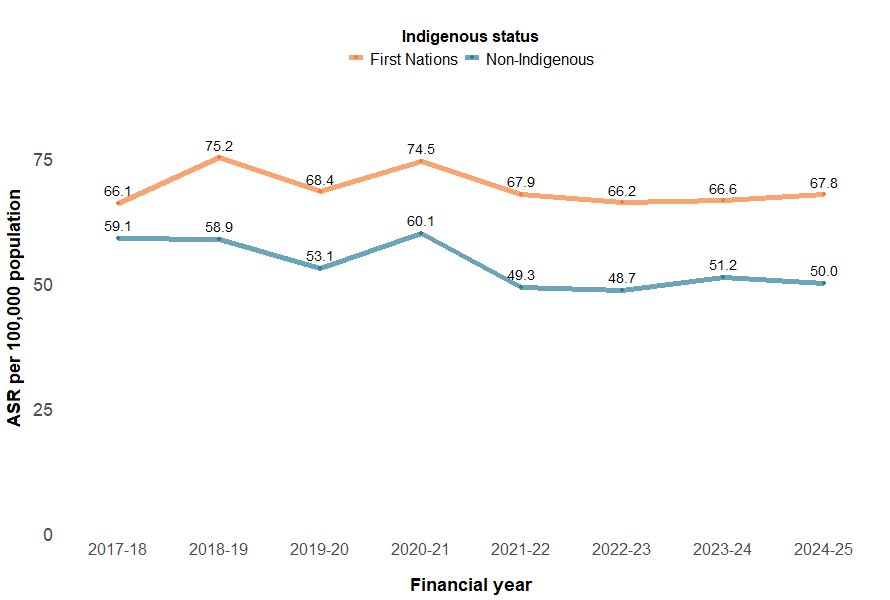
Notes:
- Age-standardised rates per 100,000 population.
- ‘Non-Indigenous’ excludes cases where Indigenous status is missing or not stated.
Sources: AIHW National Hospital Morbidity Database and ABS Estimates and Projections, Aboriginal and Torres Strait Islander Australians.
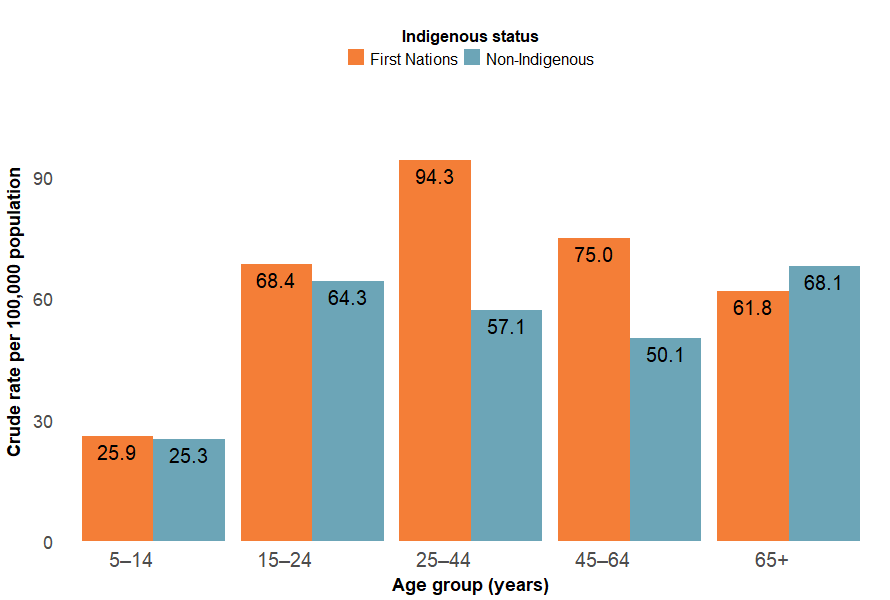
The rate of overexertion injury hospitalisations was highest among the 25–44 age group for First Nations Australians and among the 65 and above for non-Indigenous Australians (Figure 7). Deaths data are not presented because of small numbers.
Figure 7: Injury hospitalisations due to overexertion, by Indigenous status and age group, 2024–25
Notes:
- Crude rates per 100,000 population.
- ‘Non-Indigenous’ excludes cases where Indigenous status is missing or not stated.
Sources: AIHW National Hospital Morbidity Database, ABS National, state and territory population, ABS Estimates and Projections, Aboriginal and Torres Strait Islander Australians.
For more detail, see supplementary data tables H5 and H6.
State and territory
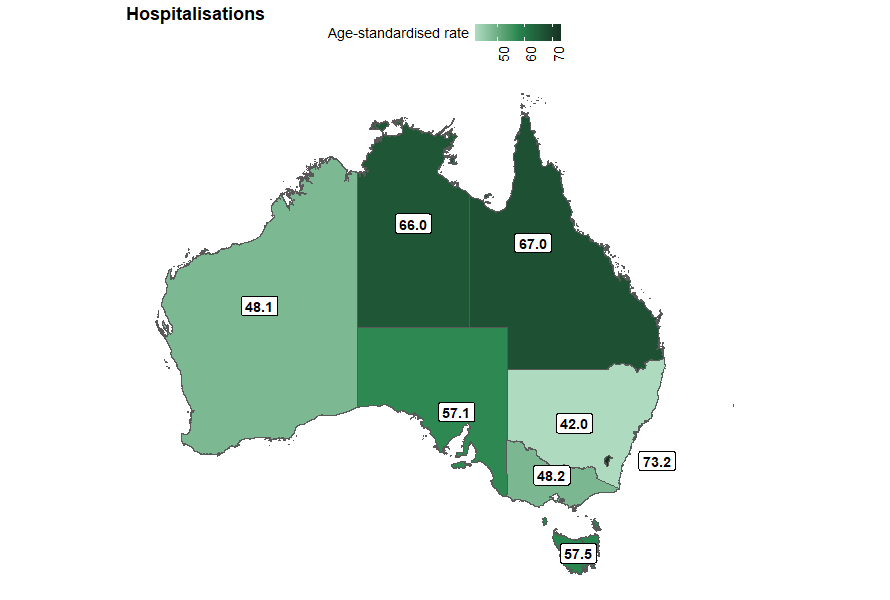
The states and territories with the highest rates of overexertion injury hospitalisation in 2023–24 were:
- Australian Capital Territory (73.2 per 100,000 population)
- Queensland (67.0 per 100,000)
- Northern Territory (66.0 per 100,000).
Numbers and rates of injury deaths cannot be reported by state and territory due to low numbers.
Figure 8: Age-standardised rate of overexertion injury hospitalisations, by state or territory of usual residence, Australia, 2023–24
Notes:
- ‘State and territory’ refers to the state and territory of usual residence for the individual.
- Age-standardised rates per 100,000 population.
Sources: AIHW National Hospital Morbidity Database and ABS National, state and territory population.
Remoteness
In 2023–24, the rates of overexertion injury hospitalisation were lowest in the most (Very remote) and least (Major cities) remote areas of Australia (44.9 and 48.0 per 100,000 population, respectively) (Figure 9).
People living in Remote areas had the highest rate of hospitalisation (66.2 per 100,000) and were 1.4 times as likely to be hospitalised for an overexertion injury in 2023–24 as people living in Major cities.
Figure 9: Age-standardised rates of overexertion injury hospitalisations, by remoteness and financial year, Australia
Interactive tableau dashboard showing a line graph of the rate of overexertion hospitalisations by year and remoteness.

Figure 10: Age-standardised rates of overexertion injury hospitalisations, by socioeconomic areas and financial year, Australia
Interactive tableau dashboard showing a line graph of the rate of overexertion hospitalisations by year and socioeconomic areas.
