Injury in Australia:
Contact with objects
Web article
Last updated:
Topic: Injury
Citation
AIHW (Australian Institute of Health and Welfare) (2026) Contact with objects, AIHW, Australian Government, accessed 17 July 2026.
This article is part of Injury in Australia
Unintentional causes
Intentional causes
Contact with objects (or Exposure to inanimate mechanical forces in ICD-10-AM) includes harmful contact with every day or industrial objects such as knives, tools, machines, and sports equipment. It also includes unintentional injuries caused by guns and non-heat-related injuries caused by explosions. For heat-related injuries, see Thermal causes. Transport accidents are covered in their own category, and so are excluded here.
Hospitalisations where the cause of injury is W44 Foreign body entering into or through eye or natural orifice and the type of injury is a Foreign body in the respiratory tract (T17.2–T17.8) were included in this category until the June 2022 release of this report, after which they were re-classified into Choking and suffocation.
This article covers accidental cases of injury hospitalisation or death caused by contact with objects. Intentional injuries are included under Self-harm and suicide or Assault and homicide.
Injuries by type of object
There is a considerable diversity of inanimate objects that can cause injuries. Hospitalisations record the type of object responsible for the injury, classified according to ICD-10-AM codes in the W20-W49 range.
In 2024–25, hospitalisations most often resulted from the following object types (Figure 1):
- contact with other sharp object(s) (53 per 100,000 population)
- striking against or struck by other object(s) (46.1 per 100,000 population)
- foreign body entering into or through eye or natural orifice (32.5 per 100,000 population)
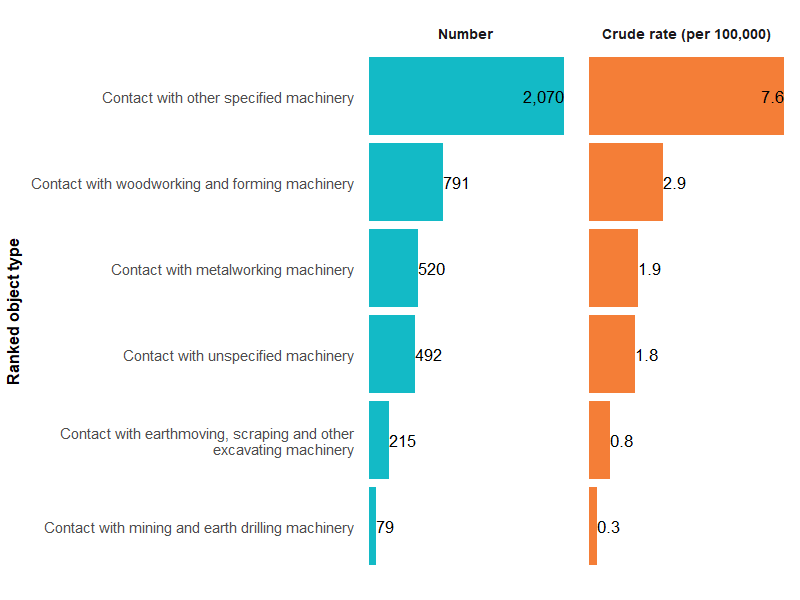
Figure 1: Injury hospitalisations due to contact with objects, by type of object, 2024–25
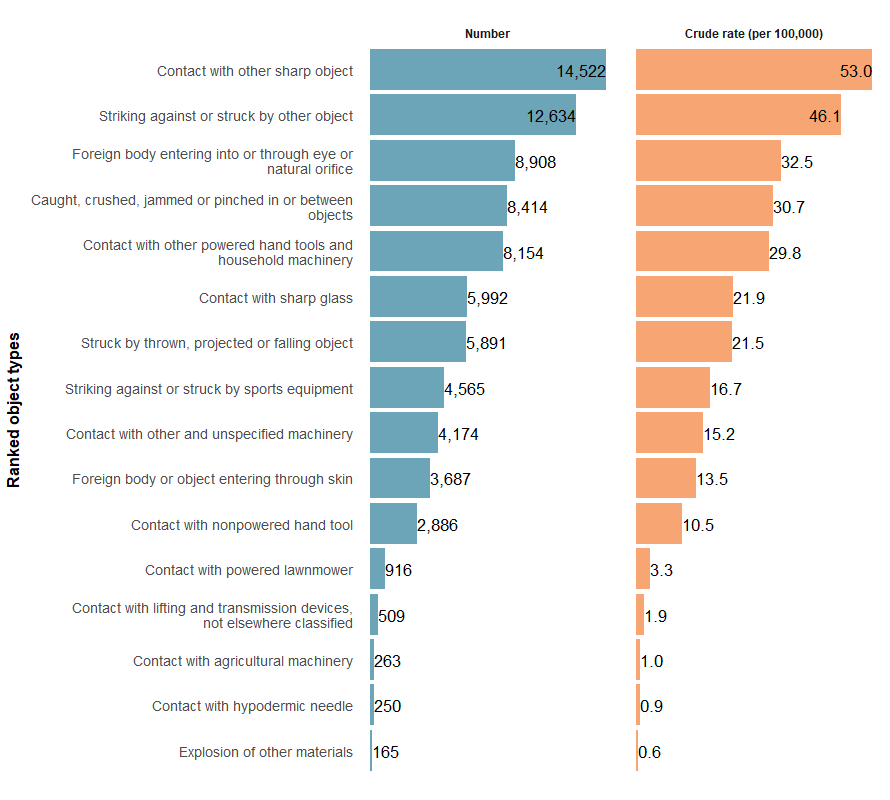
Note: Only object types causing more than 100 hospitalisations in 2024-25 are shown. For a comprehensive list of all object types, refer to supplementary data tables.
Sources: AIHW National Hospital Morbidity Database and ABS National, state and territory population.
For some object type categories, it is possible to provide further detail about the specific type of object responsible for the injury hospitalisation. Click on the categories below for more detail on injuries caused by:
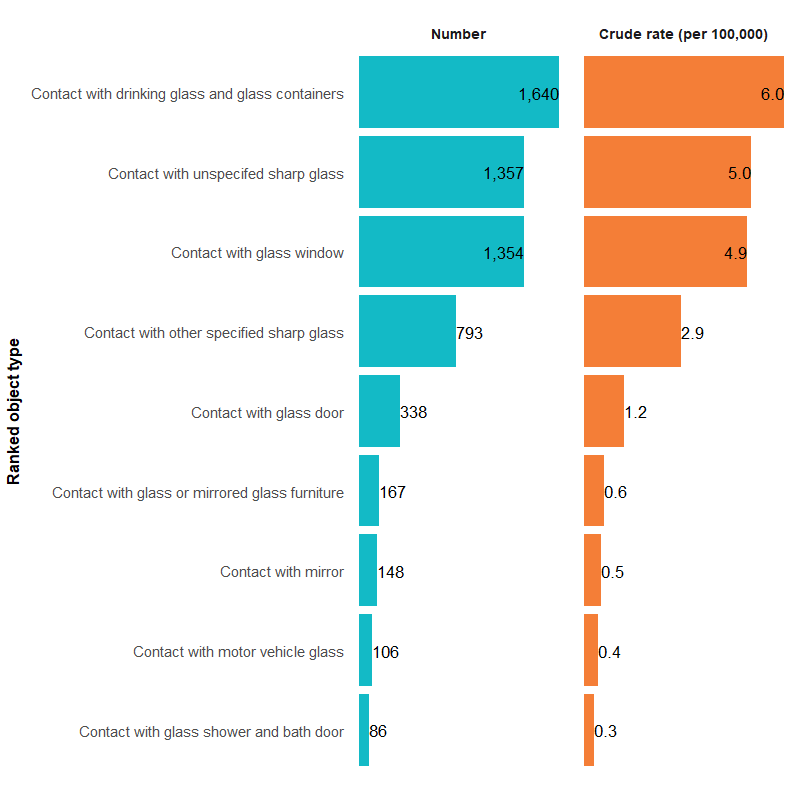
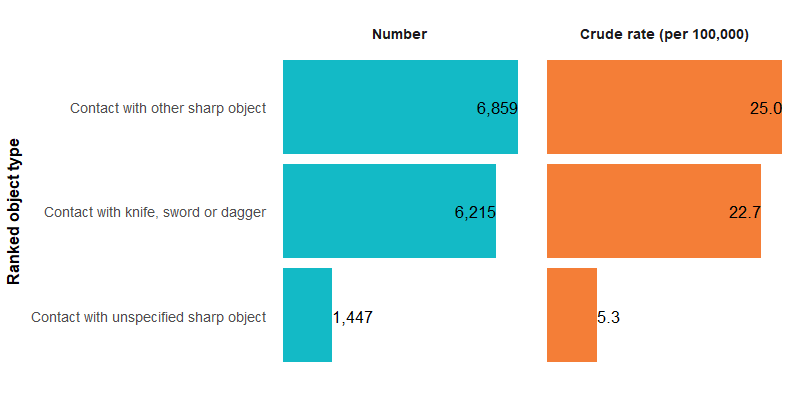
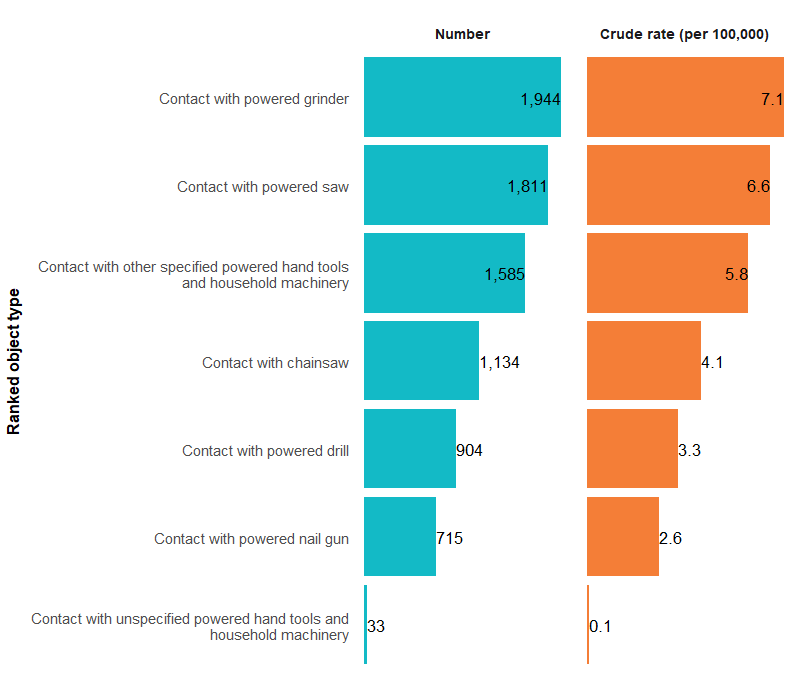
For more detail, see Objects supplementary data tables (Objects Table 7).
Trends over time
There is a break in the time series for hospitalisations between 2016–17 and 2017–18 due to a change in data collection methods (see the technical notes for details).
The number of injury hospitalisations due to contact with objects has generally increased over the past decade (Figure 2).
Between 2017–18 and 2024–25, the rate increased from 291.4 to 300.3 hospitalisations per 100,000, an average of 0.2% per year. There was a spike in 2020–21, likely due to more object-related injuries occurring at home during the COVID-19 pandemic (see What injuries occur? for more detail), but rates have since returned to pre-pandemic levels.
Figure 2: Injury hospitalisations due to contact with objects, 2015–16 to 2024–25
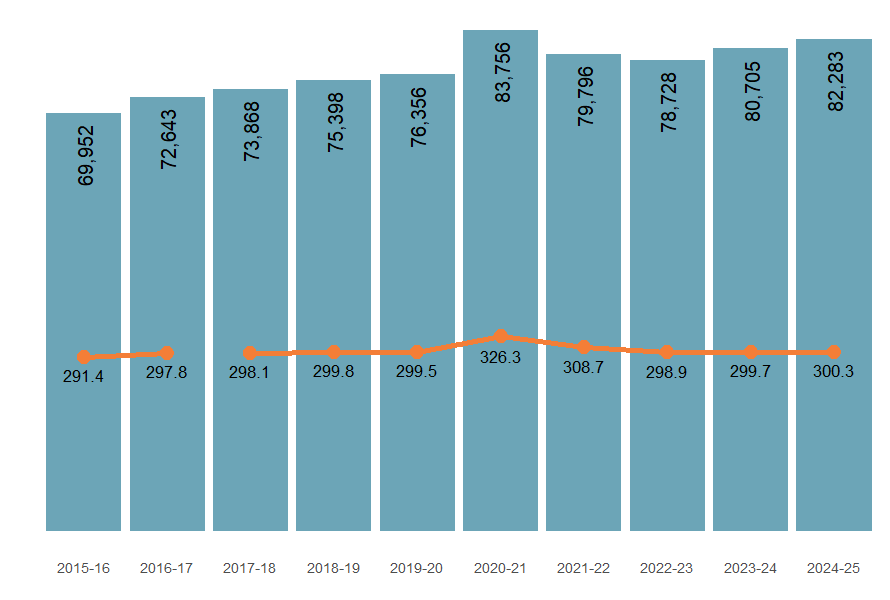
Note: Columns represent numbers of hospitalisations, the line represents the crude rate per 100,000.
Sources: AIHW National Hospital Morbidity Database and ABS National, state and territory population.
The number of deaths caused by contact with objects has generally remained stable over time, with the exception of a peak in 2019–20 (Figure 3).
Figure 3: Deaths due to contact with objects, 2014–15 to 2023–24
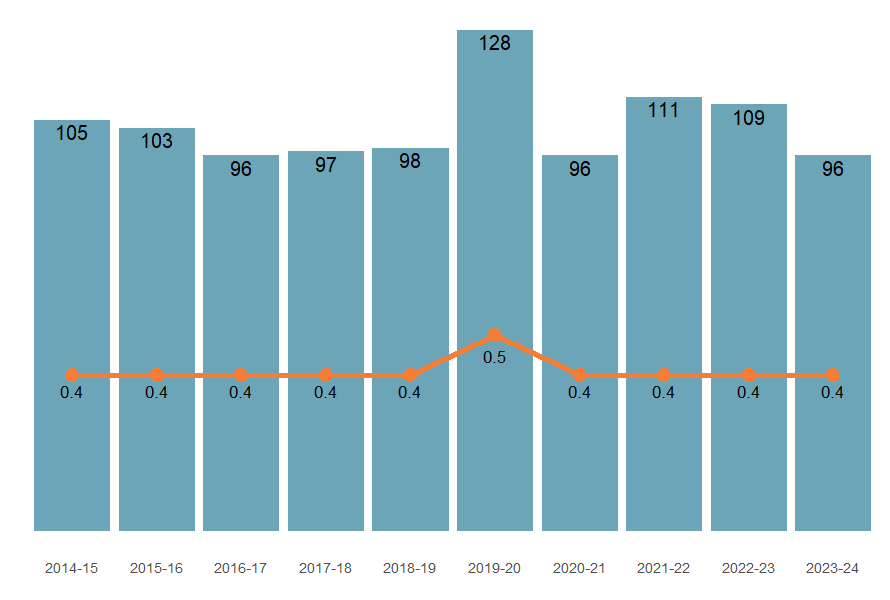
Note: Columns represent numbers of hospitalisations, lines represent crude rates per 100,000.
Sources: AIHW National Mortality Database and ABS National, state and territory population.
While all object types showed an increase in the rate of injury hospitalisations in 2020–21, detailed trends varied depending on the type of object involved (Figure 4). For example:
Figure 4: Injury hospitalisation due to contact with objects, by type of object, 2015–16 to 2024–25
Figure 5 shows that for most object types, the rate of injury hospitalisations has peaked in 2020-21.

Figure 5: Injury hospitalisations due to contact with objects by calendar month, 2024–25
Figure 5 shows the seasonal pattern of object injury hospitalisations by type of object.

Figure 6: Injury hospitalisations due to contact with objects by main body part injured, 2024–25

Over the past decade, most object-related injury hospitalisations occurred during unpaid work and learning (Figure 7). Injury hospitalisation rates caused by this type of activity peaked during the COVID-19 period, but have since resumed their gradual pre-pandemic rise.
Figure 7: Injury hospitalisations due to contact with objects, by activity at the time of injury (for selected activities), 2015–16 to 2024–25
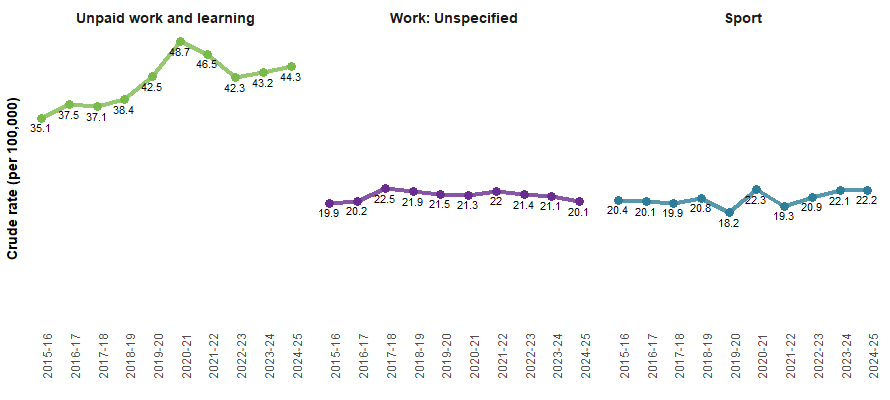
Notes:
- Crude rates per 100,000 population.
- Only the 3 most commonly recorded activities are shown here. For more detail please refer to the Supplementary Data tables.
Source: AIHW National Hospital Morbidity Database and ABS National, state and territory population.
Object-related injury hospitalisation rates were highest in the home over the past decade, with rates increasing from 69.6 to 78.7 per 100,000 population (Figure 8). Rates also peaked during the COVID-19 period. Minimal observable changes in rates of injury hospitalisations occurred at other places of occurrence.
Figure 8: Injury hospitalisations due to contact with objects, by recorded place of occurrence, 2015–16 to 2024–25

Note: Rates are age-standardised per 100,000 population.
Source: AIHW National Hospital Morbidity Database and ABS National, state and territory population.
Severity
Object-related injury hospitalisations are generally less severe than the average of all hospitalised injuries. In 2024–25, the average length of stay was shorter, a lower proportion of cases involved ICU admission or continuous ventilatory support, and a lower proportion died in hospital (Table 1).
Severity measure | Contact with objects | All injuries |
|---|---|---|
Average number of days in hospital | 1.7 | 3.4 |
Percentage of cases with time in an ICU (%) | 0.4 | 2.0 |
Percentage of cases with time on ventilator (%) | 0.2 | 1.1 |
In-hospital deaths (per 1,000 cases) | 0.4 | 5.7 |
Note:
- Average number of days in hospital (length of stay) includes admissions that are transfers from one hospital to another or transfers from one admitted care type to another within the same hospital, except where care involves rehabilitation procedures.
- All injuries includes injuries from contact with objects in the total calculations.
Source: AIHW National Hospital Morbidity Database.
Age and sex
Males are generally more likely to be hospitalised with injuries from contact with objects than females (Figure 9).
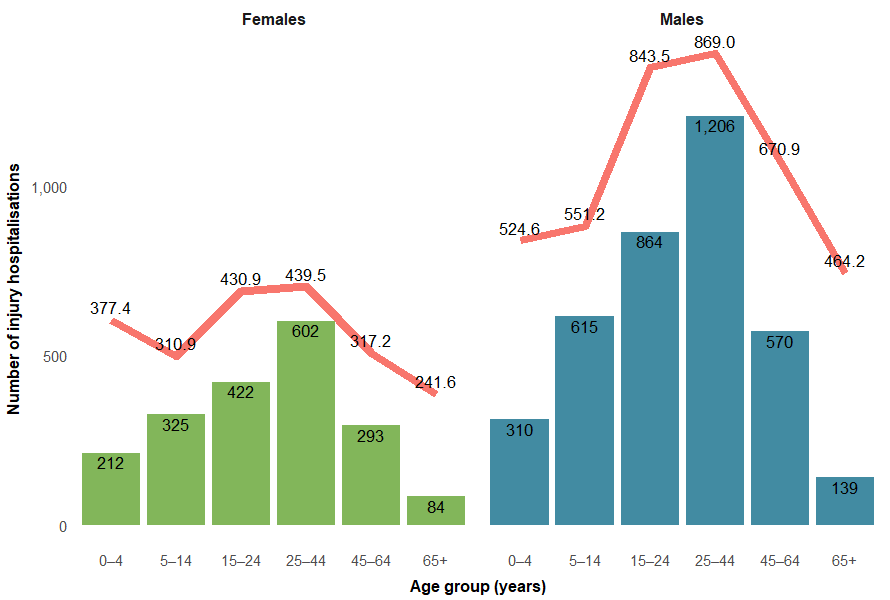
Figure 9: Injury hospitalisations due to contact with objects, by age group and sex, 2015–16 to 2024–25
Figure 9 is a line chart of object injury hospitalisations by sex and age over the last decade. Rates were higher in males and in persons aged 15 to 24.

First Nations people
Among Aboriginal and Torres Strait Islander (First Nations) people:
- there were 5,644 injury hospitalisations due to contact with objects in 2024–25 (537.7 per 100,000)
- males were twice as likely as females to be hospitalised (703.1 and 370.7 per 100,000 population, respectively)
- hospitalisation rates were highest among people aged 25–44 (Figure 10)
- there were 4 injury deaths due to contact with objects in 2023–24.
Figure 10: Injury hospitalisations due to contact with objects among First Nations people, by age group and sex, 2024–25
Note: Columns are the number of hospitalisations, the line is the crude rate per 100,000 population.
Source: AIHW National Hospital Morbidity Database and ABS Estimates and Projections, Aboriginal and Torres Strait Islander Australians.
For more detail, see Objects supplementary data tables (Objects Table 5).
Comparison between First Nations people and non-Indigenous Australians
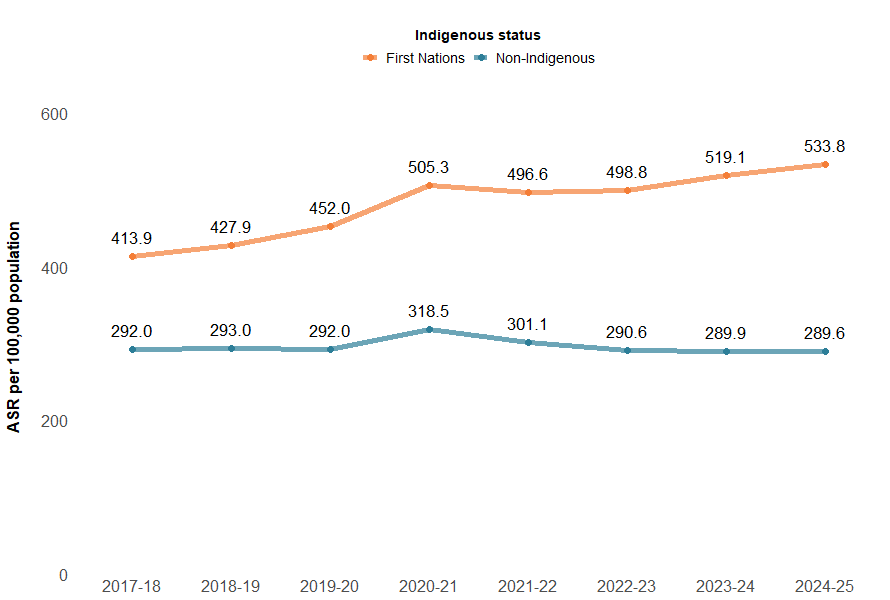
Figure 11: Injury hospitalisations due to contact with objects, by Indigenous status, 2017–18 to 2024–25
Notes:
- Age-standardised rates per 100,000 population.
- ‘Non-Indigenous people’ excludes cases where Indigenous status is missing or not stated.
Sources: AIHW National Hospital Morbidity Database and ABS Estimates and Projections, Aboriginal and Torres Strait Islander Australians.
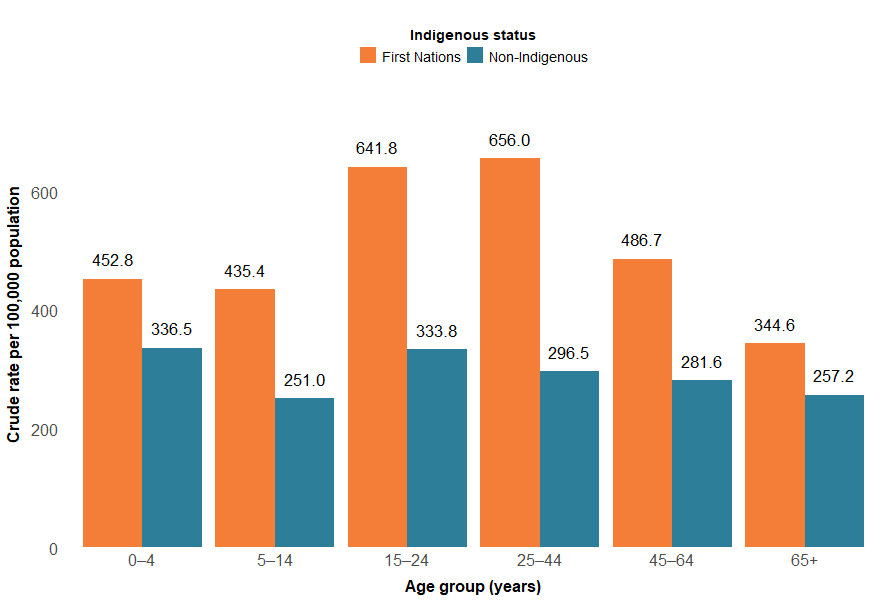
In 2024–25, the injury hospitalisation rate for contact with objects was much higher among the 15–24 and 25–44 age groups for First Nations people, whereas there was less variation between age groups for non-Indigenous Australians (Figure 12). Data on deaths are not presented because of small numbers.
Figure 12: Injury hospitalisations due to contact with objects, by Indigenous status and age group, 2024–25
Notes:
- Crude rates per 100,000 population.
- ‘Non-Indigenous’ excludes cases where Indigenous status is missing or not stated.
Sources: AIHW National Hospital Morbidity Database and ABS Estimates and Projections, Aboriginal and Torres Strait Islander Australians.
For more detail, see Supplementary Data table H6.
State and territory
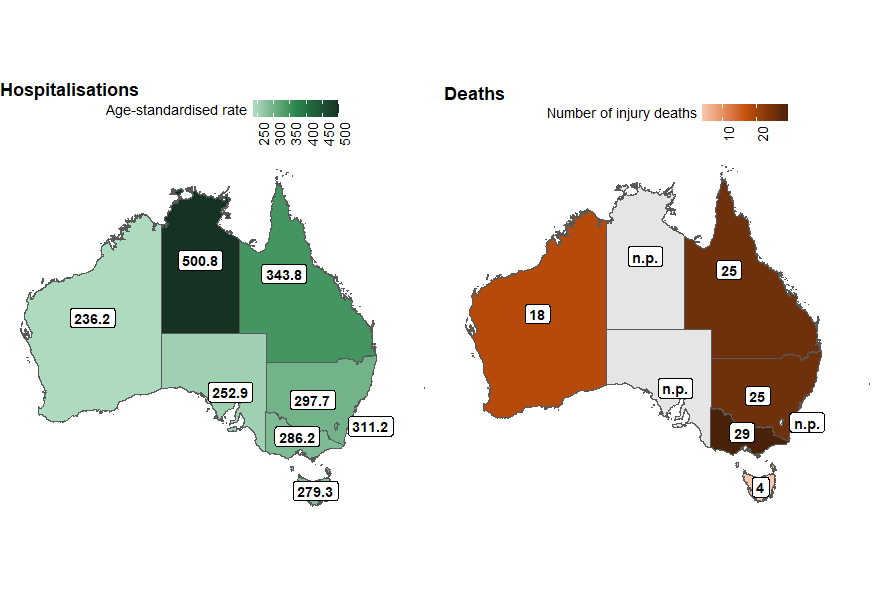
The states and territories with the highest rates of object-related injury hospitalisation in 2023–24 were:
- Northern Territory (500.8 per 100,000)
- Queensland (343.8 per 100,000)
- Australian Capital Territory (311.2 per 100,000) (Figure 13).
Rates of injury death cannot be reliably calculated in most states due to low numbers. In Figure 15, we show the number of object-related injury deaths in each state and territory in 2022–23.
Figure 13: Age-standardised rate of injury hospitalisations (2023–24), and number of injury deaths (2022–23), due to contact with objects, by state of usual residence, Australia
Notes:
- Injury hospitalisation rates are age-standardised per 100,000 population
- The number of injury deaths in each state is presented, as numbers are too low for a reliable rate calculation.
Sources: AIHW National Hospital Morbidity Database, AIHW National Mortality Database and ABS National, state and territory population.
There are some differences in trends across states by type of contact with objects involved (Figure 14). As compared to the previous 5-year average, 2023–24 saw a decrease in overall contact with objects across all states and territories except for Tasmania. Contact with other and unspecified machinery injuries decreased across all states and territories. Other decreases that were seen across most states and territories include:
- Contact with other powered hand tools and household machinery
- Contact with other shard objects
- Contact with sharp glass
- Foreign body or object entering through skin
- Striking against or struck by other objects
- Struck by thrown, projected or falling object.
Figure 14: Percentage difference in age-standardised rates of injury hospitalisations due to contact with objects, compared to the previous 5-year average, by state or territory of usual residence, Australia, 2023–24
Map of Australia showing trends in age-standardised rate of hospitalisation due to contact with objects by state or territory by type of object.

Figure 15: Age-standardised rates of injury hospitalisations due to contact with objects, by remoteness, type of object and financial year, Australia

-

People living in the most socioeconomically disadvantaged areas of Australia, compared to the least socioeconomically disadvantaged, were 1.4 times as likely to be hospitalised for object-related injuries in 2023–24
Figure 16: Age-standardised rates of injury hospitalisations due to contact with objects, by socioeconomic areas, type of object and financial year, Australia
