Injury in Australia:
Contact with people, plants and animals
Web article
Last updated:
Topic: Injury
Citation
AIHW (Australian Institute of Health and Welfare) (2026) Contact with people, plants and animals, AIHW, Australian Government, accessed 17 July 2026.
This article is part of Injury in Australia
Unintentional causes
- Accidental poisoning
- Choking and suffocation
- Contact with objects
- Contact with people, plants and animals This page
- Drowning and submersion
- Electricity and air pressure
- Falls
- Forces of nature
- Other unintentional causes and undetermined intent
- Overexertion
- Thermal causes
- Transport accidents
Intentional causes
Contact with people, plants and animals (known as Exposure to animate mechanical forces in ICD10-AM coding) includes injuries caused by humans, animals and plants including bites, stings, envenomations as well as unintentional person-to-person contact. It also includes exposure to or contact with animal allergens (allergy to animals).
This category includes only unintentional cases of injury hospitalisation or death. Intentional injuries are included under Self-harm and suicide or Assault and homicide.
Hospitalisations record the principal cause responsible for the injury, classified according to ICD-10-AM codes in the W50-W64, X20-X29 and Y37.6 ranges.
Causes of injury
In 2024–25, the leading causes of hospitalisation from contact with people, plants and animals were (Figure 1):
- bitten by a dog (9,920 cases, 36.2 per 100,000 population)
- hit, struck, kicked, twisted, bitten or scratched by another person (5,863 cases, 21.4 per 100,000 population)
- bitten or struck by a cat (3,459 cases, 12.6 per 100,000 population)
Figure 1: Injury hospitalisations due to contact with people, plants and animals, by cause, 2024–25
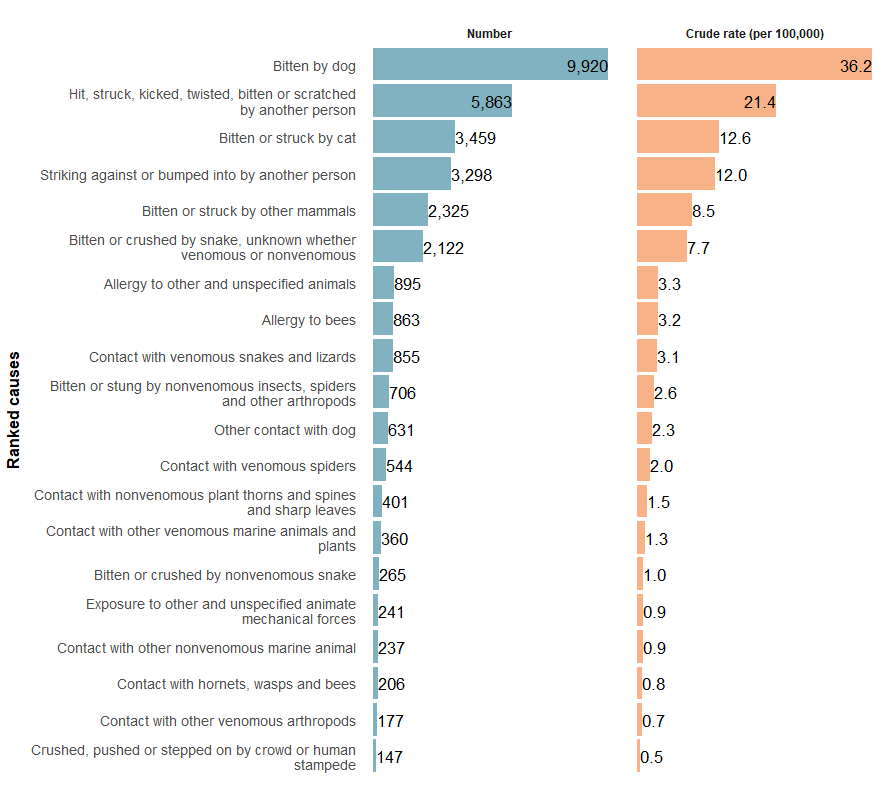
Note: Only causes resulting in more than 100 hospitalisations in 2024–25 are shown. For a comprehensive list of all causes, refer to supplementary data tables.
Source: AIHW National Hospital Morbidity Database and ABS National, state and territory population.
For more detail, see supplementary data Table H16.
The injury cause can be further categorised to indicate whether the contact source was venomous or not (Figure 2). Injury hospitalisations related to venomous animals represented about 7% of all contact with living things hospitalisations (for records where venomousness was known).
Figure 2: Injury hospitalisations due to contact with people, plants and animals, by venomousness, 2024–25
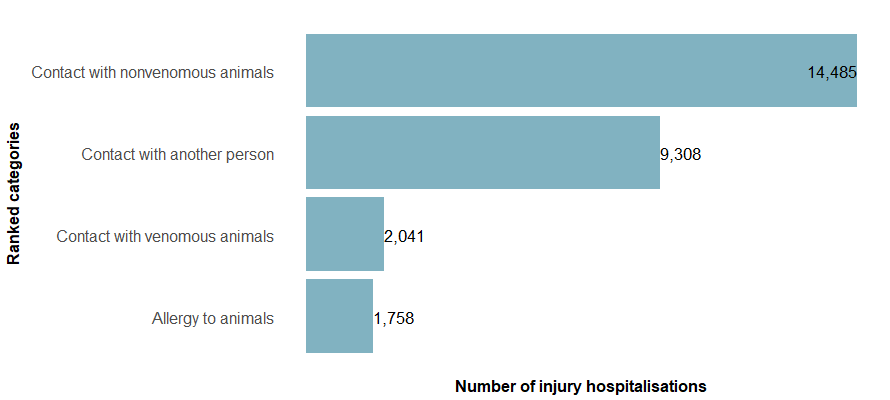
Note: Hospitalisations where the type of living thing was unrecorded or unspecified, or venomousness was uncertain, were not included in this figure.
Sources: AIHW National Hospital Morbidity Database and ABS National, state and territory population.
Trends over time
There is a break in the time series for hospitalisations between 2016–17 and 2017–18 due to a change in data collection methods (see the technical notes for details).
The number of injury hospitalisations caused by contact with people, plants and animals has gradually increased over the past decade, and the rate has ranged from a low of 97.9 per 100,000 in 2019–20 to a peak of 123.1 per 100,000 in 2024–25 (Figure 3). Between 2017–18 and 2024–25, the rate increased by an annual average of 2.3%.
Figure 3: Injury hospitalisations due to contact with people, plants and animals, 2015–16 to 2024–25
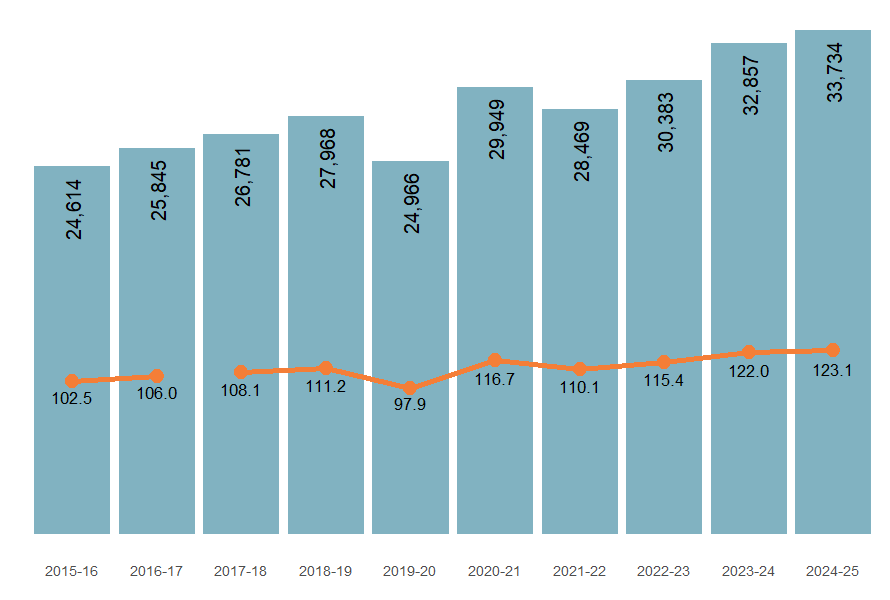
Note: Bars represent numbers of hospitalisations, lines represent crude rates per 100,000.
Source: AIHW National Hospital Morbidity Database and ABS National, state and territory population.
The number of deaths caused by contact with people, plants and animals has generally remained stable over time (Figure 4). Rates are not described further due to small numbers resulting in unreliable rates.
Figure 4: Injury deaths due to contact with people, plants and animals, 2014–15 to 2023–24
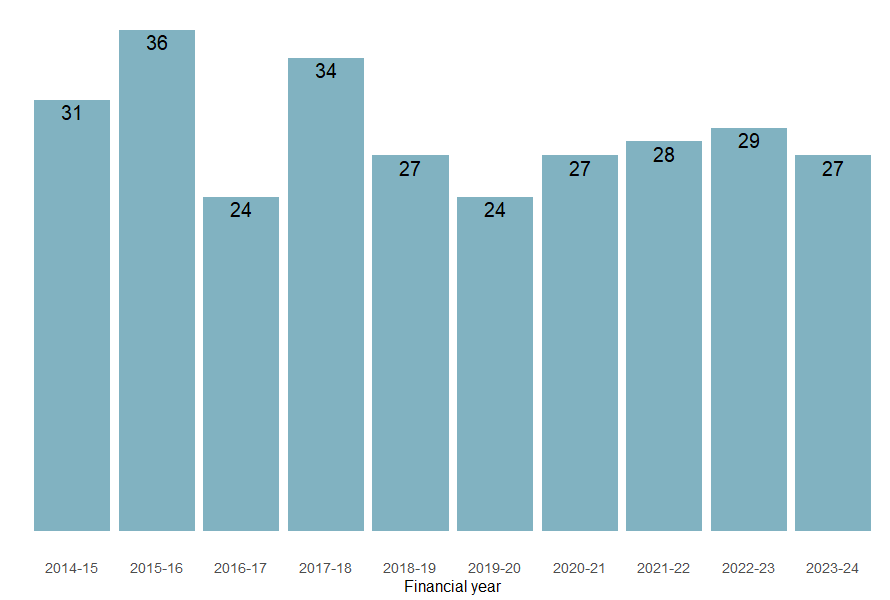
Note: Bars represent numbers of hospitalisations
Source: AIHW National Mortality Database.
Trends varied depending on the type of living thing involved (Figure 5).
Among the top five causes of injury-related hospitalisations from people, plants, and animals, hospitalisation rates for cat bites or strikes increased the most (19.8%) compared to the previous 5-year average, followed by injuries from another person (10.2%). Hospitalisations due to dog bites have also steadily risen over the past decade.
Figure 5: Injury hospitalisations due to contact with people, plants and animals, by type and year, 2015–16 to 2024–25
Figure 5 shows that hospitalisations relating to dog bites have increased steadily from 2014–15 to 2023–24.

Figure 6: Injury hospitalisations due to contact with people, plants and animals by calendar month, 2024–25
Figure 6 shows the seasonal pattern of injury hospitalisations caused by contact with living things.

Figure 7: Injury hospitalisations due to contact with people, plants and animals by main body part injured, 2024–25
An interactive tableau visualisation showing human figure with injury hospitalisation data for each body part. The wrist and hand reported the highest number of injury cases.

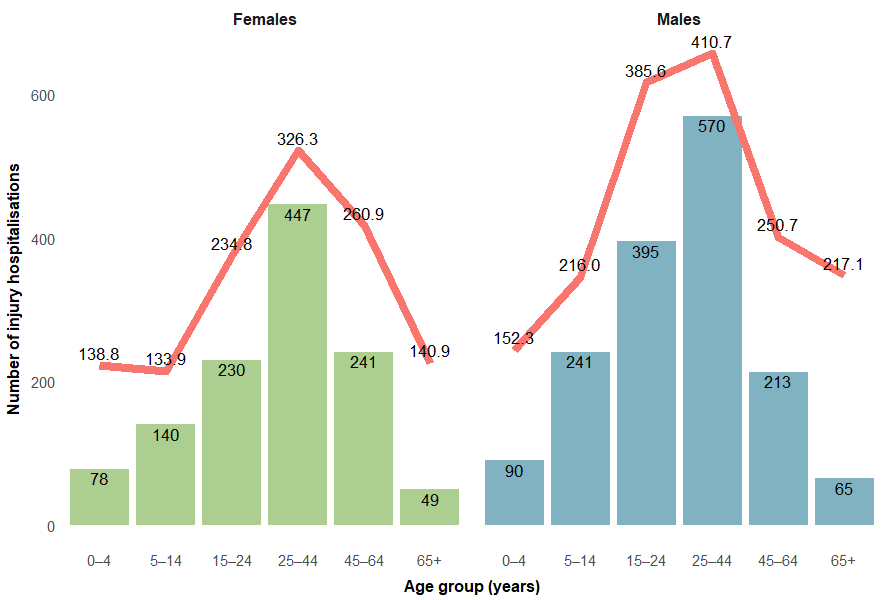
Figure 8: Injury hospitalisations and deaths due to contact with people, plants and animals, by age group, sex and year, 2015-16 to 2024-25
Interactive Tableau dashboard displaying hospitalisations. It shows a time series of rates by age group, and by sex.

First Nations people
Among Aboriginal and Torres Strait Islander (First Nations) people:
- there were 2,759 injury hospitalisations due to contact with people, plants and animals in 2024–25 (a crude rate of 262.9 per 100,000)
- males were 1.3 times as likely as females to be hospitalised (298.8 and 226.7 per 100,000 population)
- hospitalisation rates were highest among people aged 25–44 (Figure 9)
Figure 9: Injury hospitalisations due to contact with people, plants and animals among First Nations people, by age and sex, 2024–25
Note: Bars are number of hospitalisations, and the line graph represents crude rates (per 100,000 persons).
Sources: AIHW National Hospital Morbidity Database and ABS Estimates and Projections, Aboriginal and Torres Strait Islander Australians.
For more detail, see supplementary data Table H6.
Comparison between First Nations and non-Indigenous Australians
In 2024–25, Aboriginal and Torres Strait Islander (First Nations) people were 2.3 times more likely to be hospitalised for injuries from contact with people, plants, and animals compared with non-Indigenous people (Figure 10).
Between 2017–18 and 2024–25, the rate of injury hospitalisation due to contact with people, plants and animals for First Nations people has increased by an annual average of 5% compared to an average annual increase of 2% for non-Indigenous people.
Figure 10: Age-standardised rate (ASR) of injury hospitalisations due to contact with people, plants and animals, by Indigenous status and year, 2017–18 to 2024–25
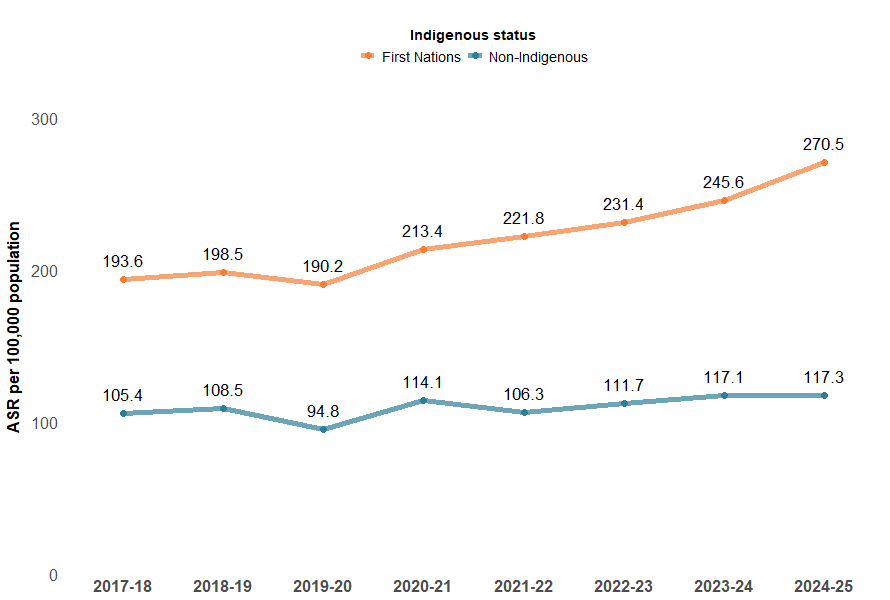
Notes:
- Age-standardised rates per 100,000 population.
- ‘Non-Indigenous’ excludes cases where Indigenous status is missing or not stated.
Sources: AIHW National Hospital Morbidity Database, ABS National, state and territory population, and ABS Estimates and Projections, Aboriginal and Torres Strait Islander Australians.
The rate of injury hospitalisations due to contact with people, plants and animals was highest among the 25–44 age group for First Nations Australians, and the 15–24 age group for non-Indigenous Australians (Figure 11). Deaths data are not presented because of small numbers.
Figure 11: Injury hospitalisations due to contact with people, plants and animals, by Indigenous status and age group, 2024–25
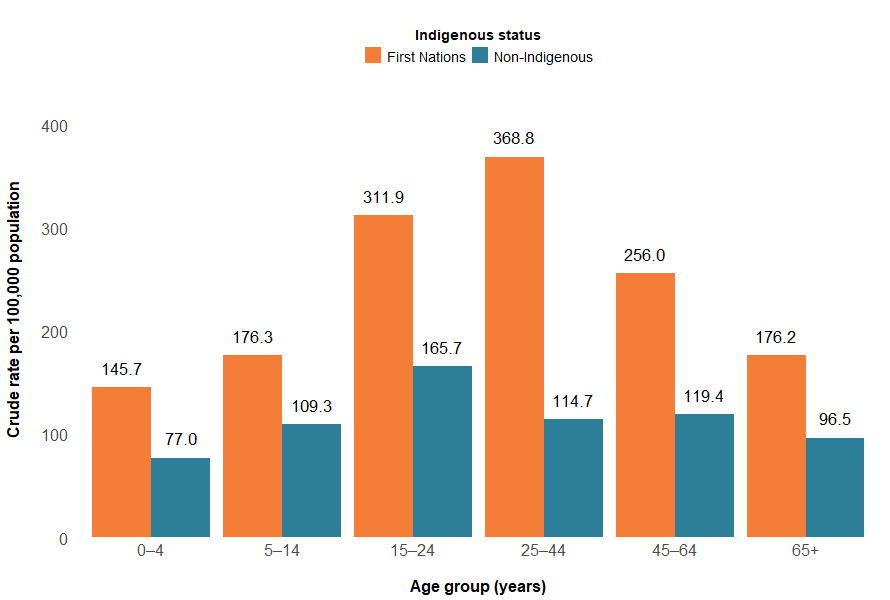
Notes:
- Crude rates per 100,000 population.
- ‘Non-Indigenous’ excludes cases where Indigenous status is missing or not stated.
Sources: AIHW National Hospital Morbidity Database, ABS National, state and territory population, and ABS Estimates and Projections, Aboriginal and Torres Strait Islander Australians.
For more detail, see supplementary data Table H6.
State and territory
The states and territories with the highest injury hospitalisation rates caused by contact with living things in 2023–24 were:
- Northern Territory (284.1 per 100,000)
- Queensland (151.9 per 100,000)
- Australian Capital Territory (144.6 per 100,000) (Figure 12).
Injury death rates cannot be reliably calculated in most states due to low numbers. In Figure 12, we show the number of such injury deaths in each state and territory in 2022–23.
Figure 12: Age-standardised rate of injury hospitalisations (2023–24), and number of injury deaths (2022–23), due to contact with living things, by state of usual residence, Australia
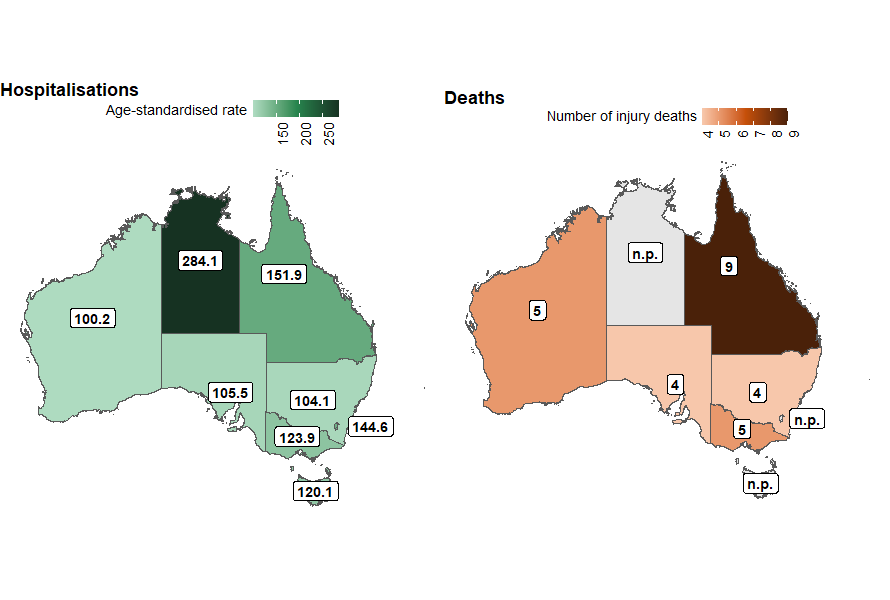
Notes:
- ‘State and territory’ refers to the state and territory of usual residence for the individual.
- Age-standardised rates per 100,000 population.
Sources: AIHW National Hospital Morbidity Database, AIHW National Mortality Database, and ABS National, state and territory population.
Remoteness
Areas of Australia which are more remote tend to have higher rates of hospitalisation and death from injury than less remote areas.
Figure 13: Age-standardised rates of injury hospitalisations due to contact with living things, by remoteness and financial year, Australia
Interactive tableau dashboard showing a line graph of the rate of injury hospitalisations caused by living things by year and remoteness.

Figure 14: Age-standardised rates of injury hospitalisations due to contact with living things, by socioeconomic areas and financial year, Australia
Interactive tableau dashboard showing a line graph of the rate of injury hospitalisations caused by contact with living things by year and socioeconomic area.
