For urgent crisis help call Lifeline  13 11 14

If at any point you feel worried about harming yourself while viewing the information on this website – or if you think someone else may be in danger – please stop reading and seek help.

Suicide is the leading cause of death for Australians aged 15–44 (AIHW 2022). Males have a higher rate of death by suicide than females, while females have a higher rate of hospitalisation due to intentional self-harm. Along with falls, intentional self-harm is one of the two major causes of hospitalisation for injury where females outnumber males.

Intentional self-harm and suicide resulted in:

26,400 hospitalisations in 2021–22

105 per 100,000 population

3,100 deaths in 2020–21

12 per 100,000 population

This represents 4.9% of injury hospitalisations and 23% of injury deaths.

Determining if an injury was intentional is not always straightforward, especially when children are involved (see the technical notes). For this reason, statistics about hospitalisations due to intentional self-harm are presented here for children aged 14 and under as a group, and statistics about suicide are not presented for children aged under 10.

Causes of injury in hospitalisations for intentional self-harm

In 2021–22, 76% of intentional self-harm hospitalisations involved pharmaceutical drugs (Table 1).

Table 1: Causes of injury in hospitalisations for intentional self-harm, 2021–22

Cause

Hospitalisations

%

Rate (per 100,000)

Poisoning involving pharmaceuticals (X60–64)

20,079

76

78.1

Sharp objects (including knives) (X78)

3,500

13

14

Poisoning involving other substances (X65–69)

959

4

3.7

Other or unspecified (X70–77, X79–84)

1,843

7

7.3

Total

26,381

100

103

Notes

  1. Rates are crude per 100,000 population, calculated using estimated resident population as at 31 December of the relevant year.
  2. Percentages may not total 100 due to rounding.
  3. Codes in brackets refer to the ICD-10-AM (11th edition) external cause codes (ACCD 2019).

Source: AIHW National Hospital Morbidity Database.

For more detail, see Data tables B27–28.

Causes of injury in deaths by suicides

In 2020–21, the most common cause of injury in deaths by suicide was hanging, strangulation and suffocation (Table 2).

Table 2: Causes of injury in deaths by suicide, 2020–21

Cause

Deaths

%

Rate (per 100,000)

Hanging, strangulation and suffocation (X70)

1,860

59

7.2

Poisoning involving pharmaceuticals (X60–64)

439

14

1.7

Jumping from a high place (X80)

155

5

0.6

Firearm discharge or explosive material (X72–75)

178

6

0.7

Other or unspecified (X65–69, X71, X76–79, X81–84)

507

16

1.9

Total

3,139

100

12.2

Notes

  1. Rates are crude per 100,000 population, calculated using estimated resident population as at 31 December of the relevant year.
  2. Percentages may not total 100 due to rounding.
  3. Codes in brackets refer to the ICD-10 external cause codes (WHO 2011).

Source: AIHW National Mortality Database.

For more detail, see Data tables E39–41.

Trends over time

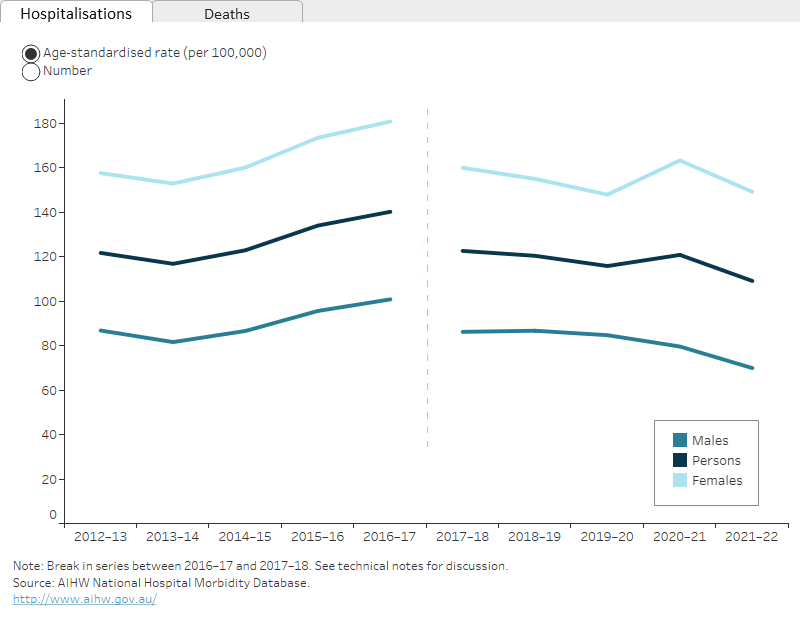
Over the period from 2017–18 to 2021–22, the age-standardised rate of hospitalisations due to intentional self-harm declined by an annual average of 2.9%. From 2012–13 to 2016–17 it increased by an average annual of 3.6%.

There is a break in the time series for hospitalisations between 2016–17 and 2017–18 due to a change in data collection methods (see the technical notes for details).

For deaths by suicide, there was an average annual increase in rate between 2011–12 and 2020–21 of 0.9% (Figure 1).

Figure 1: Hospitalisations for intentional self-harm and deaths by suicide, by sex, by year

2 matching line graphs on separate tabs, 1 for hospitalisations and 1 for deaths. The 3 lines represent the trend for males, persons and females over 10 years. The reader can choose to display rate per 100,000 population or number.

For more detail, see Data tables C1–3 and F1–4.

Seasonal differences

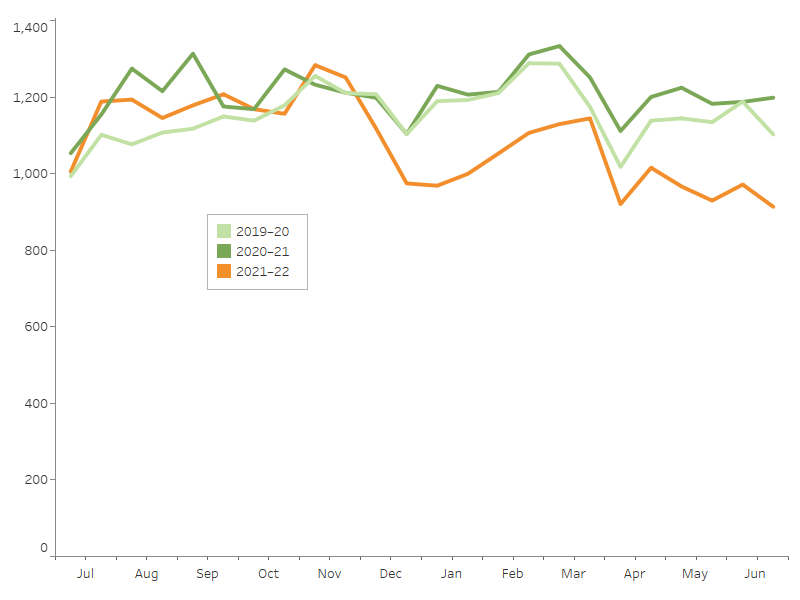
Hospitalisations due to intentional self-harm show some seasonal patterns. There are dips in December and April (Figure 2).

The interactive display illustrates other seasonal variations in injury hospitalisations.

Figure 2: Seasonal differences in hospitalisations for intentional self-harm, 2019–20 to 2021–22

3 line graph representing the trends for 2019-20, 2020-21 and 2021-22

Notes

  1. Admission counts have been standardised into two 15-day periods per month.
  2. A scale up factor has been applied to June admissions to account for cases not yet separated.

Source: AIHW National Hospital Morbidity Database.

Age and sex differences

Rates of hospitalisation and death from intentional self-harm injuries differed for males and females and across age groups (Figure 3). While rates of death by suicide are higher for males than females, intentional self-harm is one of the few causes of injury where rates of hospitalisation are higher for females than males.

For hospitalisations from intentional self-harm injuries in 2021–22:

  • 2 in 3 were for females (67%)
  • the age-standardised rates were:
    • 150 per 100,000 females and
    • 70 per 100,000 males
  • females aged 15–24 (and those aged 15–19 in particular), had the highest rates

For deaths by suicide in 2020–21:

  • 3 in 4 were for males (76%)
  • the age-standardised rates were:
    • 18 per 100,000 males and
    • 5.9 per 100,000 females
  • people aged 25–44 had the highest rates, followed by people aged 45–64, compared with other age groups.

Figure 3: Hospitalisations for intentional self-harm and deaths by suicide, by age group and sex

2 matching column graphs on separate tabs, 1 for hospitalisations and 1 for deaths. The columns represent sex within each of 5 life-stage age groups. The reader can choose to display either rate per 100,000 population or number. The default display shows rates for males and females and the reader can also choose to display persons.

For more detail, see Data tables A1–3 and D1–3.

Severity

There are many ways that the severity, or seriousness, of an injury can be assessed. Four measures of the severity of hospitalised injuries are:

  • number of days in hospital
  • time in an intensive care unit (ICU)
  • time on a ventilator
  • in-hospital deaths.

While the average number of days in hospital for intentional self-harm was lower than that for all hospitalised injuries, the percentages of self-harm cases that included time in an ICU or on continuous ventilatory support were the highest of all the main causes of hospitalised injuries. The rate of in-hospital deaths was higher than for all injuries (Table 3).

Table 3: Severity of intentional self-harm hospitalisations, 2021–22
 

Intentional self-harm

All injuries

Average number of days in hospital

3.1

4.7

% of cases with time in an ICU

10.0

2.0

% of cases involving continuous ventilatory support

7.9

1.1

In-hospital deaths (per 1,000 cases)

7.0

5.9

Note: Average number of days in hospital (length of stay) includes admissions that are transfers from 1 hospital to another or transfers from 1 admitted care type to another within the same hospital, except where care involves rehabilitation procedures.

Source: AIHW National Hospital Morbidity Database.

For more detail, see Data tables A13–15.

Aboriginal and Torres Strait Islander people

Among Aboriginal and Torres Strait Islander people:

  • there were 2,800 hospitalisations due to intentional self-harm in 2021–22 (Table 4)
  • females were 1.6 times as likely as males to be hospitalised due to intentional self-harm
  • intentional self-harm hospitalisation rates were highest in the 15–24 age group (Figure 3)
  • there were 179 deaths by suicide in 2020–21 (Table 5)
  • males were 2.7 times as likely as females to die by suicide.
Table 4: Hospitalisations for intentional self-harm by sex, Indigenous Australians, 2021–22


Males

Females

Persons

Number

1,020

1,804

2,829

Rate (per 100,000)

232

410

 322

Note: Rates are crude per 100,000 population.

Source: AIHW National Hospital Morbidity Database.

Table 5: Deaths by suicide by sex, Indigenous Australians, 2020–21


Males

Females

Persons

Number

131

48

179

Rate (per 100,000)

35

13

24

Notes:

  1. Rates are crude per 100,000 population.
  2. Deaths data only includes data for New South Wales, Queensland, Western Australia, South Australia, and the Northern Territory.

Source: AIHW National Mortality Database.

Indigenous and non-Indigenous Australians

Indigenous Australians, compared with non-Indigenous Australians (after adjusting for the difference in population age structure), were:

  • 3.2 times as likely to be hospitalised due to intentional self-harm in 2021–22 (Table 6 and Figure 3)
  • 2.7 times as likely to die by suicide in 2020–21 (Table 7).
Table 6: Age-standardised rates of hospitalisation (per 100,000) for intentional self-harm by Indigenous status and sex, 2021–22


Males

Females

Persons

Indigenous Australians

247

 392

 319

Non-Indigenous Australians

63

138

100

Notes

  1. Rates are age-standardised to the 2001 Australian population (per 100,000).
  2. ‘Non-Indigenous Australians’ excludes cases where Indigenous status is missing or not stated.

Source: AIHW National Hospital Morbidity Database.

Table 7: Age-standardised rates of suicide death (per 100,000) by Indigenous status and sex, 2020–21


Males

Females

Persons

Indigenous Australians

38

13

25

Non-Indigenous Australians

18.2

5.7

11.9

Notes

  1. Rates are age-standardised to the 2001 Australian population (per 100,000).
  2. ‘Non-Indigenous Australians’ excludes cases where Indigenous status is missing or not stated.
  3. Deaths data only includes data for New South Wales, Queensland, Western Australia, South Australia, and the Northern Territory.

Source: AIHW National Mortality Database.

The rate of hospitalisations for intentional-self harm was highest among the 15–24 life-stage age group for both Indigenous and non-Indigenous Australians (Figure 4). Deaths data are not presented because of small numbers.

Figure 4: Hospitalisations due to intentional self-harm by Indigenous status, by age group and sex, 2021–22

Column graph representing hospitalisation data for Indigenous and non-Indigenous Australians by 5 life-stage age groups. The reader can choose to display rate per 100,000 population or number. The default displays persons, and the reader can also choose to display males or females.

For more detailed data, see Data tables A4–6 and D4–6.

Remoteness

Compared to those living in other areas, people in Very remote areas had the highest age-standardised rate of hospitalisation for intentional self-harm in 2021–22 (Table 8). People in Very remote areas were 1.9 times as likely as people living in Major cities to be hospitalised due to intentional self-harm.

Table 8: Age-standardised rates (per 100,000) of hospitalisations for intentional self-harm by remoteness and sex, 2021–22
 

 Males

 Females

 Persons

Major cities

               62

             136

               99

Inner regional

               70

             160

             115

Outer regional

            101

             199

             149

Remote

            119

             238

             175

Very remote

            134

             254

             191

Note: Rates are age-standardised per 100,000 population.

Source: AIHW National Hospital Morbidity Database.

People living in Remote areas were 2.2 times as likely as people living in Major cities to die by suicide in 2020–21 (age-standardised) (Table 9).

Table 9: Age-standardised rates (per 100,000) of suicide deaths by remoteness and sex, 2020–21
 

Males

Females

Persons

Major cities

14

4.8

9

Inner regional

24

6

15

Outer regional

27

6.6

17

Remote

31

n.p.

21

Very remote

28

n.p.

21

n.p. Not publishable because of small numbers, confidentiality or other concerns about the quality of the data.
Note: Rates are age-standardised per 100,000 population.

Source: AIHW National Mortality Database.

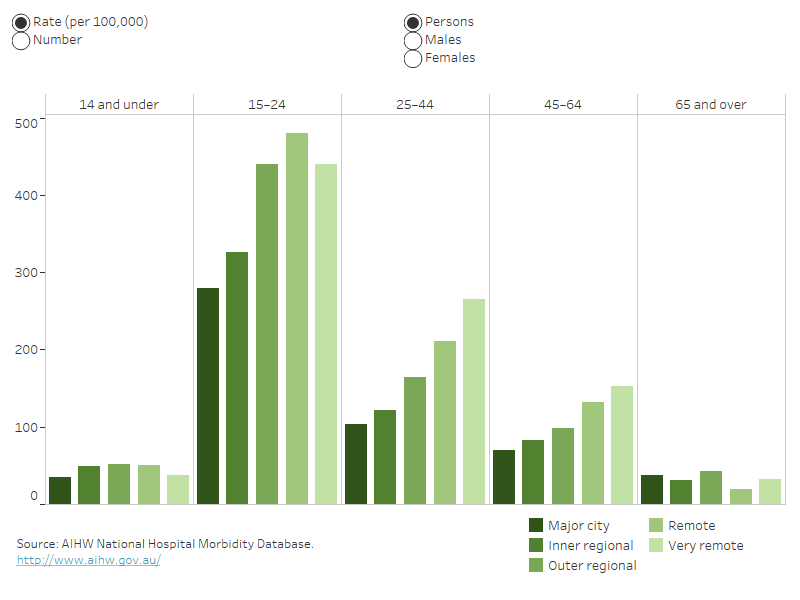
The highest rate of intentional self-harm hospitalisations was among the 15–24 life-stage age group living in Remote areas of Australia. (Figure 5).

Deaths data are not presented because of small numbers.

Figure 5: Hospitalisations due to intentional self-harm by remoteness, by age group and sex, 2021–22

Column graph representing hospitalisation data for each of the 5 remoteness categories within 5 life-stage age groups. The reader can select to display rate per 100,000 population or number. The reader can also select to display data for persons, males, or females. The default displays rate per 100,000 for persons.

For more detail, see Data tables A7–9 and D9–10.

For information on how statistics are calculated by remoteness, see the technical notes.

Data details

Technical notes: how the data were calculated

Data tables: download full data tables

Glossary