Injury in Australia:
Electricity and air pressure
Web article
Last updated:
Topic: Injury
Citation
AIHW (Australian Institute of Health and Welfare) (2026) Electricity and air pressure, AIHW, Australian Government, accessed 13 July 2026.
This article is part of Injury in Australia
Unintentional causes
Intentional causes
This article describes unintentional electricity and air pressure injuries resulting in hospitalisation or death. Intentional injuries are included under Self-harm injuries and suicide or Assault and homicide.
Deaths due to this cause are relatively rare so are described in limited detail in this article.
Injuries by type of exposure
The main categories of electricity and air pressure exposures leading to injury hospitalisation include:
- exposure to electric current: this includes incidents such as burns and other injuries resulting from contact with live wiring, sockets, or unidentified sources.
- exposure to high and low air pressure and changes in air pressure: injuries in this category may arise from situations like the rapid reduction in atmospheric pressure encountered when surfacing from deep-water diving or underground environments, or from extended periods spent at high altitudes.
- other exposures: examples include exposure to ionising radiation (such as X-rays), artificial visible and ultraviolet light (such as that produced during welding), or extreme temperatures involving excessive heat or cold (Table 1).
| Cause | Hospitalisations | Crude rate (per 100,000) |
|---|---|---|
| Exposure to electric current (W85–W87) | 407 | 1.5 |
| Exposure to high and low air pressure and changes in air pressure (W94) | 211 | 0.8 |
| Other (W88–W93, W99) | 34 | 0.1 |
| Total | 652 | 2.4 |
Source: AIHW National Hospital Morbidity Database.
Trends over time
There is a break in the time series for hospitalisations between 2016–17 and 2017–18 due to a change in data collection methods (see the technical notes for details).
The number of injury hospitalisations caused by electricity and air pressure-related injuries has generally decreased over the past decade (Figure 1). Between 2015–16 and 2024–25, the rate decreased from 3.1 to 2.4 per 100,000. The hospitalisation rate in 2024–25 was 9.8% lower than the previous 5-year average of 2.7 per 100,000 population.
Figure 1: Injury hospitalisations due to electricity and air pressure, 2015–16 to 2024–25
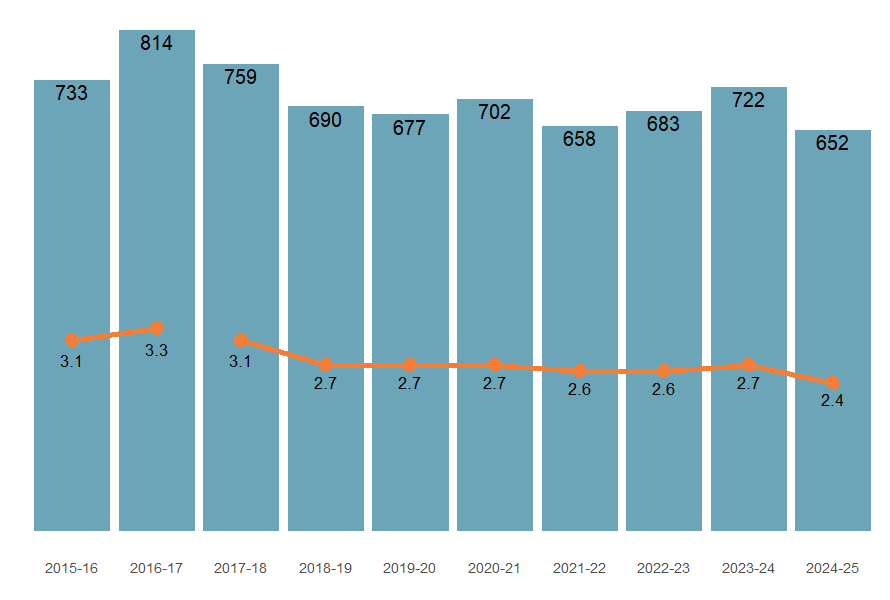
Note: Columns represent numbers of hospitalisations, the line represents crude rates per 100,000 population.
Sources: AIHW National Hospital Morbidity Database and ABS National, state and territory population.
For more detail, see supplementary data table H21.
The number of deaths caused by electricity and air pressure has fluctuated over time (Figure 2).
Figure 2: Deaths due to electricity and air pressure, 2014–15 to 2023–24
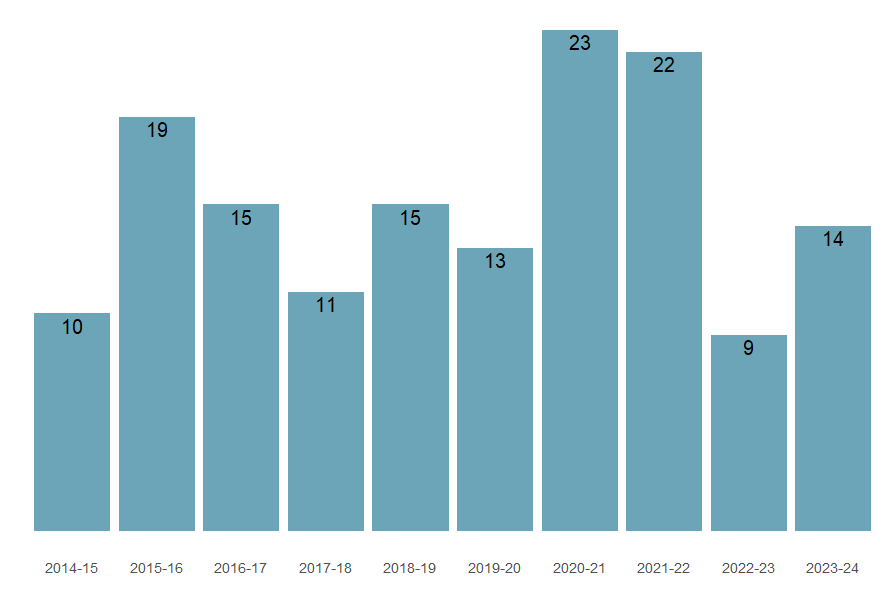
Source: AIHW National Mortality Database.
Seasonality
Injury hospitalisations related to electricity and air pressure exposures rose during spring and peaked in the early summer (Figure 3). In 2024–25, the peak for injury hospitalisations was observed in December, with 71 hospitalisations.
Figure 3: Injury hospitalisations due to electricity and air pressure by calendar month, 2024–25
An interactive tableau visualisation showing the number of injury hospitalisations by month for the most recent financial year, and the previous 5-year average.

Figure 4: Injury hospitalisations due to electricity and air pressure, age group and sex, 2015–16 to 2024–25
Tableau figure showing hospitalisations. It shows a time series of rates by age group, and by sex.

For more detail, see supplementary data tables H3 and H4.
State and territory
The states and territories with the highest rates of electricity and air pressure injury hospitalisations in 2023–24 were:
- Tasmania (39 cases, 7.5 per 100,000)
- Queensland (199 cases, 3.6 per 100,000)
- Western Australia (103 cases, 3.5 per 100,000).
Age-standardised rates for state and territories with small numbers of electricity and air pressure injuries have not been calculated.
Figure 5: Age-standardised rate (per 100,000) of electricity and air pressure injury hospitalisations (2023–24), by state or territory of usual residence, Australia
![Map of Australia showing age-standardised rate of electricity and air pressure hospitalisation by state or territory. Tasmania has the highest rate of injury.]](/getmedia/1dd5cc18-01ae-457a-b7dc-6a155089540b/TF10ElectricityStateHospCrude_2.png)
Notes:
- State and territory refers to the state and territory of usual residence for the individual.
- Age-standardised rates per 100,000 population.
Sources: AIHW National Hospital Morbidity Database, and ABS National, state and territory population.
Figure 6: Age-standardised rates of electricity and air pressure injury hospitalisations, by remoteness and financial year, Australia
Interactive tableau figure showing a line graph of the rate of electricity and air pressure hospitalisations by year and remoteness.
