Injury in Australia:
Assault and homicide
Web article
Last updated:
Topic: Injury
Citation
AIHW (Australian Institute of Health and Welfare) (2026) Assault and homicide, AIHW, Australian Government, accessed 13 July 2026.
This article is part of Injury in Australia
Unintentional causes
Intentional causes
- Assault and homicide This page
- Suicide and intentional self-harm
The Family, domestic and sexual violence website presents more detail about assault injuries in the context of family, domestic and sexual violence.
Definitions
This article describes intentional injuries caused by Assault and homicide. Assault cases may be difficult to identify and there may be barriers to reporting assault injuries, such as in family domestic and sexual violence situations.
ICD-10-AM defines the following:
- Assault (X85-Y09) is when injuries are inflicted by another person with intent to injure or kill, by any means. It includes homicide but excludes injuries due to legal interventions or operations of war. Intent cannot be assumed, it must be documented. Cases recognised as possibly being due to assault, but where doubt remains, may therefore be coded as Undetermined intent.
- Legal interventions (Y35) include injuries inflicted by the police or other law enforcement including military arrests, lawbreakers and legal executions. These are categorised and reported alongside assaults and homicides in this article.
- Operations of war (Y36) includes injuries to both military personnel and civilians caused by war and civil insurrection. These are categorised and reported alongside assaults and homicides in this article.
- Perpetrators are the party inflicting the injury and this term is used when an external cause of assault is recorded. The coding rules operate on a hierarchical basis, with requirements to code the closest relationship between the perpetrator and the victim. Injuries inflicted through legal interventions and operations of war are included in this article but do not form part of the perpetrator analysis.
Homicide in this article is used to refer to death due to an assault. Offenders refers to convicted perpetrators of homicide.
External causes of injury are not currently able to be ascertained reliably from emergency department data. For more detail, please see the Injury in Australia technical notes.
Types of assault and homicide
In 2024–25, assault by bodily force (such as an unarmed brawl or fight), assault by blunt object (such as a hammer or bat) and assault by sharp object (such as a knife, razor or glass) were the three types most often resulting in injury hospitalisations (Figure 1).
Figure 1: Assault-related injury hospitalisations by type of assault, 2024–25
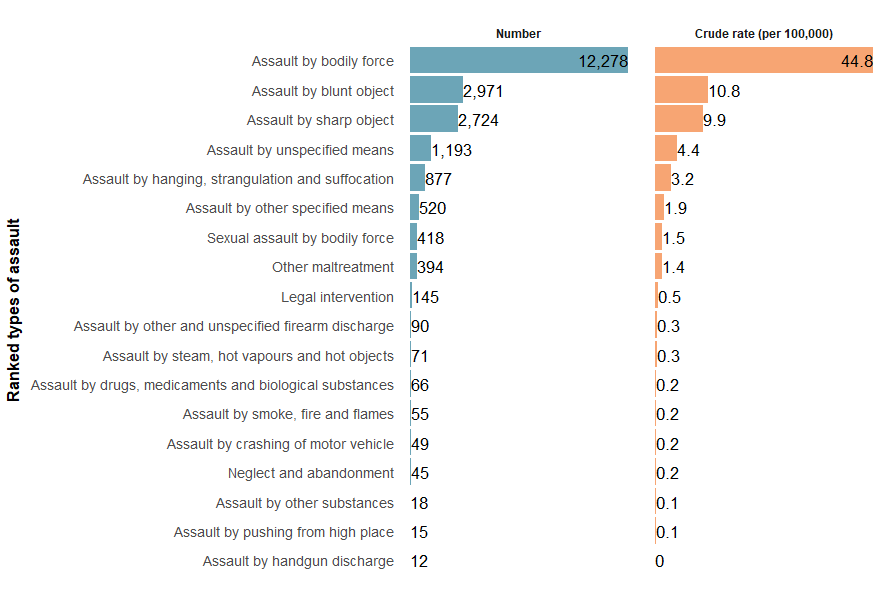
Notes: Crude rates where the numerator is less than 10 are not shown due to data volatility.
Sources: AIHW National Hospital Morbidity Database and ABS National, state and territory population.
For more detail, see the Assault and homicide supplementary data tables (Assault Tables 1 and 2).
In 2023–24, most homicide deaths were due to an assault by sharp object, assault by bodily force or assault by unspecified means (Figure 2).
Figure 2: Homicide deaths by type of assault, 2023–24
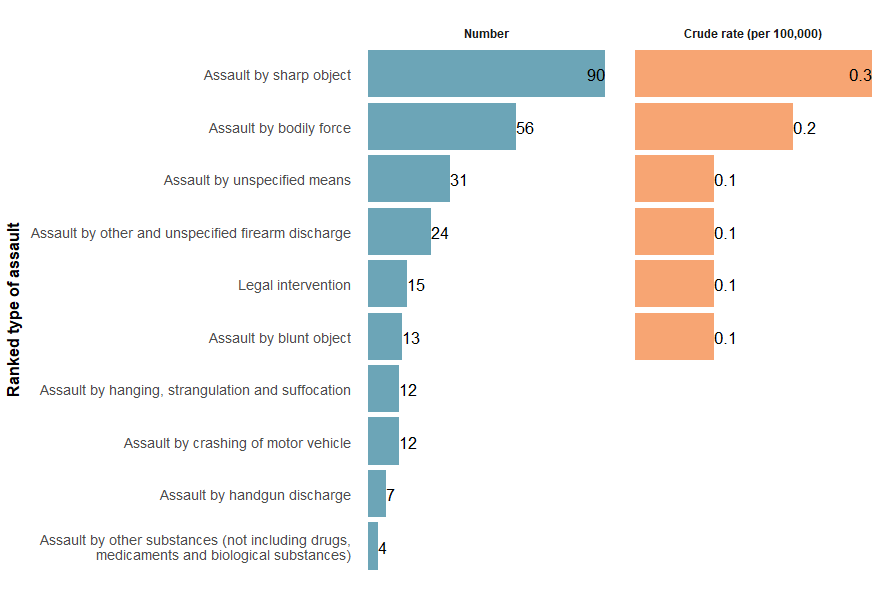
Note: Crude rates where the numerator is less than 10 are not shown due to data volatility.
Sources: AIHW National Mortality Database and ABS National, state and territory population.
For more detail, see the Assault and homicide supplementary data tables (Assault Tables 7 and 8).
Trends over time
There is a break in the time series for hospitalisations between 2016–17 and 2017–18 due to a change in data collection methods (see the technical notes for details).
Over the past decade, the likelihood of Australians being hospitalised due to assault has generally declined. The rate dropped from 84.9 per 100,000 in 2015–16 to 80.1 in 2024–25 (Figure 3). Between 2017–18 and 2024–25, this rate decreased by an average of 1.4% per year. In 2024–25, the hospitalisation rate was 3.2% lower than the previous 5-year average of 82.8 per 100,000 population.
Figure 3: Assault-related injury hospitalisations, 2015–16 to 2024–25
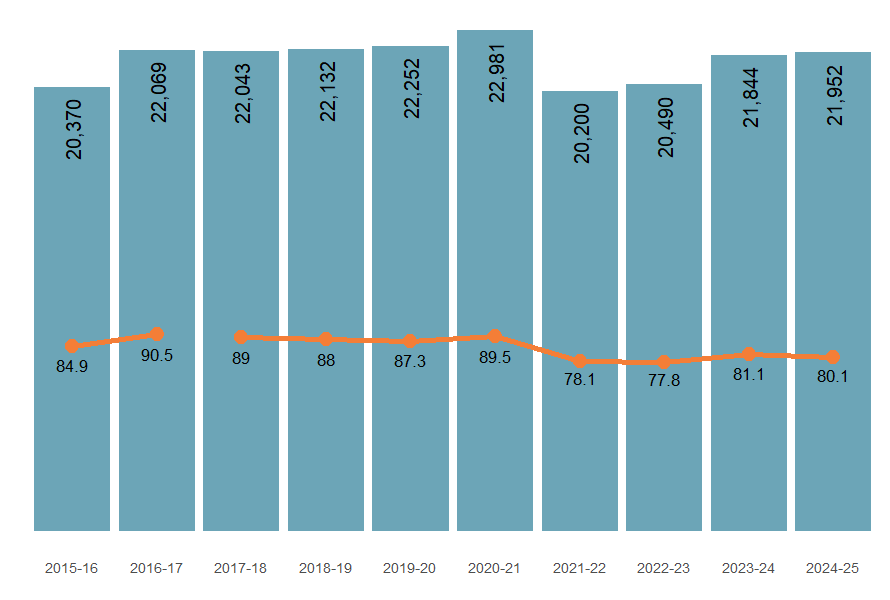
Note: Columns are number of hospitalisations, and the line graph represents crude rates per 100,000 population.
Sources: AIHW National Hospital Morbidity Database and ABS National, state and territory population.
The number of homicides has generally decreased over time. Between 2014–15 and 2023–24, the rate decreased by an average of 0.9% per year (Figure 4). In 2023–24, the rate was 4.2% higher than the previous 5-year average of 1.0 per 100,000 population.
Figure 4: Injury deaths due to homicide, 2014–15 to 2023–24
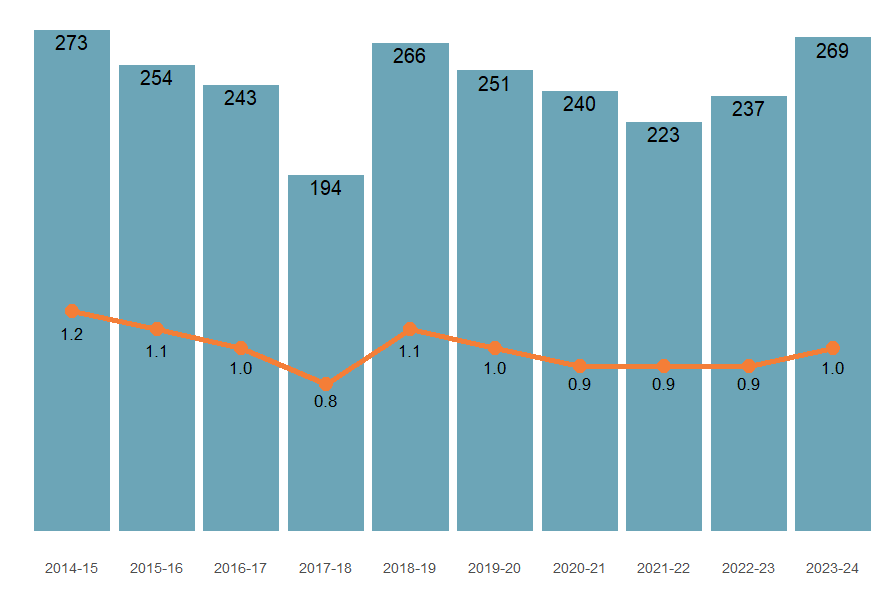
Note: Columns are number of deaths, and the line graph represents the mortality rate per 100,000 population.
Source: AIHW National Mortality Database and ABS National, state and territory population.
The trends differed depending on the type of assault and the perpetrator. Compared to the previous 5-year average, in 2024–25 hospitalisation rates:
- for assaults by unspecified means decreased by 14.1% and assaults by blunt object decreased by 7.5%
- perpetrated by a person unknown to the victim increased by 17.9% and an unspecified person decreased by 14.8%.
For homicides, assault by unspecified means increased by 25% and assault by sharp object decreased by 6.3% (Figure 5).
Perpetrator information from the latest Homicide in Australia report indicates that most offences involved a single victim and a single offender, with murder being the most frequent charge, followed by manslaughter. Female victims of homicide were most likely to be killed by intimate partners while male victims of homicide were most likely to be killed by acquaintances or had a domestic relationship with.
Figure 5: Injury hospitalisations (2015–16 to 2024–25) and deaths (2014–15 to 2023–24) by type of assault
This interactive figure displays rates of assault hospitalisations and homicides across the latest ten-year period by the type of assault.
Figure 6: Assault-related injury hospitalisations (2024–25) and deaths (2023–24) by calendar month
An interactive tableau visualisation showing the number of injury hospitalisations by month for the most recent financial year, and the previous 5-year average. Users can toggle the type of assault and perpetrator.
Figure 7: Assault-related injury hospitalisations by main body part injured, 2024–25
Interactive visualisation of body part and type of injury

Figure 8: Assault-related injury hospitalisations (2015–16 to 2024–25) and deaths (2014–15 to 2023–24) by age, sex, type of assault and perpetrator
Interactively display crude rates of assault injury hospitalisations by sex and age group by selecting different types of assault and perpetrators.
The likelihood of assault injuries differs by age and sex. Hospitalisation rates are highest among younger adults and decline as people get older for both men and women (Figure 9).
Figure 9: Assault-related injury hospitalisations (2024–25) and deaths (2023–24), by sex and age.
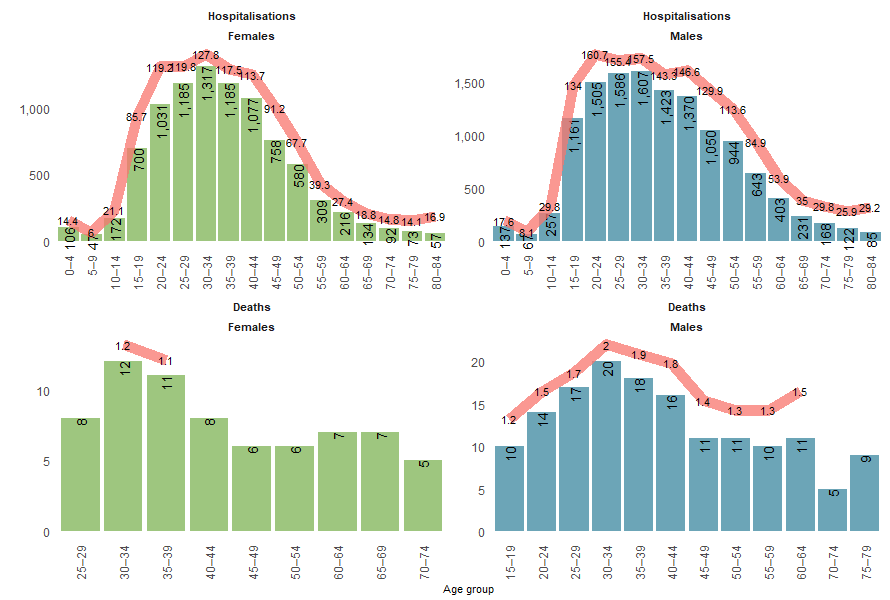
Notes:
- Columns are case counts, the line graph represents crude rate per 100,000 population.
- Age groups where the count is less than 5 are not displayed
- Crude rates based on a number of hospitalisations or deaths under 10 are not shown.
Sources: AIHW National Hospital Morbidity Database, AIHW National Mortality Database and ABS National, state and territory population.
Trends in assault injury hospitalisations vary by both sex and age, as well as the type of assault and the perpetrator. Among those assaulted, adults aged 15–44 had the highest rates of injury hospitalisations across the decade. Most assault types decreased across the decade for most age groups, with exceptions being:
- Hanging, strangulation and suffocation: increased mostly in females and 25–44-year-olds
- Sexual assaults by bodily force: increased mostly in females and 15–24-year-olds
- Assault by bodily force: decreased in males but remained stable in females, and increased among those aged 15–24 and 65 and above
Homicide in Australia reports that the most common cause of death was stab wounds from sharp objects, for both sexes, followed by blunt force trauma and gunshot wounds. Female homicide victims were more likely to die from strangulation or suffocation than males.
For more detail, see the Assault and homicide supplementary data tables (Assault Tables 1 and 2) .
First Nations people
Among Aboriginal and Torres Strait Islander (First Nations) people :
- there were 7,336 hospitalisations due to assaults in 2024–25 (699 per 100,000 persons)
- females were 1.4 times as likely as males to be assaulted and hospitalised (817.6 and 581.1 per 100,000, respectively)
- people aged 25–44 were most likely to be hospitalised due to assault (Figure 10)
- there were 36 deaths due to homicides in 2023–24 (3.5 per 100,000)
- males were twice as likely as females to die (4.6 and 2.3 per 100,000, respectively) (Table 2).
Figure 10: Assault-related injury hospitalisations among First Nations people, by age and sex, 2024–25
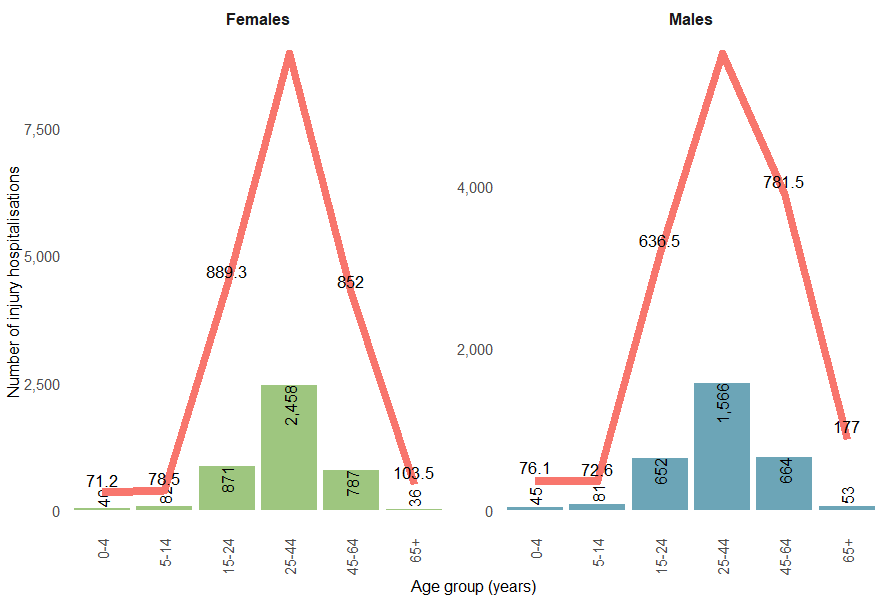
Note: Columns are case counts, the line graph represents crude rate per 100,000 population.
Sources: AIHW National Mortality Database and ABS Estimates and Projections, Aboriginal and Torres Strait Islander Australians.
Homicides
Over the past decade, the homicide mortality rate among First Nations people has increased by an average of 15.1% per year, compared with a 4.8% annual increase for non-Indigenous Australians.
Sex | Number of injury deaths | Crude rate per 100,000 population |
|---|---|---|
Females | 12 | 2.3 |
Males | 24 | 4.6 |
Persons | 36 | 3.5 |
Note: Numbers and rates are reported for the following 5 jurisdictions combined: New South Wales, Queensland, Western Australia, South Australia and the Northern Territory. These jurisdictions are considered to have adequate levels of Indigenous identification in mortality data.
Sources: AIHW National Mortality Database and ABS Estimates and Projections, Aboriginal and Torres Strait Islander Australians.
Homicide in Australia reports higher proportions of First Nations children being victims of homicide than non-Indigenous children. For more detail, see the Assault and Homicide supplementary data tables (Assault Tables 5 and 8) and Homicide in Australia.
Comparison between First Nations and non-Indigenous Australians
Between 2017–18 and 2024–25, the age-standardised rate of assault-related hospitalisations for First Nations people decreased by an average of 0.8% per year, compared with an average annual decrease of 1.9% for non-Indigenous Australians (Figure 11).
Figure 11: Assault injury hospitalisations (2017–18 to 2024–25) and homicide deaths (2017–18 to 2023–24) by Indigenous status
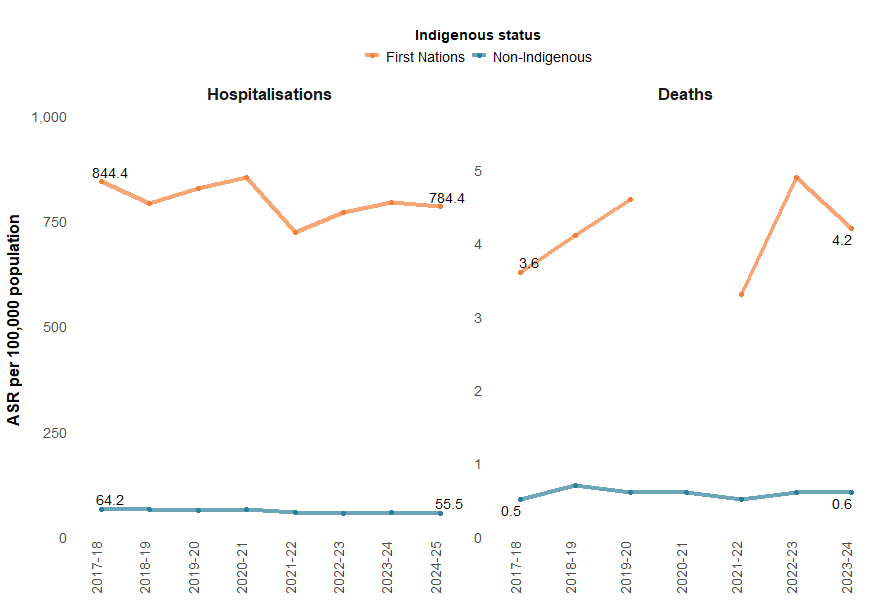
Notes:
- Age-standardised rates per 100,000 population.
- Age-standardised rates based on a number of hospitalisations or deaths under 20 are not shown.
- ’Non-Indigenous’ excludes cases where Indigenous status is missing or not stated.
- Mortality rates are reported for 5 jurisdictions combined – New South Wales, Queensland, Western Australia, South Australia and the Northern Territory. These jurisdictions are considered to have adequate levels of Indigenous identification in mortality data.
Sources: AIHW National Hospital Morbidity Database, AIHW National Mortality Database and ABS Estimates and Projections, Aboriginal and Torres Strait Islander Australians.
State and territory
The states and territories with the highest rates of assault injury hospitalisations in 2023–24 were:
- Northern Territory (1,041.4 per 100,000)
- Queensland (101.0 per 100,000)
- Western Australia (97.1 per 100,000) (Figure 12).
Rates of deaths from assault (homicide) cannot be reliably calculated in most states due to low numbers. Figure 13 shows the number of such deaths in each state and territory in 2022–23.
Figure 12: Age-standardised rate of assault injury hospitalisations (2023–24) and number of homicides (2022–23), by state or territory of usual residence, Australia

Notes:
- State and territory refers to the state and territory of usual residence for the individual.
- Age-standardised rates per 100,000 population.
Sources: AIHW National Hospital Morbidity Database, AIHW National Mortality Database, and ABS National, state and territory population.
Patterns of assault have differed across states by type of assault and perpetrator over time (Figure 13). Assault injury hospitalisations have decreased in the latest reporting year (compared to the previous 5-year average) in most states across Australia, except in Victoria, the Australian Capital Territory and the Northern Territory. Assaults by hanging, suffocation and strangulation and sexual assaults have increased across most states and territories, with assaults by unspecified means decreasing. Assaults where perpetrators were unknown to victims also increased across most states and territories.
Figure 13: Percentage difference in age-standardised rates of assault injury hospitalisations compared to the previous 5-year average, by state or territory of usual residence, Australia, 2023–24
Figure 14: Age standardised rates of assault injury hospitalisations, by remoteness, type of assault and financial year, Australia
Line graphs, which can be interacted with by choosing type of assault or perpetrator, showing higher rates of assault injury hospitalisations with increasing remoteness over the past decade.

Figure 15: Age standardised rates of assault injury hospitalisations, by socioeconomic areas, type of assault and financial year, Australia
