Injury in Australia:
Forces of nature
Web article
Last updated:
Topic: Injury
Citation
AIHW (Australian Institute of Health and Welfare) (2026) Forces of nature, AIHW, Australian Government, accessed 13 July 2026.
This article is part of Injury in Australia
Unintentional causes
Intentional causes
-

Injuries caused by exposure to excessive natural heat (538 hospitalisations and 31 deaths)
Types of exposure
In 2024–25, exposure to excessive natural heat was the leading cause of injury hospitalisations related to forces of nature. The next most frequent causes were exposure to sunlight and exposure to excessive natural cold (Figure 1).
Figure 1: Injury hospitalisations due to forces of nature, by type of exposure, 2024–25
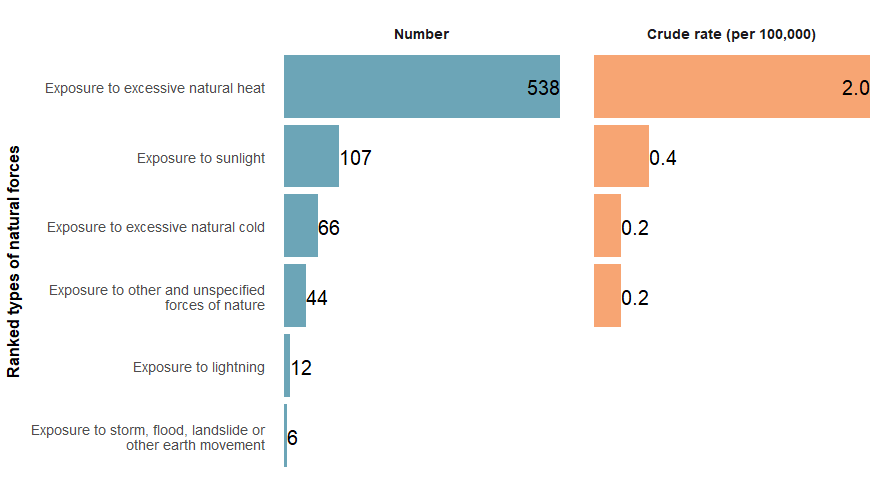
Source: AIHW National Hospital Morbidity Database and ABS National, state and territory population.
In 2023–24, most deaths from forces of nature were due to exposure to excessive natural heat, followed by exposure to excessive natural cold (Figure 2).
Figure 2: Causes of injury deaths due to forces of nature, 2022–23
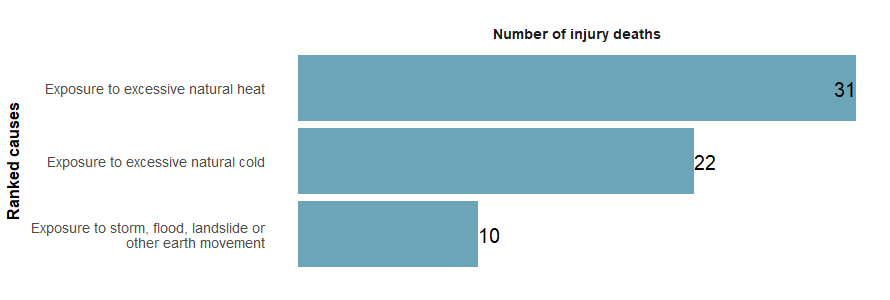
Note: Rates are not shown due to small numbers and data volatility.
Sources: AIHW National Mortality Database and ABS National, state and territory population.
Trends over time
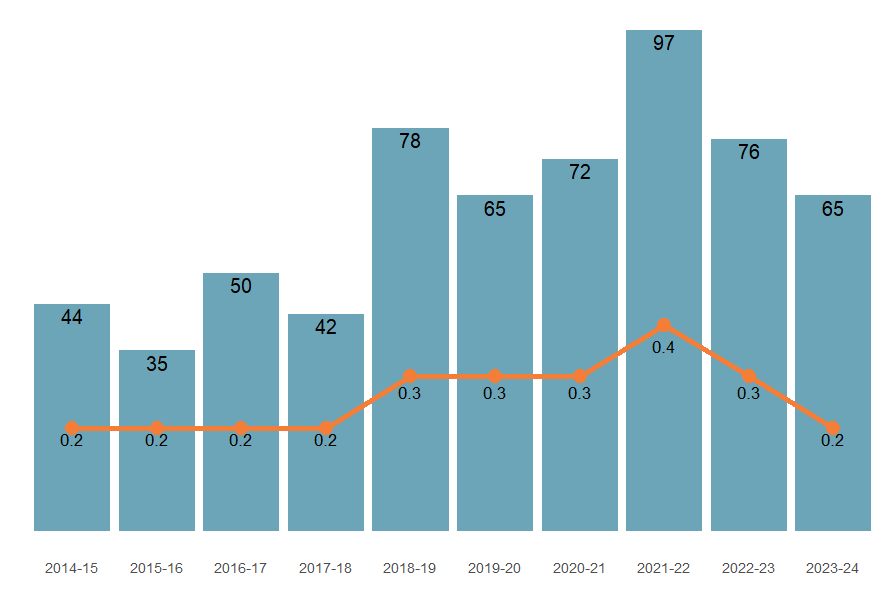
There is a break in the time series for hospitalisations between 2016–17 and 2017–18 due to a change in data collection methods (see the technical notes for details).
Over the past decade, the rate of injury hospitalisations due to exposure to forces of nature has fluctuated, ranging from 2.4 to 3.5 per 100,000 (Figure 3). The hospitalisation rate in 2024–25 was comparable to the previous 5-year average rate of 2.9 per 100,000 population.
Figure 3: Injury hospitalisations due to forces of nature, 2015–16 to 2024–25

Note: Columns represent the number of hospitalisations, the line graph represents the crude rate per 100,000 population.
Sources: AIHW National Hospital Morbidity Database and ABS National, state and territory population.
The number of injury deaths from forces of nature gradually increased between 2014–15 and 2021–22 and then decreased over the next 2 years. In 2023–24 the mortality rate was the lowest it had been since 2017–18 (Figure 4).
Figure 4: Injury deaths due to forces of nature, 2014–15 to 2023–24
Note: Columns are the number of deaths, the line graph represents the crude mortality rate per 100,000 population
Sources: AIHW National Mortality Database and ABS National, state and territory population.
Seasonality
Both hospitalisations and deaths from injuries caused by forces of nature increase over summer, accounting for more than half of injury hospitalisations (57%) (Figure 5). The number of hospitalisations in the 2024–25 summer was higher overall than the previous 5-year average, particularly in December.
Figure 5: Injury hospitalisations due to forces of nature by calendar month, 2024–25
An interactive tableau visualisation showing the number of injury hospitalisations by month for the most recent financial year, and the previous 5-year average.

Figure 6: Injury hospitalisations due to forces of nature, by type of injury, age and sex, 2015–16 to 2024–25
Interactive Tableau dashboard with showing hospitalisations. The dashboard shows a time series of rates by age group, and by sex.

First Nations people
Among Aboriginal and Torres Strait Islander (First Nations) people:
- there were 58 injury hospitalisations due to forces of nature in 2024–25
- males were 1.5 times as likely as females to be hospitalised (6.6 and 4.4 per 100,000 population respectively)
- hospitalisation rates were highest among people aged 65 and over.
Comparison between First Nations and non-Indigenous Australians
Compared with non-Indigenous Australians, First Nations people were 2.9 times as likely to be hospitalised due to an injury caused by forces of nature in 2024–25.
Between 2017–18 and 2024–25, First Nations hospitalisation rates due to forces of nature declined overall, with spikes in 2021–22 and 2024–25 not seen among non-Indigenous Australians (Figure 7).
Figure 7: Injury hospitalisations due to forces of nature, by Indigenous status, 2017–18 to 2024–25
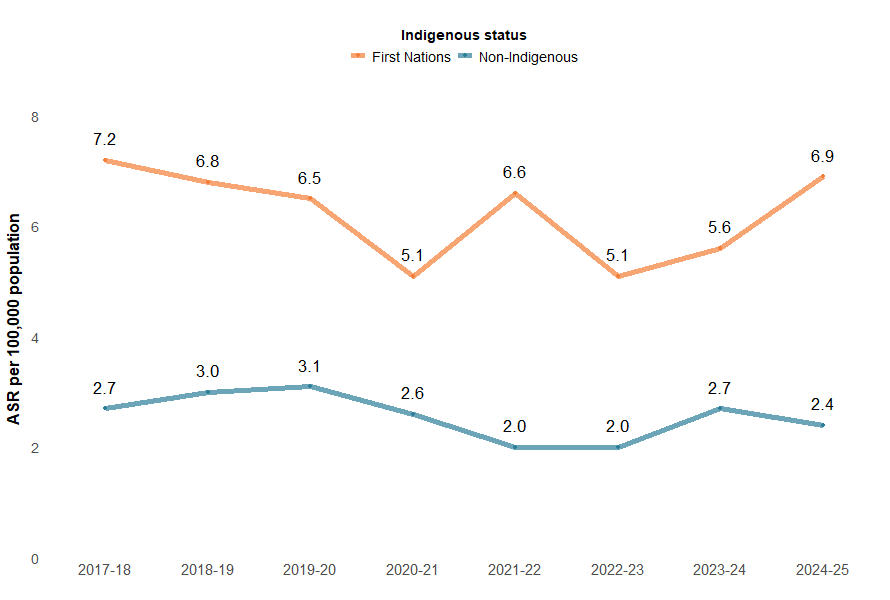
Notes:
- Age-standardised rates per 100,000 population.
- ‘Non-Indigenous people’ excludes cases where Indigenous status is missing or not stated.
Sources: AIHW National Hospital Morbidity Database and ABS Estimates and Projections, Aboriginal and Torres Strait Islander Australians.
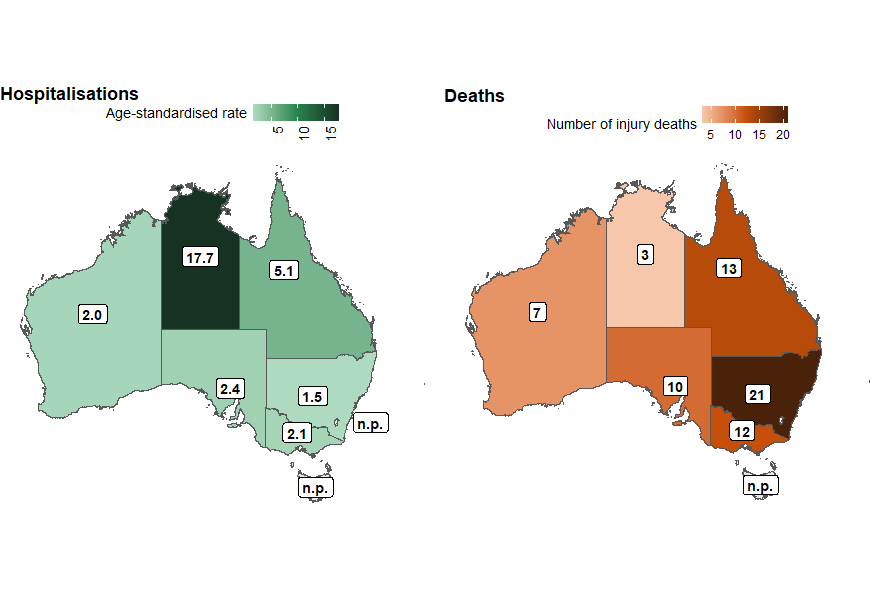
State and territory
The states and territories with the highest rates of forces of nature injury hospitalisation in 2023–24 were:
- Northern Territory (17.7 per 100,000)
- Queensland (5.1 per 100,000)
- South Australia (2.4 per 100,000).
Rates of forces of nature injury deaths cannot be reliably calculated in most states due to low numbers. Figure 8 shows the number of deaths in each state and territory in 2022–23.
Figure 8: Age-standardised rate of forces of nature injury hospitalisations (2023–24) and number of deaths (2022–23), by state or territory of usual residence, Australia
Notes:
- ‘State and territory’ refers to the state and territory of usual residence for the individual.
- Age-standardised rates per 100,000 population.
Sources: AIHW National Hospital Morbidity Database, AIHW National Mortality Database, and ABS National, state and territory population.
Remoteness
Areas of Australia which are more remote tend to have higher rates of hospitalisation and death from injury than less remote areas. Compared to people living in Major cities, people living in Outer Regional areas were 3.3 times as likely to be hospitalised for an injury caused by exposure to forces of nature in 2023–24 (Figure 9). Remote and Very remote areas are not shown in Figure 9 due to small numbers.
Figure 9: Age-standardised rates of forces of nature injury hospitalisations, by remoteness and financial year, Australia
Interactive tableau dashboard showing a line graph of the rate of forces of nature hospitalisations by year and remoteness.

Figure 10: Age-standardised rates of forces of nature injury hospitalisations, by socioeconomic areas and financial year, Australia,
Interactive tableau dashboard showing a line graph of the rate of forces of nature hospitalisations by year and socioeconomic area.
