This article is part of Injury in Australia
Unintentional causes
Intentional causes
Definitions
This article describes unintentional fall-related injuries resulting in hospitalisation or death. Intentional injuries are included under Self-harm injuries and suicide or Assault and homicide.
External causes of injury are not currently able to be ascertained reliably from emergency department data. For more detail, please see the Injury in Australia technical notes.
Types of falls
In 2024–25, fall on same level from slipping, tripping and stumbling was most commonly associated with injury hospitalisations (Figure 1). However, a large number of falls were recorded as other fall on same level or unspecified fall.
Figure 1: Fall-related injury hospitalisations by type of fall, 2024–25
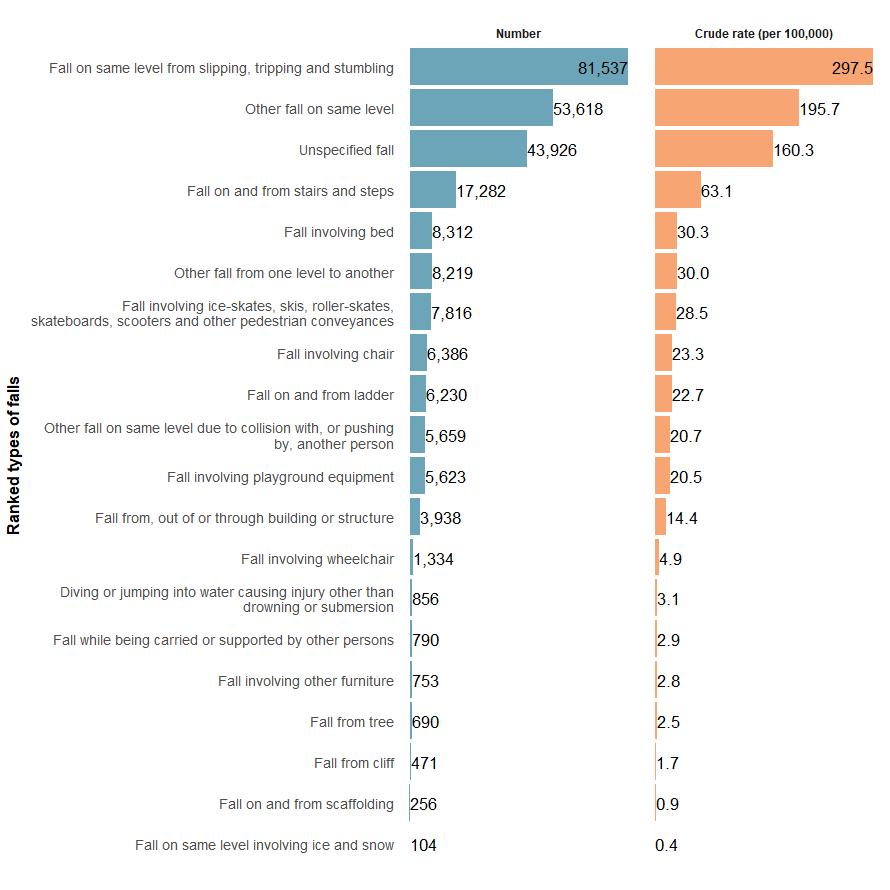
Notes:
- Crude rate per 100,000 persons.
- Only fall types with more than 100 hospitalisations are shown.
Sources: AIHW National Hospital Morbidity Database and ABS National, state and territory population.
For some fall types, further detail about the fall can be ascertained. Table 1 presents the 10 most frequently recorded detailed fall types responsible for injury hospitalisations in 2024–25.
Type of fall | Detail of type | Hospitalisations | Crude rate |
|---|---|---|---|
Fall on same level from slipping, tripping and stumbling (W01) | Tripping | 45,866 | 167.4 |
Other fall on same level (W18) | Unspecified fall on same level | 31,218 | 113.9 |
Fall on same level from slipping, tripping and stumbling (W01) | Slipping | 22,763 | 83.1 |
Other fall on same level (W18) | Other specified fall on same level | 19,942 | 72.8 |
Fall on and from stairs and steps (W10) | Unspecified stairs and steps | 16,596 | 60.6 |
Fall on same level from slipping, tripping and stumbling (W01) | Stumbling | 12,905 | 47.1 |
Fall involving bed (W06) | Involving unspecified bed | 6,905 | 25.2 |
Other fall from one level to another (W17) | Other specified fall from one level to another | 6,514 | 23.8 |
Fall on and from ladder (W11) | Fall on and from ladder | 6,230 | 22.7 |
Other fall on same level due to collision with, or pushing by, another person (W03) | Collision with or pushing by another person | 5,659 | 20.7 |
Notes:
- Crude rates per 100,000 population.
- Hospitalisations where the fall type was unspecified have been excluded from this ranked table.
Source: AIHW National Hospital Morbidity Database.
For more detail, see Falls supplementary data tables (Falls table 7).
The specific causes of fatal falls remain unclear. In 2023–24, most fall-related injury deaths were recorded as either unspecified falls or as other fall excluded from above (Figure 2).
Figure 2: Injury deaths by type of fall, 2023–24
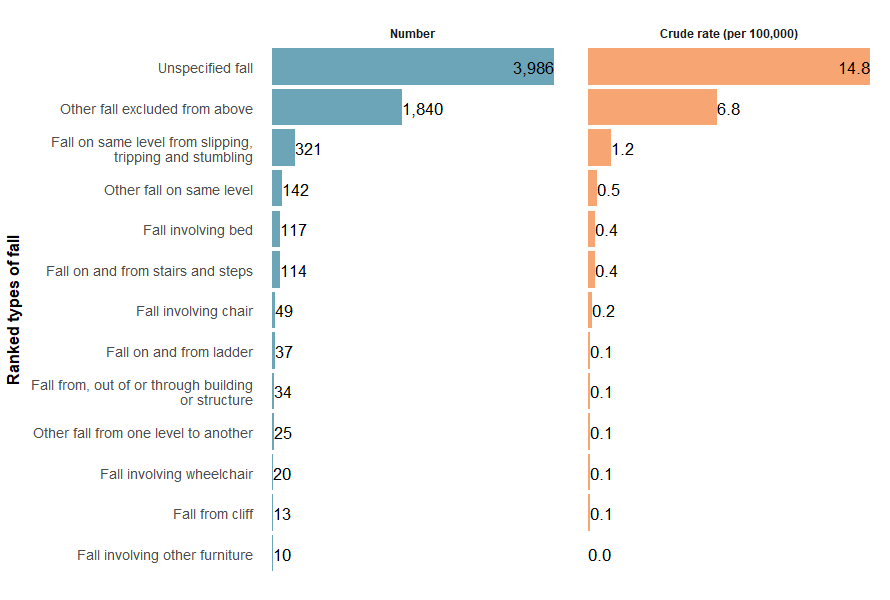
Note: Only fall types with over 10 injury deaths are included.
Sources: AIHW National Mortality Database and ABS National, state and territory population.
For more detail, see Falls supplementary data tables (Falls Table 12).
Fall injuries over time
There is a break in the time series for hospitalisations between 2016–17 and 2017–18 due to a change in data collection methods (see the technical notes for details).
Over the past decade, the rate of fall injury hospitalisations has gradually increased, with the rate ranging from 848.7 to 926.1 per 100,000 between 2015–16 and 2024–25 (Figure 3). The hospitalisation rate in 2024–25 was 1.7% higher than the previous 5-year average of 910.5 per 100,000 population.
Figure 3: Fall-related injury hospitalisations, 2015–16 to 2024–25
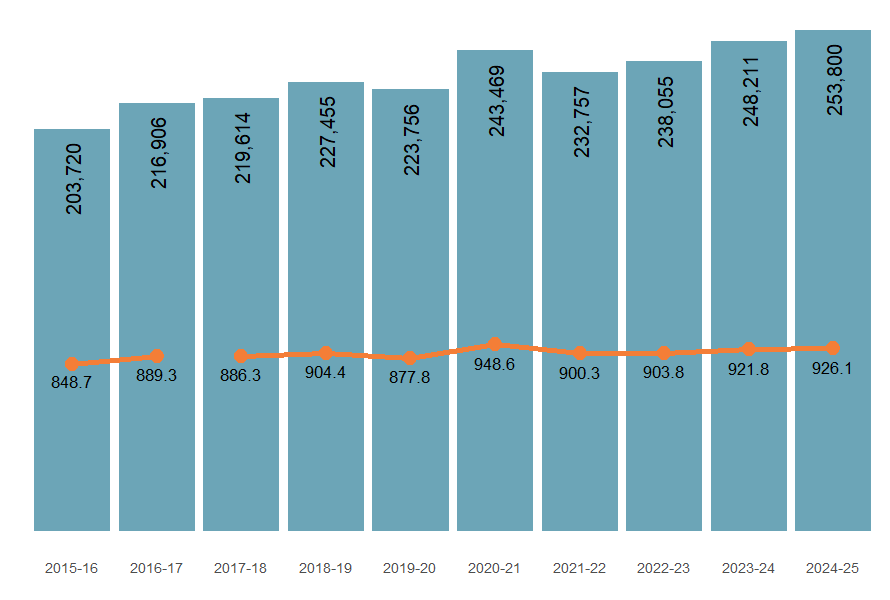
Notes:
- Columns are case counts, while the line graph represents crude rates per 100,000.
- Break in series between 2016–2017 and 2017–18. See technical notes for detail.
Sources: AIHW National Hospital Morbidity Database and ABS National, state and territory population.
The number of injury deaths caused by falls is increasing. For fall deaths in 2023–24, the crude rate was 7.1% higher than the previous 5-year average rate of 23.3 per 100,000 population (Figure 4).
Figure 4: Fall-related injury deaths, 2014–15 to 2023–24
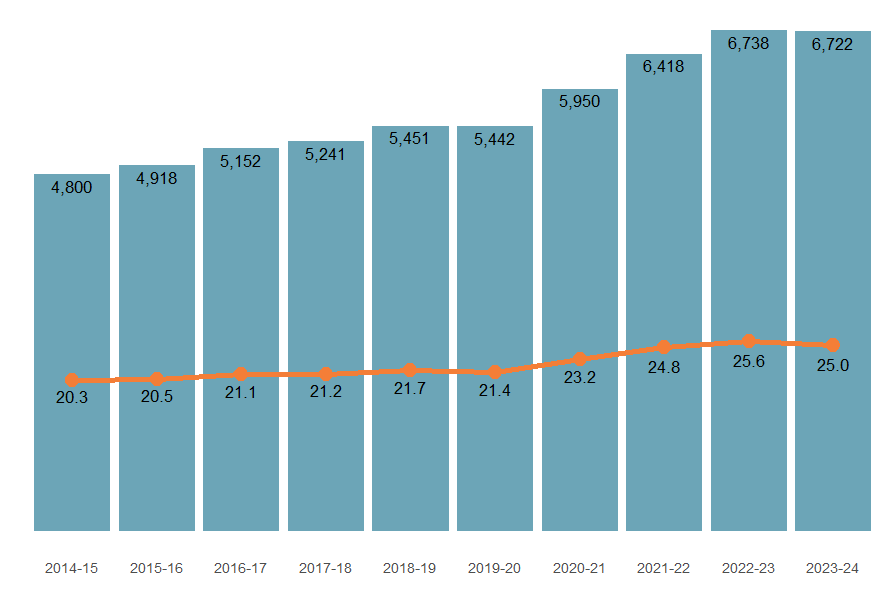
Note: Columns are case counts, while the line graph represents crude rates per 100,000 population.
Sources: AIHW National Mortality Database and ABS National, state and territory population.
Trends varied by fall type (Figure 5). Hospitalisation rates from same-level falls, slips, trips and stumbles rose by 4.8%, and other same-level falls increased by 3.6%, compared to the previous five-year average. However, injury mortality rates for these incidents fell by 7.7%.
Figure 5: Injury hospitalisations (2015–16 to 2024–25) and deaths (2014–15 to 2023–24) by type of fall
An interactive tableau visualisation showing the number of injury hospitalisations fall type over the past decade. Users can toggle the type of fall.
Figure 6: Fall-related injury hospitalisations (2024–25) and deaths (2023–24) by calendar month
An interactive tableau visualisation showing the number of injury hospitalisations by month for the most recent financial year, and the previous 5-year average. Users can toggle the type of fall.
Figure 7: Fall-related injury hospitalisations by main body part injured, 2024–25
An interactive tableau visualisation showing human figure with injury hospitalisation data for each body part. The head and neck reported the highest number of injury cases.

In 2024–25, the types of falls with higher rates in males were:
- involving outdoor activities such as diving or falling from cliffs or trees
- that may involve outdoor work, including falls from ladders, scaffolding or other building structures
- involving wheelchairs, skates or pedestrian conveyances
- involving changes of level or collisions or pushing by other people
(see Figure 8 for more details)
In 2024–25, the types of falls with higher rates in females were:
- involving beds and chairs, or being carried by another person
- involving slips, trips, stumbles, steps and stairs or the same level
- where further detail was unspecified
(see Figure 8 for more details)
Figure 8: Fall-related injury hospitalisations (2015–16 to 2024–25) and deaths (2014–15 to 2023–24) by type of fall, age and sex
Interactive Tableau dashboard with a hospitalisation, and a deaths tab. Each tab shows a time series of rates by age group, and by sex. Users can toggle to select the specific type of fall being shown on the dashboard.
Common types of falls among younger people
Most falls in people aged under 15 years occur among males, and falls involving playground equipment was the top ranked cause of hospitalisation for both sexes.
Type of fall | Age group | Sex | Hospitalisations | Crude rate |
|---|---|---|---|---|
Fall involving playground equipment (W09) | 5–9 | Females | 1,623 | 207.9 |
Fall involving playground equipment (W09) | 5–9 | Males | 1,563 | 189.1 |
Other fall on same level (W18) | 10–14 | Males | 944 | 109.4 |
Other fall on same level due to collision with, or pushing by, another person (W03) | 10–14 | Males | 944 | 109.4 |
Fall involving ice-skates, skis, roller-skates, skateboards, scooters and other pedestrian conveyances (W02) | 10–14 | Males | 867 | n.p. |
Notes:
- Unspecified fall types are excluded from this table.
- Crude rate is presented per 100,000 population.
Source: AIHW National Hospital Morbidity Database.
Common types of falls among people of working ages
This section presents data for individuals of working age, categorised into groups: 15 to 49 years and 50 to 64 years.
In 2024–25, males aged 15 to 19 had the highest hospitalisation rate for falls among people aged 15 to 49, due to collisions with or being pushed by another person, at 130.9 per 100,000 population (Table 5a).
For those age 50 to 64, females aged 60–64 had the highest rate, from same-level slips, trips and stumbles, at 474.6 per 100,000 population (Table 5b).
Type of fall | Age group | Sex | Hospitalisations | Crude rate |
|---|---|---|---|---|
Other fall on same level due to collision with, or pushing by, another person (W03) | 15–19 | Males | 1,134 | 130.9 |
Fall on same level from slipping, tripping and stumbling (W01) | 45–49 | Females | 1,040 | 125.1 |
Fall on same level from slipping, tripping and stumbling (W01) | 40–44 | Females | 876 | 92.5 |
Fall on same level from slipping, tripping and stumbling (W01) | 35–39 | Females | 746 | 74.0 |
Fall on same level from slipping, tripping and stumbling (W01) | 30–34 | Females | 700 | n.p. |
Notes:
- Unspecified fall types are excluded from this table.
- Crude rate is presented per 100,000 population.
Source: AIHW National Hospital Morbidity Database.
Type of fall | Age group | Sex | Hospitalisations | Crude rate |
|---|---|---|---|---|
Fall on same level from slipping, tripping and stumbling (W01) | 60–64 | Females | 3,739 | 474.6 |
Fall on same level from slipping, tripping and stumbling (W01) | 55–59 | Females | 2,508 | 318.8 |
Fall on same level from slipping, tripping and stumbling (W01) | 50–54 | Females | 1,825 | 212.9 |
Fall on same level from slipping, tripping and stumbling (W01) | 60–64 | Males | 1,616 | 216.2 |
Other fall on same level (W18) | 60–64 | Females | 1,450 | 184.0 |
Notes:
- Unspecified fall types are excluded from this table
- Crude rate is presented per 100,000 population
Source: AIHW National Hospital Morbidity Database.
Common types of falls among people aged 65+
In 2024–25, the most common types of falls resulting in hospitalisation among people aged 65 and over were same-level slips, trips and stumbles (Table 6).
Type of fall | Age group | Sex | Hospitalisations | Crude rate |
|---|---|---|---|---|
Fall on same level from slipping, tripping and stumbling (W01) | 85+ | Females | 12,723 | 3,605.2 |
Other fall on same level (W18) | 85+ | Females | 10,545 | 2,988.1 |
Fall on same level from slipping, tripping and stumbling (W01) | 80–84 | Females | 7,382 | 2,190.3 |
Fall on same level from slipping, tripping and stumbling (W01) | 75–79 | Females | 7,240 | n.p. |
Fall on same level from slipping, tripping and stumbling (W01) | 85+ | Males | 7,043 | 2,948.2 |
Notes:
- Unspecified fall types are excluded from this table
- Crude rate is presented per 100,000 population
Source: AIHW National Hospital Morbidity Database.
For more detail, see Falls supplementary data tables (Fall Table 1).
First Nations people
Among Aboriginal and Torres Strait Islander (First Nations) people (Figure 9):
- there were 9,346 hospitalisations due to falls in 2024–25 (890.5 per 100,000)
- the hospitalisation rate was similar for males and females (890.1 and 890.8 per 100,000 population, respectively)
- hospitalisation rates were highest among people aged 65 and over
- there were 73 deaths due to falls in 2023–24 (7.1 per 100,000)
- the mortality rate was similar for males and females (7.4 and 6.8 per 100,000 population, respectively) (Table 7).
Figure 9: Fall-related injury hospitalisations among First Nations people, by age and sex, 2024–25
Note: Numbers and crude rates of injury hospitalisation are represented in columns and as a line graph by financial years. Columns are case counts, while the line graph represents crude rates per 100,000.
Source: AIHW National Hospital Morbidity Database and ABS Estimates and Projections, Aboriginal and Torres Strait Islander Australians.
Sex | Number of injury deaths | Mortality rate (per 100,000 population) |
|---|---|---|
Males | 38 | 7.4 |
Females | 35 | 6.8 |
Persons | 73 | 7.1 |
Notes:
- Crude rates per 100,000 population.
- Deaths data only includes data for New South Wales, Queensland, Western Australia, South Australia, and the Northern Territory, as these jurisdictions are considered to have adequate levels of Indigenous identification in mortality data.
Source: AIHW National Mortality Database and ABS Estimates and Projections, Aboriginal and Torres Strait Islander Australians.
For more detail, see Falls supplementary data tables (Falls Table 5).
Comparison between First Nations and non-Indigenous Australians
First Nations people, when compared with non-Indigenous Australians, were:
Figure 10: Fall-related injury hospitalisations (2017–18 to 2024–25) and deaths (2017–18 to 2023–24) by Indigenous status
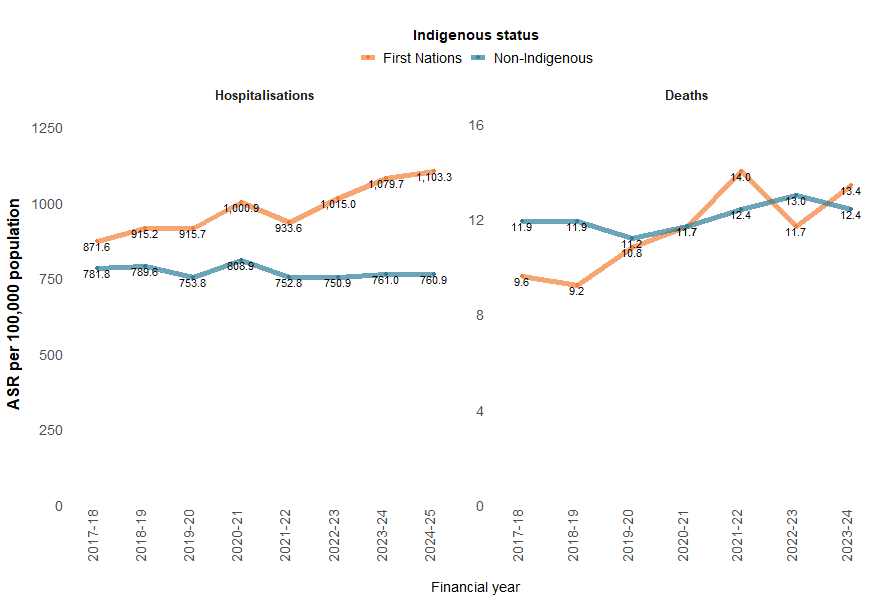
Notes:
- Age-standardised rate per 100,000 population.
- 'Non-Indigenous’ excludes cases where Indigenous status is missing or not stated.
- Deaths data only includes data for people whose usual residence was New South Wales, Queensland, Western Australia, South Australia, and the Northern Territory, as these jurisdictions are considered to have adequate levels of Indigenous identification in mortality data.
Sources: AIHW National Hospital Morbidity Database, AIHW National Mortality Database and ABS Estimates and Projections, Aboriginal and Torres Strait Islander Australians.
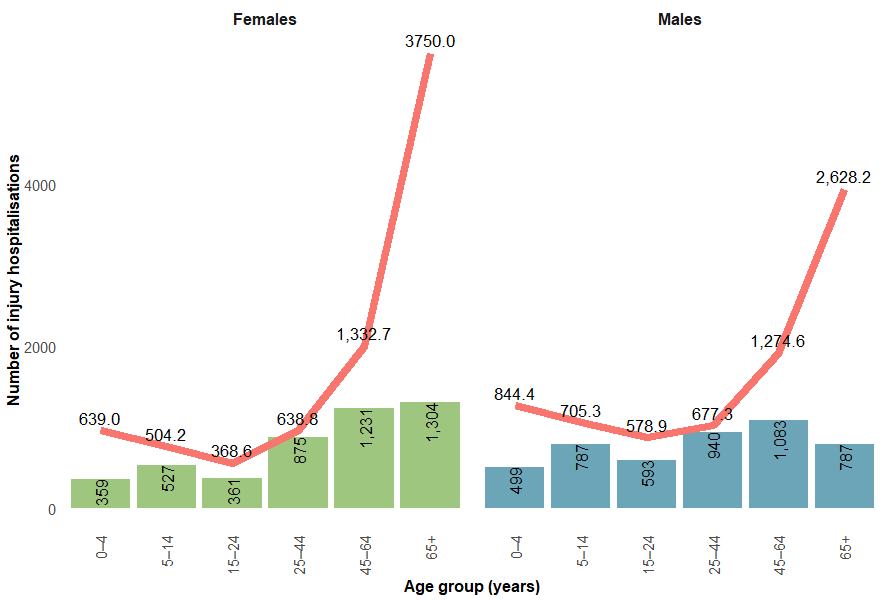
The highest rate of fall-related injury hospitalisations was seen in the 65 and over age group for both First Nations and non-Indigenous Australians. However, for all other age groups, the rate was higher among First Nations people (Figure 11). Deaths data are not presented because of small numbers.
Figure 11: Injury hospitalisations caused by falls, by Indigenous status and age group, 2024–25
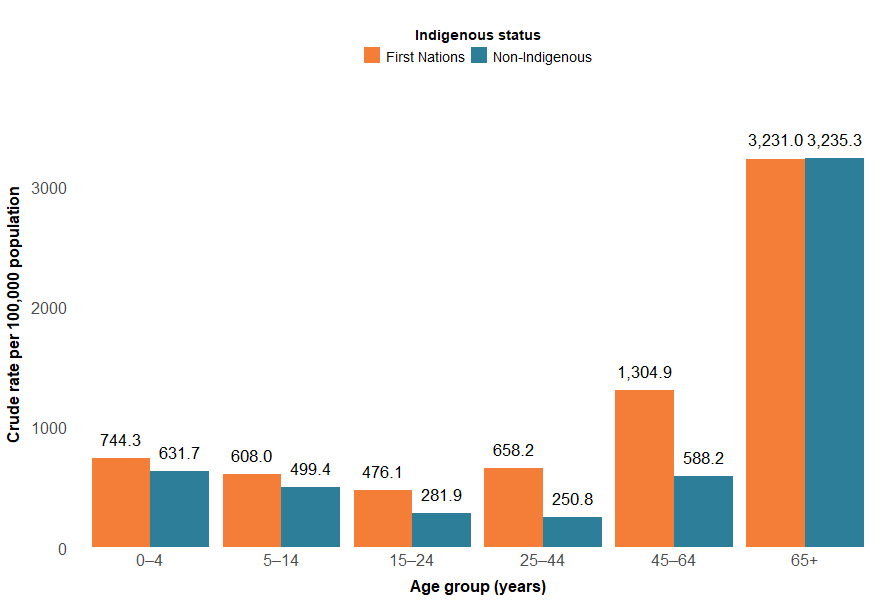
Notes:
- Rates are crude per 100,000 population.
- ‘Non-Indigenous Australians’ excludes cases where Indigenous status is missing or not stated.
Sources: AIHW National Hospital Morbidity Database and ABS Estimates and Projections, Aboriginal and Torres Strait Islander Australians.
For more detail, see Supplementary data table H6.
State and territory
The states and territories with the highest rates of fall injury hospitalisations in 2023–24 were:
- Northern Territory (1,264.6 per 100,000)
- Australian Capital Territory (970.0 per 100,000)
- Queensland (908.8 per 100,000).
The states and territories with the highest rates of fall injury death in 2023–24 were:
- Tasmania (20.1 per 100,000)
- Western Australia (19.7 per 100,000)
- Northern Territory (19.0 per 100,000) (Figure 12).
Figure 12: Age-standardised rates of fall injury hospitalisations (2023–24) and deaths (2022–23), by state or territory of usual residence, Australia
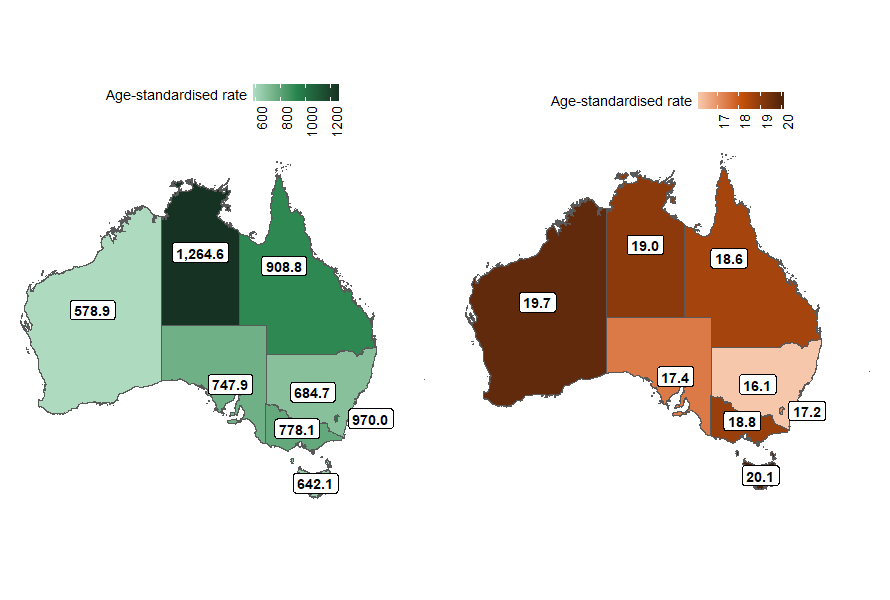
Notes:
- State and territory refers to the state and territory of usual residence for the individual.
- Age-standardised rates per 100,000 population.
Sources: AIHW National Hospital Morbidity Database, AIHW National Mortality Database, and ABS National, state and territory population.
Most states and territories recorded a decrease in age-standardised hospitalisation rates for most fall types compared to the previous 5-year average (Figure 13).
Exceptions include:
- Northern Territory: a 39% increase for falls involving a wheelchair, rising from 16 to 22.2 per 100,000 in 2023–24.
- Australian Capital Territory:
- a 23% increase for falls on same level from slipping, tripping and stumbling, from 245.2 to 301.6 per 100,000 in 2023–24.
- an 11% increase for other same level falls from, 172.0 to 191.0 per 100,000 in 2023–24.
Most states and territories showed an increase in death rates for most fall types compared to the previous 5-year average (Figure 13).
- Queensland had an increase of just over 11% in age-standardised death rates, increasing from 16.7 to 18.6 per 100,000 in 2022–23.
- Western Australia had an increase of about 10% in age-standardised death rates, increasing from 18.0 to 19.7 per 100,000 in 2022–23.
- South Australia’s age-standardised death rates increased by just under 8%, from 15 to 16.1 per 100,000 in 2022–23.
Figure 13: Percentage difference in age-standardised rates of fall injury hospitalisations (2023–24) and deaths (2022–23) compared to the previous 5-year average, by state or territory of usual residence, Australia
Maps of Australia showing age-standardised rate of fall hospitalisation changes by state or territory.
Figure 14: Age-standardised rates of fall injury hospitalisations, by remoteness, type of fall and financial year, Australia
Interactive tableau dashboard showing a line graph of the rate of fall hospitalisations and deaths by year and remoteness. There are two tabs - one for hospitalisations, and one for deaths. Users can toggle to select different types of fall to display.

Figure 15: Age-standardised rates of fall injury hospitalisations, by socioeconomic areas, type of fall and financial year, Australia
Interactive tableau dashboard showing a line graph of the rate of fall hospitalisations and deaths by year and socioeconomic status. There are two tabs - one for hospitalisations, and one for deaths. Users can toggle to select different types of fall to display.
