Injury in Australia:
Other unintentional causes and undetermined intent
Web article
Last updated:
Topic: Injury
Citation
AIHW (Australian Institute of Health and Welfare) (2026) Other unintentional causes and undetermined intent, AIHW, Australian Government, accessed 17 July 2026.
This article is part of Injury in Australia
Unintentional causes
- Accidental poisoning
- Choking and suffocation
- Contact with objects
- Contact with people, plants and animals
- Drowning and submersion
- Electricity and air pressure
- Falls
- Forces of nature
- Other unintentional causes and undetermined intent This page
- Overexertion
- Thermal causes
- Transport accidents
Intentional causes
Cases of injury where the external cause was not reported are the sixteenth ranked cause of injury hospitalisations in 2024–25. There were 98 injury hospitalisations with no reported external cause of injury in 2024–25.
Causes of injuries of undetermined intent
Detailed information is provided only for injury hospitalisations due to External causes of undetermined intent, as meaningful details cannot be described for injuries where external causes are Not reported or recorded as Other unintentional causes.
Where external causes were specified, poisoning and injuries from blunt or sharp objects accounted for the most injury hospitalisations with undetermined intent (Figure 1). Articles on accidental poisoning, assault and contact with objects detail these sorts of injuries further for injuries where intent is known.
Figure 1: Injury hospitalisations with undetermined intent, by cause of injury, 2024–25
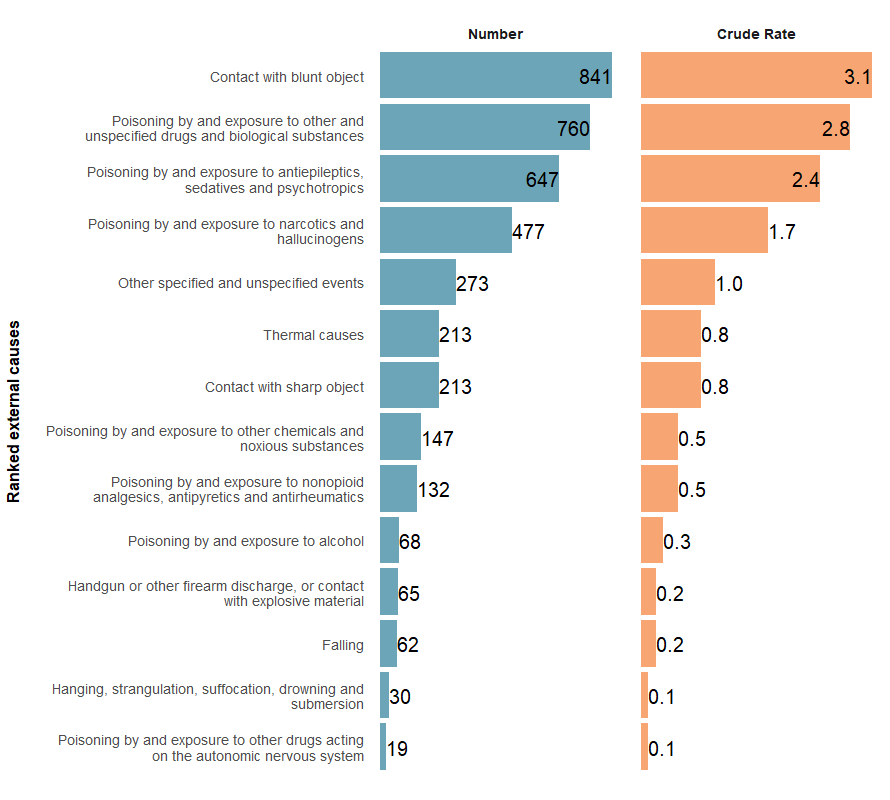
Source: AIHW National Hospital Morbidity Database and ABS National, state and territory population.
For injury deaths with undetermined intent, poisons, falls and transport were among the top 3 causes in 2023–24 (Figure 2). Rates are not displayed for deaths due to small numbers; all rates were under 1 per 100,000 population.
Figure 2: Injury deaths with undetermined intent by cause of injury, Australia, 2023–24
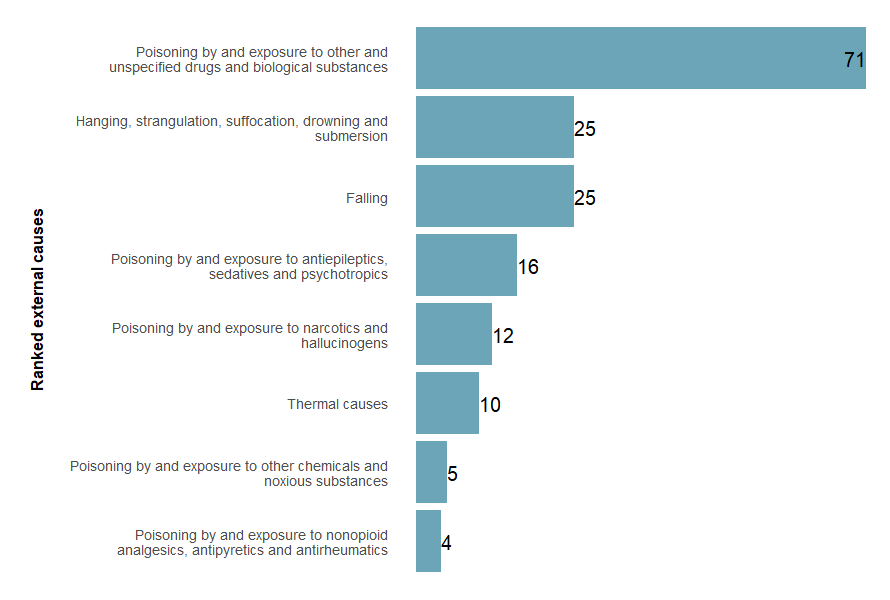
Source: AIHW National Mortality Database and ABS National, state and territory population.
Trends over time
The rate of injury hospitalisations where intent is undetermined has decreased over the past decade while that for Other unintentional causes has increased (Figure3).
Injuries where a cause was unreported have been recorded much less frequently over time as the capture of external cause coding in hospital data improves (see technical notes for details).
Figure 3: Injury hospitalisations for other unintentional causes, undetermined intent, or unreported causes, 2015–16 to 2024–25
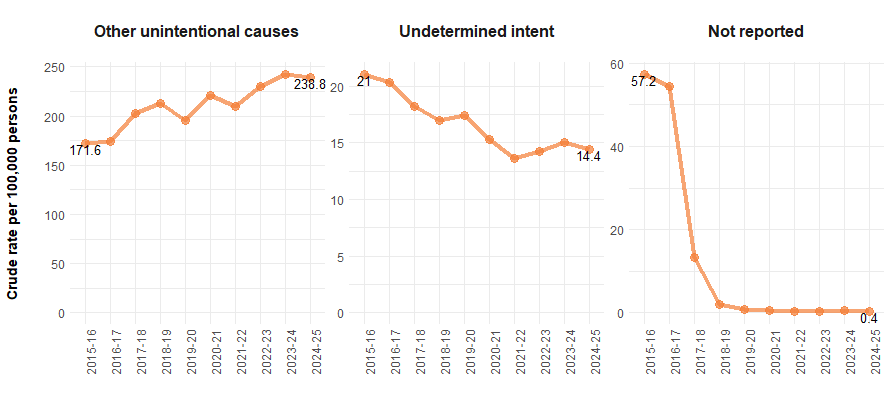
Source: AIHW National Hospital Morbidity Database and ABS National, state and territory population.
Over the past decade, injury hospitalisations with Undetermined intent have decreased for poisoning from specific drug types, except for exposure to other and unspecified drugs (Figure 4)
Figure 4: Injury hospitalisations with undetermined intent, by cause, 2015–16 to 2024–25
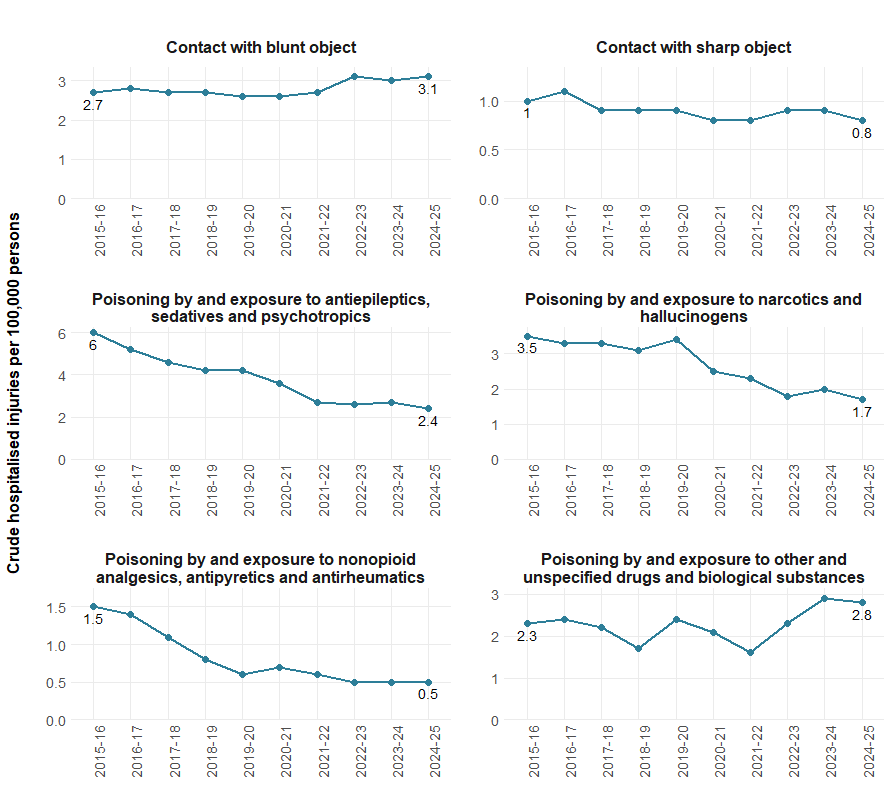
Source: AIHW National Hospital Morbidity Database and ABS National, state and territory population.
Severity
Injury hospitalisations with Undetermined intent are generally more severe than the average of all hospitalised injuries.
In 2024–25, the average length of stay in hospital was shorter, however the rate of in-hospital deaths was higher (Table 1). A higher proportion of cases required ICU admission or continuous ventilatory support, reflecting the impact of poisoning cases among injuries with undetermined intent, as seen similarly in accidental poisoning cases.
Injuries caused by Other unintentional causes were generally less severe than for all hospitalised injuries (Table 1).
Severity measure | Undetermined intent | Other unintentional causes | All injuries |
|---|---|---|---|
Average number of days in hospital | 2.4 | 1.7 | 3.4 |
Percentage of cases with time in an ICU (%) | 12.2 | 0.4 | 2.0 |
Percentage of cases with time on ventilator (%) | 10.6 | 0.1 | 1.1 |
In-hospital deaths (per 1,000 cases) | 8.1 | 1.0 | 5.7 |
Note: Average number of days in hospital (length of stay) includes admissions that are transfers from one hospital to another or transfers from one admitted care type to another within the same hospital, except where care involves rehabilitation procedures.
Source: AIHW National Hospital Morbidity Database.
For more detail, see supplementary data tables H14.
Age and sex
Injury hospitalisation rates from Other unintentional causes or Undetermined intent varied by age and sex (Figure 5).
Cases of Undetermined intent were most common in adolescents and younger adults.
Among males, Other unintentional cause injury hospitalisations peaked in young adulthood and declined with age, while rates remained high among older females.
Figure 5: Injury hospitalisations for other unintentional causes or undetermined intent, by sex and age group, 2024–25
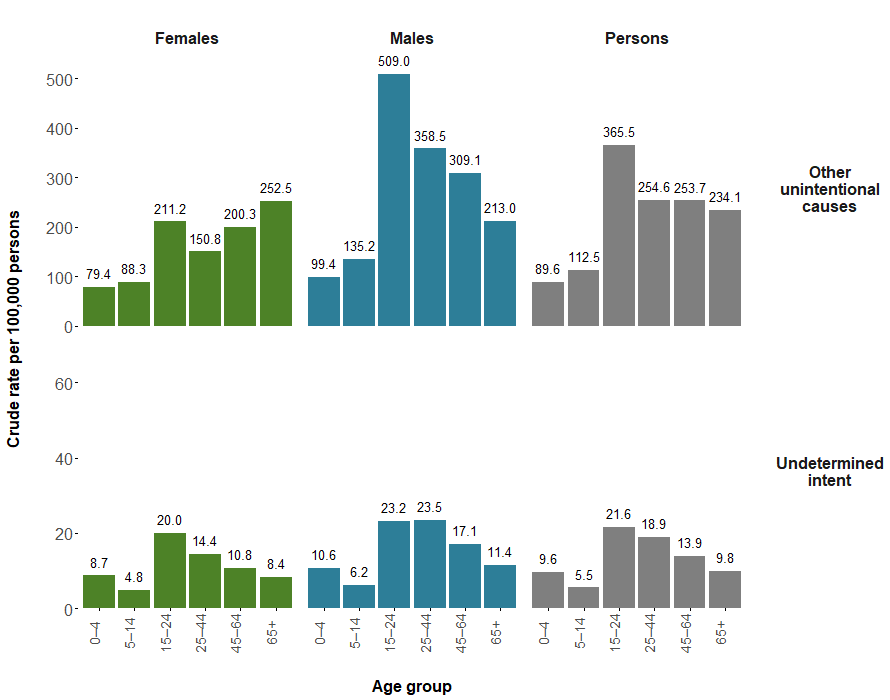
Note: Rates are crude per 100,000 population.
Source: AIHW National Hospital Morbidity Database and ABS National, state and territory population.
Among males hospitalised for injuries of Undetermined intent, blunt object contact, was most common, with 15–24-year-olds having the highest rate at 5.4 per 100,000 persons.
For females, poisoning by other and unspecified drugs and biological substances had the highest rate at 2.7 per 100,000.
Data details
- Technical notes: how the data were calculated
- Data tables: download the full tables
- Glossary