Summary
Download PDF of summary (PDF 423kb)
The Outcomes Framework is a key initiative under Australia’s Disability Strategy 2021–2031 (the Strategy) to measure, track and report on outcomes for people with disability over the life of the Strategy. Annual reporting against the measures in the Outcomes Framework will show what progress is being made on outcomes for people with disability.
This summary is for the 2nd annual report on the Strategy’s Outcomes Framework. It provides an overview of the progress being made on outcomes for people with disability eighteen months after the start of the Strategy in December 2021.
The Strategy has 7 outcome areas. These represent those areas that people with disability have said need to improve to achieve the Strategy’s vision for an inclusive Australian society – one that ensures people with disability can fulfil their potential, as equal members of the community.
Outcome areas:
Data for measures under the Community attitudes outcome area are included in this report. These data come from the first wave of a new national survey—Australia’s Disability Strategy Survey – Share with us—undertaken by the Australian National University (ANU). The proportion of public sector employees with disability from the Employment and financial security outcome area is also able to be reported for the first time.
The Outcomes Framework included a list of 85 measures at the launch of the Strategy. The measures were identified in consultation with the disability community. Rather than limit reporting to information that was available in 2021, people with disability wanted the Outcomes Framework to track some things that cannot currently be reported. Over the life of the Strategy, governments will work together to create and improve data so these measures can be reported. For example, data now available for the Community attitudes outcome area allow additional insight beyond the originally identified measures.
There are 3 types of measure across the 7 outcome areas of the Strategy:
System measures
These track the contribution that key systems, such as health care, housing, education, and employment, are making to achieve outcomes.
Population measures
These track the changes in outcomes over time for people with disability.
Community attitudes measures
These track the change in attitudes towards people with disability, and how people with disability experience community attitudes.
How is progress measured?
Where data are available for a measure for 2 or more points in time it is possible to report on whether change has occurred for that measure.
Data from the closest point in time to when the Strategy started are used to provide the initial view for reported measures. These data are referred to as the ‘baseline’.
As more data for each measure become available these are reported alongside the baseline data. Where more frequent data updates are provided measures are updated quarterly. Less frequently provided data are updated when data becomes available (for example, annually or biennially).
The status of a measure is decided by comparing the baseline and the latest report data. The status shows if there has been change, and the direction of the change.
- Progress: the measure is moving in the direction the Strategy wants
- No Change: the latest data are similar to the baseline
- Regress: the measure is not moving in the direction the Strategy wants.
For some measures, data are also included for periods prior to the start of the Strategy to provide additional context when interpreting the data.
How are things tracking 18 months into the Strategy?
Since the last annual report, 22 of the measures that were previously reported have updated post-baseline data. Baseline data are able to be reported for a further 10 measures for the first time. For the 22 measures with updated post-baseline data:
- 7 show progress
- 7 show no change
- 8 show regress.
Measures that show progress
Employment and financial security
Around 31,200 valid claims were created for a 52-week employment outcome by a person with disability in 2022–23 compared to baseline (16,600 in 2020–21).
System measure
Employment and financial security
Almost 6 in 10 (59%) VET graduates with disability were employed on completion of training in 2022 compared with around 5 in 10 at baseline (52% in 2021).
System measure
Personal and community support
Just over 3 in 4 (76%) NDIS participants aged 15–64 felt NDIS helped them have more choice and control after two years in the scheme in the fourth quarter of 2022–23 compared to baseline (75% in second quarter of 2021–22).
System measure
Measures that show no change
Employment and financial security
There was no real change in the proportion of Australian Public Service employees with disability between baseline (December 2021) and December 2022 (4.9% and 4.9% respectively).
System measure
Safety, rights and justice
There was no real change in NDIS participants who felt able to advocate (stand up) for themselves between baseline (second quarter 2021–22) and the fourth quarter of 2022–23 (37% and 37% respectively).
Population measure
Education and learning
There was no real change in the proportion of children enrolled in a preschool program in the year before full-time schooling who had disability between baseline and 2022 (6.2% in 2021 and 6.3% respectively).
System measure
Measures that show regress
Education and learning
The gap between completion rates for domestic VET students with disability aged 15–64 and for those without disability widened from 6 percentage points for cohort 2017–2021 to 7 percentage points for cohort 2018–2022.
Population measure
Safety, rights and justice
Fewer Specialist Homelessness Services clients with disability experiencing domestic and family violence were provided assistance for accommodation when needed in 2021–22 compared to baseline (79% and 82% in 2020–21 respectively).
System measure
Inclusive homes and communities
The digital inclusion gap between people with disability and the Australian population widened from 9.1 points in 2021 to 11.7 points in 2022.
Population measure
Community attitudes measures
In 2022, the Department of Social Services commissioned Australia’s Disability Strategy Survey – Share with us, undertaken by the ANU. The first wave of the survey was conducted between September 2022 and January 2023. The results from this survey form the baseline for the measures under the Community attitudes outcome area. Data from future waves of the survey will be added to the Outcomes Framework when they become available.
Just over 3 in 4 (77%) employer responses were positive about the value and benefits of employing people with disability in 2022.
Only 1 in 5 (19%) people with disability felt represented in leadership roles in 2022.
Almost 4 in 5 (79%) responses from personal and community support workers were positive about being disability confident and responding positively to people with disability in 2022.
Just over 1 in 2 (54%) people with disability felt valued and respected in their community in 2022.
Future plans
The next (3rd) annual report with data updates will be released in early 2025. In the meantime, data updates will also be released quarterly on the Australia’s Disability Strategy Outcomes Framework webpages, with the next release scheduled for March 2024.
People with disability were clear that they did not want the Strategy reporting to be limited to data that were available at launch. For more details on the government approach to developing future measures, see the Strategy’s Data Improvement Plan.
Australia’s Disability Strategy 2021–2031
Outcomes Framework
Our second annual report
Easy Read version
How to use this report
|
|
The Australian Institute of Health and Welfare (AIHW) wrote this report. When you see the word ‘we’, it means AIHW. |
|
|
We wrote this report in an easy to read way. We use pictures to explain some ideas. |
|
|
We wrote some words in bold. This means the letters are thicker and darker. |
|
|
We explain what these bold words mean. You can find out what they mean in the Word list. |
|
|
This Easy Read report is a summary of another report. This means it only includes the most important ideas. |
|
|
You can find the other report on our website. |
|
|
You can ask for help to read this report. A friend, family member or support person may be able to help you. |
|
|
If you speak a language other than English, you can call Translating and Interpreting Services (TIS). 1800 131 450 |
What is in this report?
What is this report about?
|
|
Australia’s Disability Strategy 2021–2031 is a plan to support people with disability in all areas of their life. In this report we call it the Strategy. |
|
|
The Strategy will last for 10 years. It will finish in 2031. |
|
|
The Strategy includes outcomes. These are important results governments want to get for people with disability. |
|
|
There are 7 different outcome areas. |
|
|
The Outcomes Framework explains the outcomes governments want from each outcome area. |
|
|
It also explains what data we will collect to keep track of the work governments are doing to get these outcomes. Data includes facts, information and records. |
|
|
We will share information about how the Outcomes Framework is going every 3 months.
And we will write a report every year. |
|
|
This will help us see what changes over time. |
What is in the Outcomes Framework?
|
|
The Outcomes Framework includes measures. A measure is data we collect about a certain area. |
|
|
The Australian Government worked with the disability community to choose the measures in the Outcomes Framework. |
There are 3 different types of measures: |
|
|
|
1. How services help change the outcomes. |
|
|
2. How the outcomes change over time for people with disability. |
|
|
3. How community attitudes:
Attitudes are what you think, feel and believe. |
What data do we have?
|
|
The Strategy started in December 2021. |
|
|
This is our second annual report we have shared about the Outcomes Framework measures. |
|
|
The Outcomes Framework has data for 55 measures. |
|
|
In this report, we look at the change over time for 22 measures. We also look at 10 measures for the first time. |
|
|
We will collect data for other measures in the future. |
|
|
And write reports about what we found in the data. |
|
|
We will also work to improve how we collect data so we can report on every measure. |
|
|
Every time we collect new data we will compare it to earlier data. |
|
|
This will help us find out what has changed. |
Australia's Disability Strategy Survey – Share with us
|
|
We also got data from a new national survey. It’s called Australia's Disability Strategy Survey – Share with us. |
|
|
It’s how we collected data for our Community attitudes outcome area. |
|
|
In 2022, we learned about the attitudes of community members who answered the survey. |
|
|
77% of employers thought it was good to hire people with disability. An employer hires other people to work for them. |
|
|
79% of community support workers felt they:
|
|
|
Only 19% of people with disability felt there were enough leaders with disability in Australia. |
|
|
54% of people with disability felt that the community respected them. |
|
|
We will collect new data from this survey in the future. |
What is going well?
|
|
Employment means you:
|
|
|
Disability Employment Services (DES) is a program that helps people with disability:
|
|
|
DES providers support people with disability to find and keep a job. |
|
|
In 2020–21, DES providers made around 16,600 payment claims for helping people with disability find employment. |
|
|
In 2022–23, they made around 31,200 payment claims. |
|
|
More people with disability are getting a job after finishing a vocational education and training (VET) course. |
|
|
VET is a type of education after school. It includes:
|
|
|
In 2021, 52% of people with disability got a job after they finished a VET course. |
|
|
In 2022, it was 59%. |
|
|
The National Disability Insurance Scheme (NDIS) is a government program that supports people with disability around Australia. |
|
|
Participants are people with disability who take part in the NDIS. |
|
|
More participants felt the NDIS helps them to have more choice and control. |
|
|
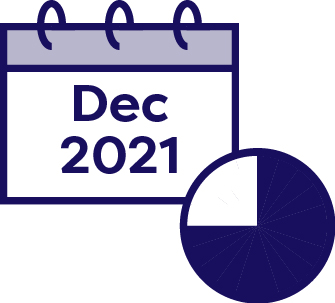
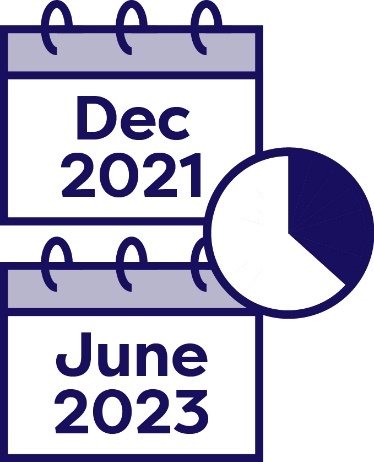
In December 2021, around 75% of NDIS participants felt they had more choice and control. This was after 2 years of taking part in the NDIS. |
|
|
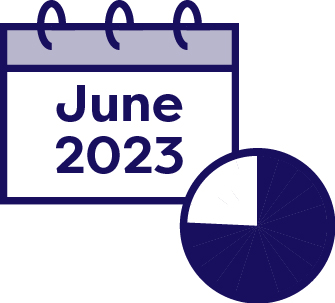
In June 2023, it was 76% of NDIS participants. |
What hasn't changed?
|
|
Some data shows that there hasn’t been a change in how close we are to reaching some outcomes. |
|
|
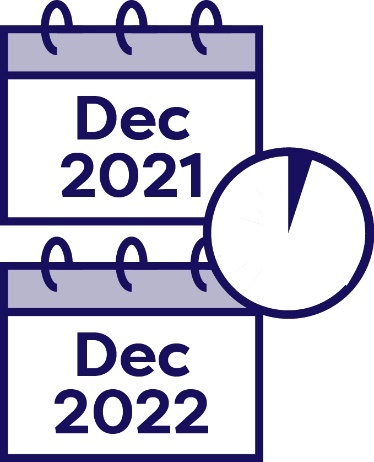
There wasn’t a change in how many people with disability are working in the Australian Government. |
|
|
In both December 2021 and December 2022, it was 4.9%. |
|
|
There also wasn’t a change in how many NDIS participants felt they could speak up for themselves. |
|
|
In December 2021 and June 2023, it was 37%. |
|
|
There was no real change in how many children with disability took part in a preschool program before going to school. |
|
|
In 2021 it was 6.2%. |
|
|
And in 2022 it was 6.3%. |
What needs to be better?
|
|
Some data shows that it will take more time for us to reach some outcomes. |
|
|
We collected data about students with disability doing a VET course. We checked if these students finished their VET course after 4 years. |
|
|
We compared this data to the number of students without a disability. |
|
|
We collected this data from students who were 15 to 64 years old. |
|
|
We collected data about students who started their VET course in 2017. |
|
|
The data showed that about 40% of students with disability had finished their VET course by 2021. |
|
|
And about 46% of students without a disability had finished their VET course by 2021. |
|
|
We also collected data about students who started their VET course in 2018. |
|
|
The data showed that about 42% of students with disability had finished their VET course by 2022. |
|
|
And about 49% of students without a disability had finished their VET course by 2022. |
|
|
We looked at all the data we collected. We found that students without a disability were more likely to finish a VET course than students with disability. |
We collected data about people with disability who: |
|
|
|
|
|
|
|
|
|
|
Family and domestic violence is when someone close to you hurts you, such as: |
|
|
|
|
|
|
|
|
|
|
|
|
|
|
|
In 2020–21, about 82% of people with disability got support when they used services that help people find safe places to live. |
|
|
In 2021–22, this number was 79%. |
|
|
In 2022, we also collected data about digital inclusion across Australia. |
|
|
Digital inclusion means people with disability:
|
|
|
When we looked at the data, we found that people with disability were less likely to experience digital inclusion than people without a disability. |
What happens next?
|
|
All governments will keep working on making outcomes better for people with disability. And we will collect more data. |
|
|
For example, we will collect more data for the measures we already have. |
|
|
And new data for the other measures. |
|
|
We will share data on the Outcomes Framework website every 3 months. |
|
|
We will also share another report at the start of 2025. |
|
|
Governments also wrote a plan about making data better. |
|
|
You can find an Easy Read version on the Strategy website. |
Word list
This list explains what the bold words in this document mean.
|
|
Attitudes Attitudes are what you think, feel and believe. |
|
|
Data Data includes facts, information and records. |
|
|
DES providers DES providers support people with disability to find and keep a job. |
|
|
Digital inclusion Digital inclusion means people with disability:
|
|
|
Employer An employer hires other people to work for them. |
|
|
Employment Employment means you:
|
|
|
Family and domestic violence Family and domestic violence is when someone close to you hurts you, such as:
|
|
|
Measures A measure is data we collect about a certain area. |
|
|
National Disability Insurance Scheme (NDIS) The NDIS is a government program that supports people with disability around Australia. |
|
|
Outcomes Outcomes are important results governments want to get for people with disability. |
|
|
Participants Participants are people with disability who take part in the NDIS. |
|
|
Vocational education and training (VET) VET is a type of education after school. It includes:
|
Contact us
|
|
You can visit our website for more information. |
|
|
You can send us an email. |
|
|
You can write to us, GPO Box 570 Canberra ACT 2601 |
|
|
This Easy Read document was created by the Information Access Group using stock photography and custom images. The images may not be reused without permission. For any enquiries about the images, please visit www.informationaccessgroup.com. Quote job number 5442. |
Section 2 of 11


