Injury in Australia:
Thermal causes
Web article
Last updated:
Topic: Injury
Citation
AIHW (Australian Institute of Health and Welfare) (2026) Thermal causes, AIHW, Australian Government, accessed 25 July 2026.
This article is part of Injury in Australia
Unintentional causes
Intentional causes
Type of thermal cause
In 2024–25, injuries from contact with hot drinks, food, fats and cooking oils, contact with other hot fluids and contact with other and unspecified heat and hot substances most frequently resulted in hospitalisation (Figure 1).
Figure 1: Injury hospitalisations due to thermal causes, by type of thermal cause, 2024–25
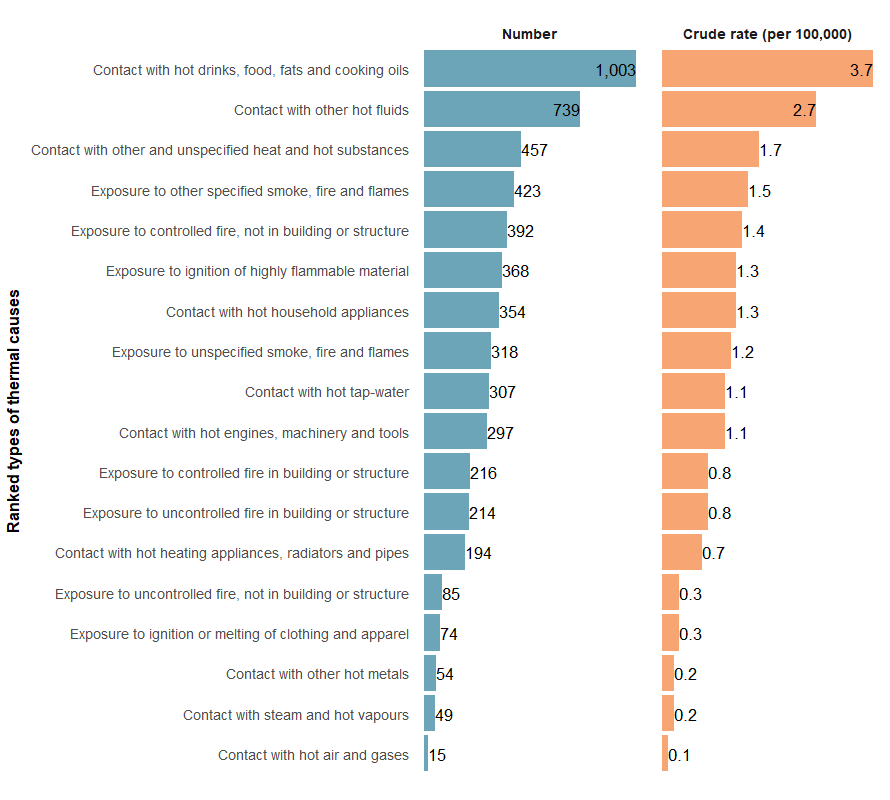
Sources: AIHW National Hospital Morbidity Database and ABS National, state and territory population.
For more detail, see supplementary data table H18.
In 2023–24, most injury deaths from thermal causes were due to an uncontrolled fire in a building or structure (Figure 2).
Figure 2: Injury deaths due to thermal causes, by type of thermal cause, 2023–24
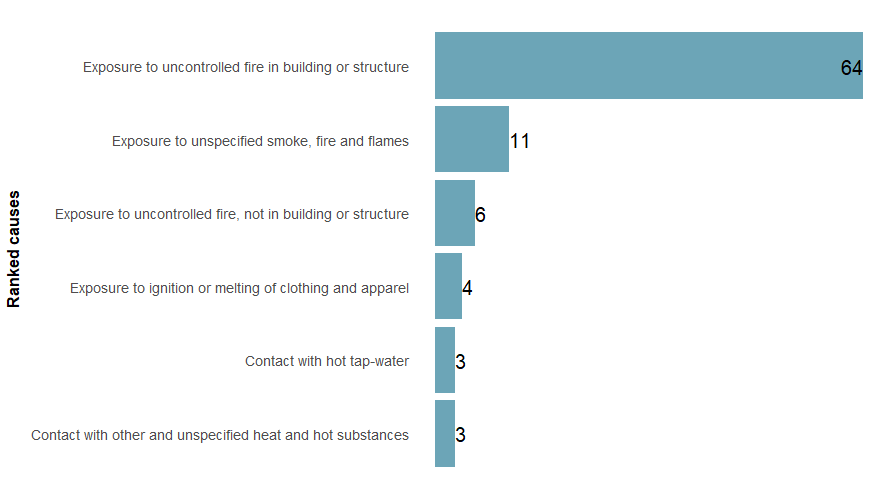
Note: There were 40 deaths with unknown type of thermal cause, these were excluded in the ranking.
Sources: AIHW National Mortality Database and ABS National, state and territory population.
For more detail, see supplementary data tables D8.
Trends over time
There is a break in the time series for hospitalisations between 2016–17 and 2017–18 due to a change in data collection methods (see the technical notes for details).
The number of injury hospitalisations due to thermal causes has declined over the past decade (Figure 3).
Between 2015–16 and 2024–25, the rate has decreased from 24.5 to 20.3 per 100,000 (Figure 3). The hospitalisation rate in 2024–25 was 6.8% lower than the previous 5-year average rate of 21.8 per 100,000 population.
Figure 3: Injury hospitalisations due to thermal causes, 2015–16 to 2024–25
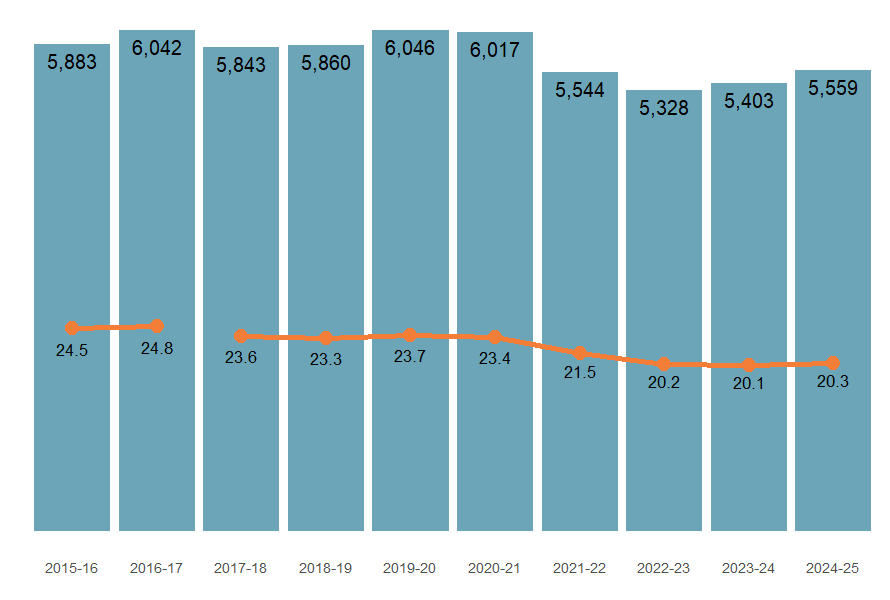
Note: Columns represent number of hospitalisations, the line graph represents the crude rate (per 100,000 population).
Sources: AIHW National Hospital Morbidity Database and ABS National, state and territory population.
The number of thermal injury deaths has gradually increased over time. Of the 135 deaths in 2019–20, 34 were related to exposure to uncontrolled fire, not in a building or structure, 33 of these can be attributed to the 2019–20 bushfire season (Parliament of Australia 2020) (Figure 4).
Figure 4: Injury deaths due to thermal causes, 2014–15 to 2023–24
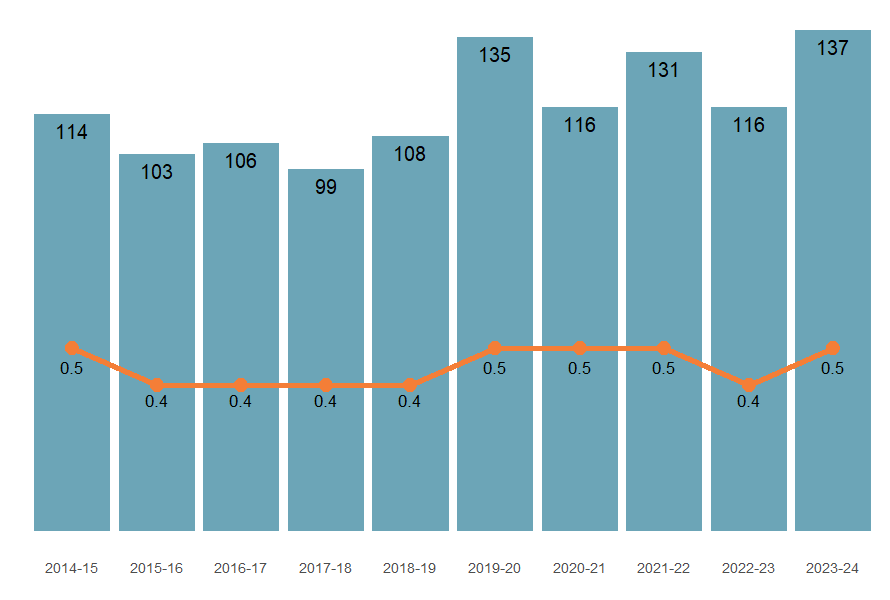
Note: Columns represent number of hospitalisations, the line graph represents the crude rate (per 100,000 population).
Sources: AIHW National Mortality Database and ABS National, state and territory population.
Seasonality
Injury hospitalisations due to thermal causes generally increase during winter (Figure 5). However, in 2024–25, the number of hospitalisations in the winter months was below the previous 5-year average, particularly in July and August.
Figure 5: Injury hospitalisations due to thermal causes by calendar month, 2024–25
An interactive tableau visualisation showing the number of injury hospitalisations by month for the most recent financial year, and the previous 5-year average. Users can toggle the type of thermal cause.
Figure 6: Injury hospitalisations due to thermal causes, by main body part injured, 2024–25
An interactive tableau visualisation showing human figure with injury hospitalisation data for each body part. The hip and lower limb reported the highest number of injury cases.

Figure 7: Injury hospitalisations due to thermal causes, by age group and sex, 2015–16 to 2024–25
Interactive Tableau dashboard displaying hospitalisations. It shows a time series of rates by age group, and by sex.

For more detail, see supplementary data tables H3 and H9.
First Nations people
Among Aboriginal and Torres Strait Islander (First Nations) people:
- there were 666 hospitalisations due to thermal injuries in 2024–25 (63.5 per 100,000)
- males were 1.6 times as likely as females to be hospitalised (78.4 and 48.4 per 100,000 population)
- hospitalisation rates were highest among people aged 0–4 (Figure 8)
- there were 12 deaths due to thermal injuries in 2023–24
Figure 8: Injury hospitalisations due to thermal causes among First Nations people, by age group and sex, 2024–25
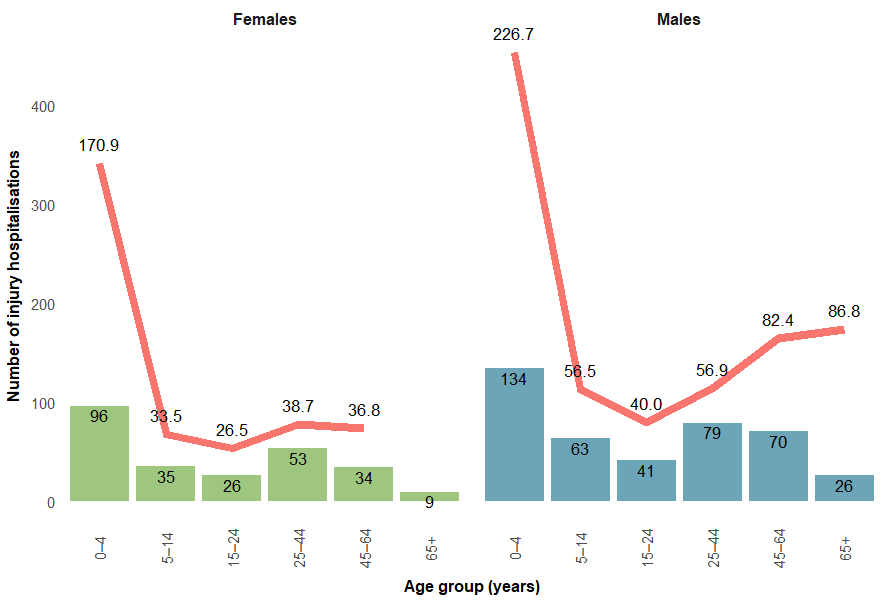
Note: Columns are number of hospitalisations, the line is the crude rate per 100,000 population.
Sources: AIHW National Hospital Morbidity Database and ABS Estimates and Projections, Aboriginal and Torres Strait Islander Australians.
For more detail, see supplementarydata table H6.
Comparison between First Nations people and non-Indigenous Australians
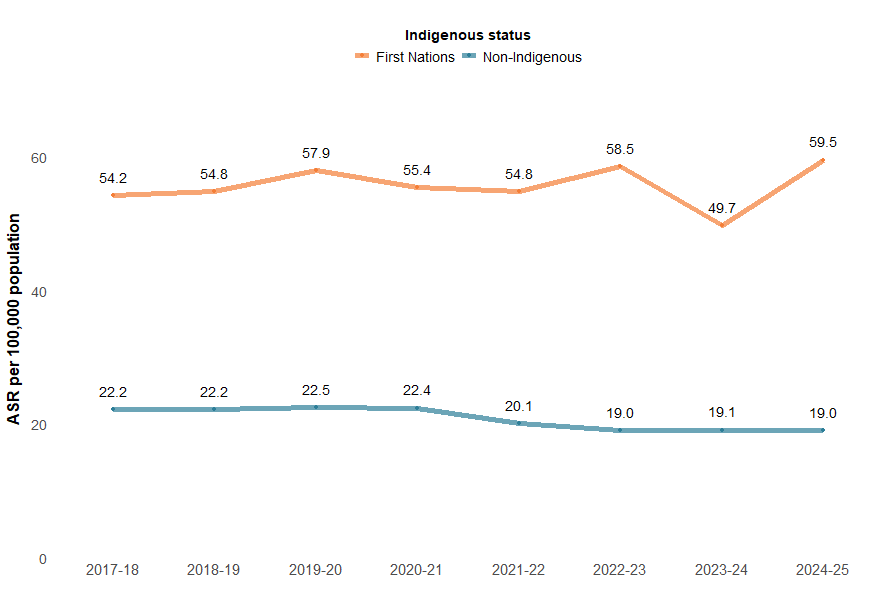
Compared with non-Indigenous Australians, First Nations people were three times as likely to be hospitalised due to thermal injuries in 2024–25 (Figure 9).
Figure 9: Injury hospitalisations due to thermal causes, by Indigenous status, 2017–18 to 2024–25
Notes:
- Age-standardised rate per 100,000 population.
- ‘Non-Indigenous people’ excludes cases where Indigenous status is missing or not stated.
Sources: AIHW National Hospital Morbidity Database and ABS Estimates and Projections, Aboriginal and Torres Strait Islander Australians.
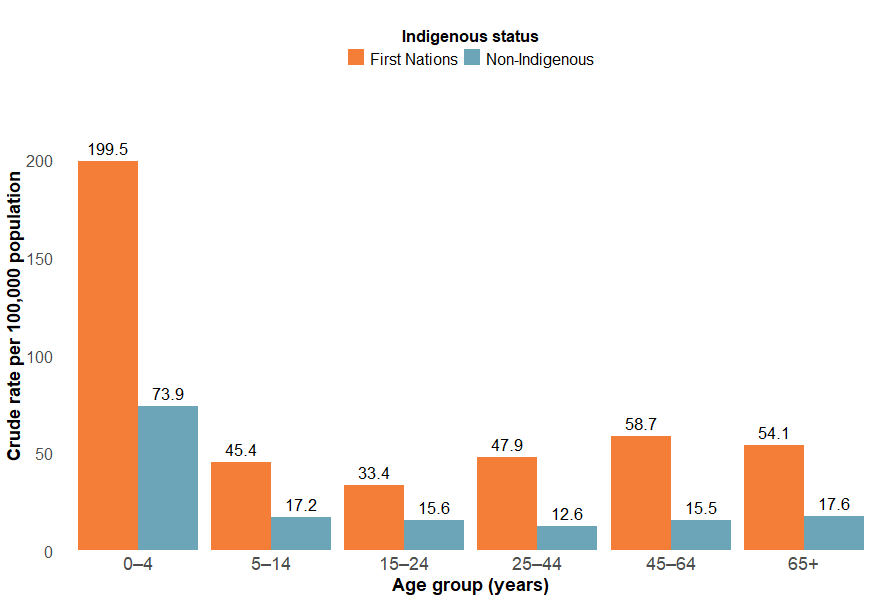
In 2024–25, the injury hospitalisation rate due to thermal causes was highest among children aged 0–4 for both First Nations people and non-Indigenous Australians (Figure 10). However, across all age groups, the rates for First Nations people were more than twice those of non-Indigenous people.
Figure 10: Injury hospitalisations due to thermal causes, by Indigenous status and age group, 2024–25
Notes:
- Crude rate per 100,000 population.
- ‘Non-Indigenous Australians’ excludes cases where Indigenous status is missing or not stated.
Sources: AIHW National Hospital Morbidity Database and ABS Estimates and Projections, Aboriginal and Torres Strait Islander Australians.
For more detail, see supplementarydata table H6.
State and territory
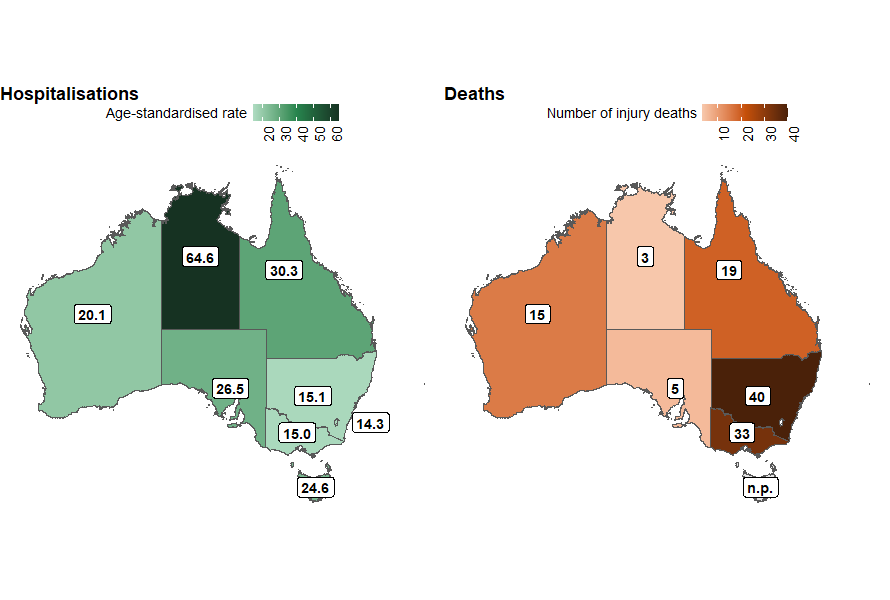
The states and territories with the highest rates of thermal injury hospitalisation in 2023–24 were:
- Northern Territory (64.6 per 100,000)
- Queensland (30.3 per 100,000)
- South Australia (26.5 per 100,000) (Figure 11).
Rates of thermal injury deaths cannot be reliably calculated in most states due to low numbers. Figure 8 shows the number of deaths in each state and territory in 2022–23.
Figure 11: Age-standardised rate of thermal injury hospitalisations (2023–24) and number of injury deaths (2022–23), by state or territory of usual residence, Australia
Notes:
- State and territory refers to the state and territory of usual residence for the individual.
- Rates are age-standardised per 100,000 population.
- Rates of injury death cannot be reliably calculated in most states due to low numbers. Therefore, Figure 11 only presents data on the number of injury deaths in each state and territory for 2022–23.
Sources: AIHW National Hospital Morbidity Database, AIHW National Mortality Database, and ABS National, state and territory population.
For more information, please see the supplementary data tables and the geography dashboard.
Remoteness
Areas of Australia which are more remote tend to have higher rates of hospitalisation and death from injury than less remote areas.
Figure 12: Age-standardised rates of thermal injury hospitalisations, by remoteness and financial year, Australia
Interactive tableau dashboard showing a line graph of the rate of thermal hospitalisations by year and remoteness.

Figure 13: Age-standardised rates of thermal injury hospitalisations, by socioeconomic areas and financial year, Australia
Interactive tableau dashboard showing a line graph of the rate of thermal hospitalisations and deaths by year and socioeconomic area.
