This content contains information some readers may find distressing.

If you, or someone you know needs help, contact Lifeline on 13 11 14. Go to the crisis and support services page for a list of support services.

In cases where the cause of injury is known but it is unclear if the act was accidental or intentional, hospital and death records can be coded to identify that the intent was undetermined.

Injuries of undetermined intent resulted in around:

3,500 hospitalisations in 2021–22

14 per 100,000 population

 235 deaths in 2020–21

0.9 per 100,000 population

This represents 0.7% of injury hospitalisations and 1.7% of injury deaths.

Causes of hospitalisation

The most frequent causes of hospitalisation for injuries of undetermined intent in 2021–22 were various kinds of poisoning, followed by contact with blunt objects (Table 1).

Table 1: Causes of injuries of undetermined intent, 2021–22 hospitalisations
External cause Hospitalisations % Rate (per 100,000)
Poisoning by and exposure to antiepileptic, sedative-hypnotic, antiparkinsonism and psychotropic drugs, not elsewhere classified (Y11) 703 20 2.7
Poisoning by and exposure to narcotics and psychodysleptics, not elsewhere classified (Y12) 587 17 2.3
Other poisoning (Y10, Y13–Y19) 849 24 3.2
Total poisoning (Y10–Y19) 2,139 61 8.2
Hanging, strangulation, suffocation, drowning and submersion (Y20-Y21) 24 1 0.1
Contact with blunt objects (Y29) 684 19 2.7
Other (Y22–Y28, Y30–Y34) 665 19 2.7
Total 3,512 100 13.7

Notes

  1. Rates are crude per 100,000 population.
  2. Percentages may not total 100 due to rounding.
  3. Codes in brackets refer to the ICD-10-AM (11th edition) external cause codes (ACCD 2019).

Source: AIHW National Hospital Morbidity Database.

For more detail, see Data tables B33–34.

Causes of death

The most frequent causes of injury death in this category in 2020–21 were various kinds of poisoning (Table 2).

Table 2: Causes of injuries of undetermined intent, 2020–21 deaths
Cause Deaths % Rate (per 100,000)
Poisoning (Y10–Y19) 105 45 0.4
Hanging, strangulation, suffocation, drowning and submersion (Y20-Y21) 23 10 0.1
Crashing of motor vehicle (Y32) 23 10 0.1
Other (Y22–Y31, Y33–34) 84 36 0.3
Total 235 100 0.9

Notes

  1. Rates are crude per 100,000 population.
  2. Percentages may not total 100 due to rounding.
  3. Codes in brackets refer to the ICD-10 external cause codes (WHO 2011).

Source: AIHW National Mortality Database.

For more detail, see Data tables E45–47.

Trends over time

Over the period from 2017–18 to 2021–22, the age-standardised rate of hospitalisation for injuries of undetermined intent decreased by an annual average of 6.9%. From 2012–13 to 2016–17 there was little change.

There is a break in the time series for hospitalisations between 2016–17 and 2017–18, due to a change in data collection methods (see the Technical notes for details).

For deaths from injuries of undetermined intent, there was an average annual decrease in rate between 2011–12 and 2020–21 of 3.1% (Figure 1).

Figure 1: Hospitalisations and deaths from injuries of undetermined intent, by sex and year

2 matching line graphs on separate tabs, 1 tab for hospitalisations and 1 for deaths over 10 years. The 3 lines represent the trend for males, persons and females. The reader can choose to display rate per 100,000 population or number.

Visualisation not available for printing

For more detail, see Data tables C1–3 and F1–4

Seasonal differences

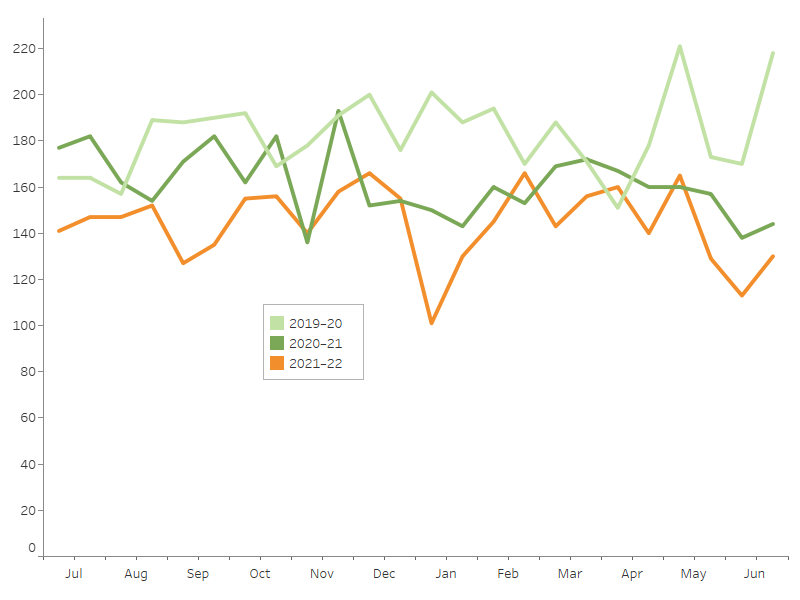
Hospitalisations due to injuries of undetermined intent do not show an obvious seasonal pattern.

Some categories of injury do show a seasonal pattern – see the interactive display.

Figure 2: Seasonal differences in hospitalisations for injuries of undetermined intent, 2019–20 to 2021–22

3 line graph representing the trends for 2019-20, 2020-21 and 2021-22

Notes

  1. Admission counts have been standardised into two 15-day periods per month.
  2. A scale-up factor has been applied to June admissions to account for cases not yet separated.

Source: AIHW National Hospital Morbidity Database.

Age and sex differences

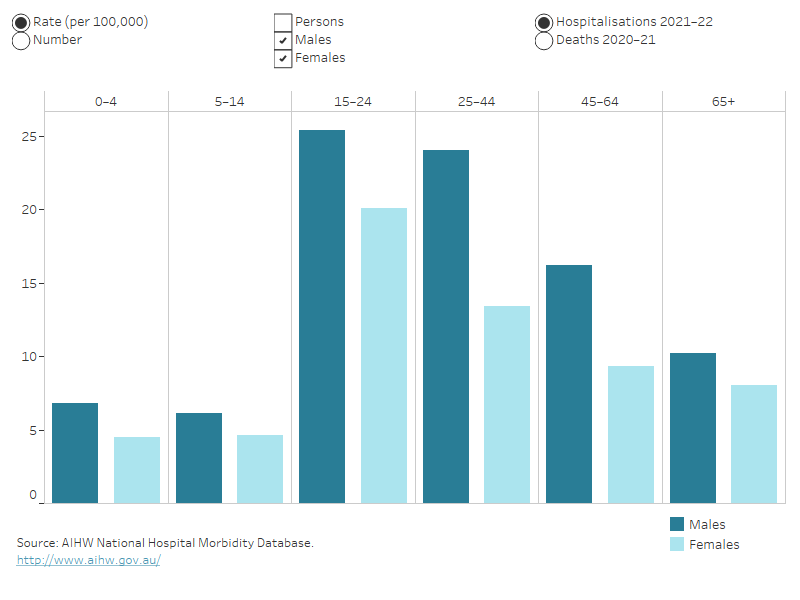
Rates of hospitalisation for injuries of undetermined intent in 2021–22 were highest in the 15–24 age group, and higher for males. Rates of death in 2020–21 were highest in the 45–64 age group (Figure 3).

Figure 3: Hospitalisations and deaths from injuries of undetermined intent, by age group and sex

2 matching column graphs on separate tabs, 1 tab for hospitalisations and 1 for deaths. The columns represent sex within 6 life-stage age groups. For each age group, the reader can choose to display either rate per 100,000 population or number. The default displays males and females and the reader can also choose to display persons.

For more detail, see Data tables A1–3 and D1–3.

Severity

There are many ways that the severity, or seriousness, of an injury can be assessed. Some of the ways to measure the severity of hospitalised injuries are:

  • number of days in hospital
  • time in an intensive care unit (ICU)
  • time on a ventilator
  • in-hospital deaths.

The average number of days in hospital for injuries in this category was below the average for all hospitalised injuries, but the percentage of hospitalisations that included time in an ICU or involved continuous ventilatory support were much higher than for all hospitalised injuries in 2021–22. Rates of in-hospital death were above average (Table 3).

Table 3: Severity of injuries of undetermined intent that led to hospitalisation, 2021–22
  Undetermined intent All injuries
Average number of days in hospital 3 4.7
% of cases with time in an ICU 8.9 2.0
% of cases involving continuous ventilatory support 7.9 1.1
In-hospital deaths (per 1,000 cases) 6.8 5.9

Note: Average number of days in hospital (length of stay) includes admissions that are transfers from 1 hospital to another or transfers from 1 admitted care type to another within the same hospital, except where care involves rehabilitation procedures.

Source: AIHW National Hospital Morbidity Database.

For more detail, see Data tables A13–15.

Aboriginal and Torres Strait Islander people

Among Aboriginal and Torres Strait Islander people:

  • there were 365 hospitalisations for injuries of undetermined intent in 2021–22 (Table 4)
  • males had higher rates of hospitalisation
  • hospitalisation rates were highest among people aged 25–44, compared with other life stage age groups (Figure 4)
  • there were 16 deaths from injuries of undetermined intent in 2020–21 (Table 5).
Table 4: Hospitalisations for injuries of undetermined intent by sex, Indigenous Australians, 2021–22
  Males Females Persons
Number 222 143 365
Rate (per 100,000) 51 33 42

Note: Rates are crude per 100,000 population.

Source: AIHW National Hospital Morbidity Database.

Table 5: Deaths from injuries of undetermined intent by sex, Indigenous Australians, 2020–21
  Males Females Persons
Number 12 4 16
Rate (per 100,000) 3.2 1.1 2.1

Notes

  1. Rates are crude per 100,000 population.
  2. Deaths data only includes data for New South Wales, Queensland, Western Australia, South Australia, and the Northern Territory.

Source: AIHW National Mortality Database.

Indigenous and non-Indigenous Australians

In 2020–21, Indigenous Australians were 3.5 times as likely as non-Indigenous Australians to be hospitalised with injuries of undetermined intent (Table 6).

Table 6: Age-standardised rates (per 100,000) of injuries of undetermined intent by Indigenous status and sex, 2021–22 hospitalisations
  Males Females Persons
Indigenous Australians 59 36 47
Non-Indigenous Australians 15 10 13

Notes

  1. Rates are age-standardised per 100,000 population.
  2. ‘Non-Indigenous Australians’ excludes cases where Indigenous status is missing or not stated.

Source: AIHW National Hospital Morbidity Database.

The rate of hospitalisations for injuries of undetermined intent was highest among the 25–44 life-stage age group for Indigenous Australians and the 15–24 age group for non-Indigenous Australians (Figure 4).

Deaths data are not presented because of small numbers.

Figure 4: Hospitalisations for injuries of undetermined intent, by Indigenous status, by age group and sex, 2021–22

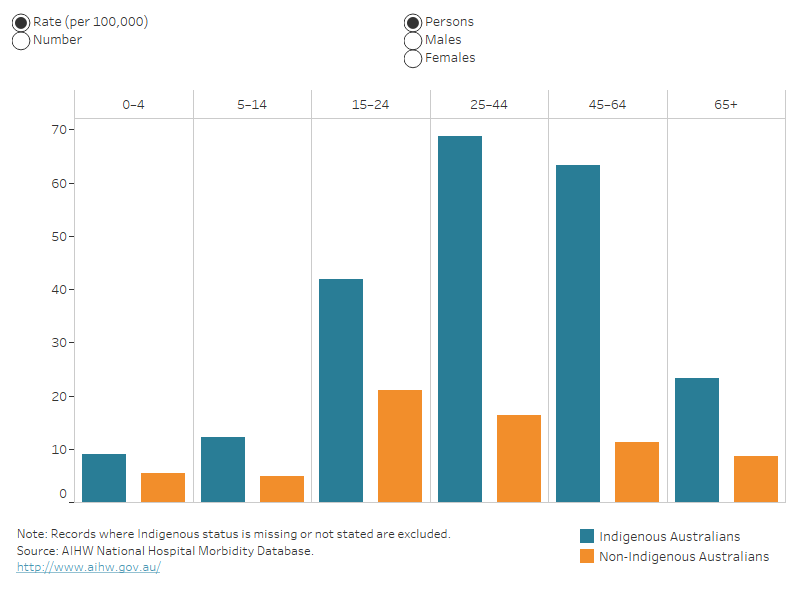
Column graph representing data for Indigenous and non-Indigenous Australians by 6 life-stage age groups. The reader can choose to display rate per 100,000 population or number. By default, data for persons is displayed, the reader can also choose to display males or females.

For more detail, see Data tables A4–A6 and D4–D8.

Remoteness

In 2021–22, people living in Remote areas, compared with people living in Inner regional, were 1.8 times as likely to be hospitalised due to injuries of undetermined intent (Table 7).

Table 7: Age-standardised rates (per 100,000) of hospitalisation for injuries of undetermined intent by remoteness and sex, 2021–22
  Males Females Persons
Major cities 16 11 13
Inner regional 16 9 12
Outer regional 18 12 15
Remote 26 19 22
Very remote n.p. 23 20

Note: Rates are age-standardised per 100,000 population.

Source: AIHW National Hospital Morbidity Database.

The highest rate of hospitalisations for injuries of undetermined intent was among the 15–24 age group living in Remote areas of Australia. (Figure 5).

Deaths data are not presented here because of small numbers.

Figure 5: Hospitalisations for injuries of undetermined intent, by remoteness, by age group and sex, 2021–22

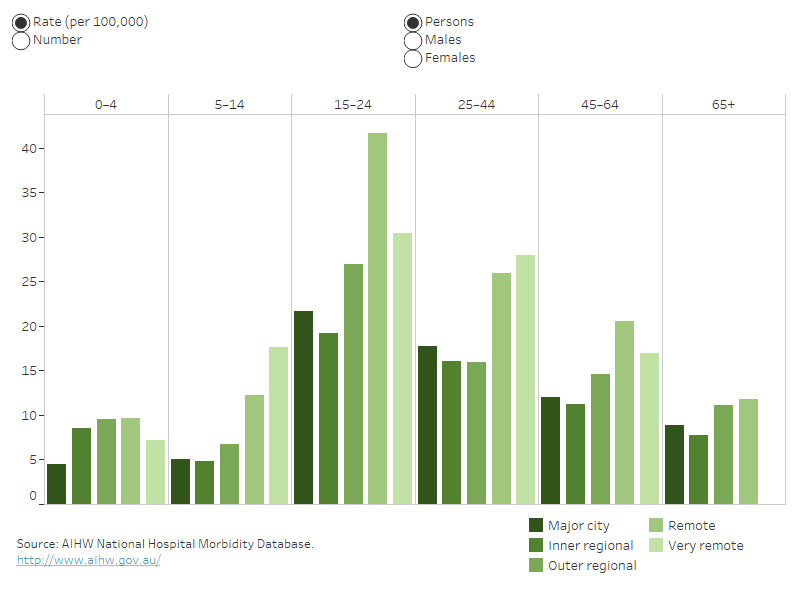
Column graph representing data for each of the 5 remoteness categories by 6 life-stage age groups. The reader can choose to display rate per 100,000 population or number. By default, the graph displays data for persons. The reader can also choose to display data for males or females.

For more detail, see Data tables A7–9 and D9–10.

For information on how the statistics were calculated by remoteness, see the technical notes.

Data details

Technical notes: how the data were calculated

Data tables: download the full tables

Glossary