Parental health and disability
Data updates
25/02/22 – In the Data section, updated data related to parental health and disability are presented in Data tables: Australia’s children 2022 – Social support. The web report text was last updated in December 2019.
Key findings
- In 2017, a higher proportion of parents in 2-parent families (53%) rated their health as excellent or good than parents in 1-parent families (38%).
- In 2015, it was estimated that 15% (669,000) of children aged 0–14 lived with 1 or both parents with disability.
- In 2017, among parents with co-resident children aged 0–14, an estimated 16% of parents reported a poor level of mental health.
- In 2016, an estimated 14% of adults with a child aged 0–14 used an illicit substance within the 12 months before being surveyed.
Being a parent comes with many responsibilities. Parents with a physical or mental health condition, or with disability, can face extra challenges. Whether these conditions affect parenting and/or impact the child depends on the:
- health issue
- age of the child
- extent to which services and supports assist parents to manage their health.
Parents with a chronic illness or disability often need extra support from health care professionals, friends and family. In situations where the parent does not have an adult friend or family member to support them, they may depend on the child.
Caring for a parent can be personally rewarding and may cause children to engage with different cognitive and adaptive processes to understand their parent’s condition, and cope with it (Chen 2017). Caring for a parent with a mental illness can result in close family ties and promote independence (Reupert & Maybery 2016). However, caring for their parent at a young age can also come at the cost of the child’s engagement in typical childhood behaviour (Warren & Edwards 2017).
Parental substance use can also impact child outcomes (AIFS 2010). Parents experiencing intoxication and withdrawal may find it difficult to maintain household routine, potentially leading to the child’s emotional and physical needs being unmet, and causing concern for the parent’s wellbeing and safety (AIFS 2010).
Box 1: Data sources on parental health
Physical and mental health
Data on parental self-assessed physical health and mental health are sourced from the Household, Income and Labour Dynamics in Australia (HILDA) survey. HILDA surveys the same cohort of 17,000 Australians yearly on their economic and wellbeing information.
HILDA surveys participants on their self-assessed physical health, which can be rated as excellent/very good, good or poor. Mental health is measured by a Mental Health Component score, calculated from the results of a short health survey form filled out by participants (Box 3). Within the survey, a parent may be natural, adopted, step or foster. A parent’s de facto partner also counts as a parent.
Disability
Data on parental disability is sourced from the Australian Bureau of Statistics (ABS) Survey of Disability, Ageing and Carers (SDAC), which measures the prevalence of disability in Australia. Within the survey, a person has disability if they reported having a limitation, restriction or impairment, which has lasted, or is likely to last, for at least 6 months and restricts everyday activities.
The survey also estimates the need for support of older people and those with disability, and the number of carers to people with disability, long-term health condition/s or older people. Carers were people who provided any informal ongoing assistance to people with disability or older people for at least 6 months.
Alcohol and drug use
Data on parental alcohol and tobacco use is sourced from the AIHW National Drug Strategy Household Survey (NDSHS) which collects information on alcohol and tobacco consumption, and illicit drug use among the general population in Australia. The survey includes data on people’s attitudes and perceptions on tobacco, alcohol and other drug use. The 2016 NDSHS surveys individuals aged 12 years and older. The survey has been conducted every 2 to 3 years since 1985.
How many parents rated their health as very good or excellent?
In 2017, among parents of co-resident children aged 0–14:
- 88% of parents (or an estimated 4.1 million) rated their overall health as good, very good or excellent
- 13% of parents (or around 588,000) rated their health as fair or poor (Figure 1).
A higher proportion of parents in 2-parent families (52%) rated their health as excellent or very good than parents in 1-parent families (38%).
Figure 1: Self-assessed health status of parents with co-resident children aged 0–14, by family type, 2017
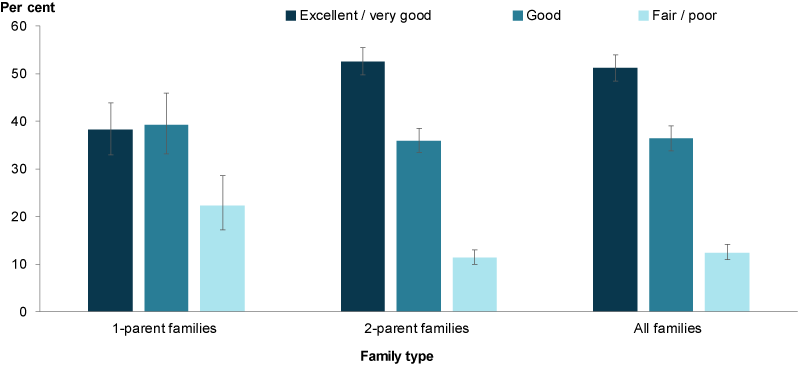
Chart: AIHW. Source: HILDA.
The proportion of parents from 1 and 2-parent families that assessed their health as excellent or very good remained relatively stable between 2009 (43% and 55%, respectively) and 2017 (38% and 53%, respectively) (Figure 2).
Figure 2: Parents with co-resident children aged 0–14 with an excellent or very good self-assessed health status, by family type, 2009–2017
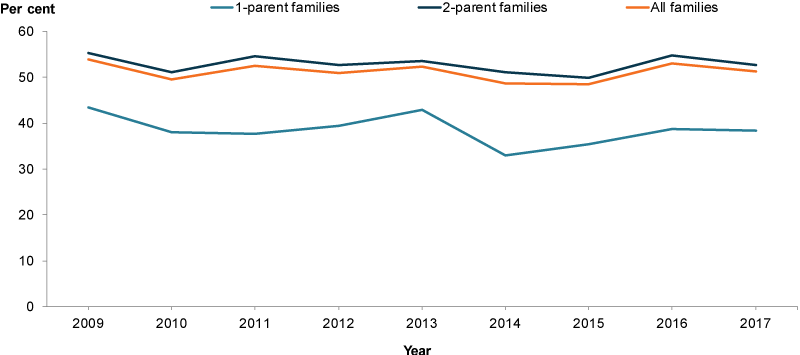
Chart: AIHW. Source: HILDA.
Does everyone rate their health the same?
In 2017, a higher proportion of parents living in the highest socioeconomic areas rated their health as excellent or very good compared with parents living in the lowest socioeconomic areas (59% and 41%, respectively) (Figure 3).
Parents living in the lowest socioeconomic areas were also more likely to assess their health as fair or poor compared with parents living in the highest socioeconomic areas (21% and 9.8%, respectively).
A higher proportion of parents in Remote, Very remote and Outer regional areas rated their health as fair or poor compared with parents living in major cities (16% and 12%, respectively).
In 2017, there was no statistically significant difference between the proportions of Indigenous parents who rated their health as excellent or very good compared with non-Indigenous parents (43% and 51%, respectively) (Figure 3). Similarly, there was no statistically significant difference between the proportions of Indigenous and non-Indigenous parents that rated their health as fair or poor (17% and 12%, respectively). The rate of Indigenous parents assessing their health as excellent or very good fluctuated between 2009 and 2017, but showed no overall change.
Figure 3: Parents with co-resident children aged 0–14 with an excellent or very good self-assessed health status, by population group, 2017
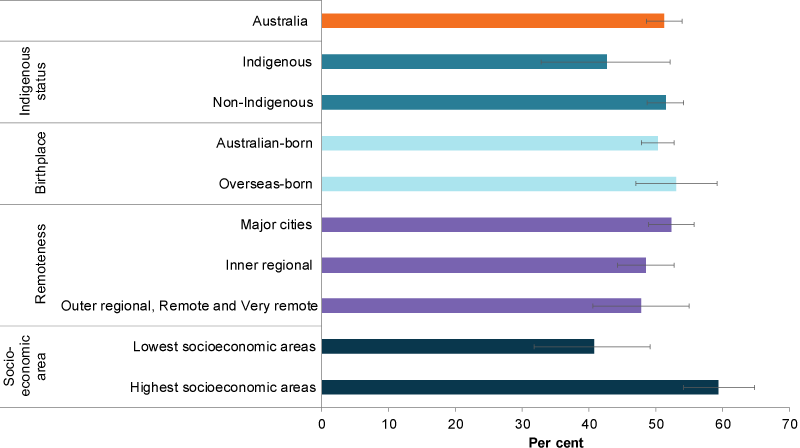
Chart: AIHW. Source: HILDA.
How many parents have disability?
In 2015, it was estimated that among children aged 0–14, 15% (669,000) lived with 1 or both parents with disability. There was a higher proportion of parental disability in 1-parent families compared with 2-parent families (19% and 14%, respectively) (ABS 2015).
Around 38,900 children aged 0–14 provided ongoing informal assistance (care) to a parent with disability, representing around 5.8% of all children with a parent with disability (ABS 2015).
The SDAC estimates that 5,500 children were unconfirmed primary carers in 2015 (ABS 2015) (Box 2). Note that while these estimates are for children aged 0–14, it is unlikely that children under the age of 5 provided informal assistance.
Box 2: Primary carer and unconfirmed primary carer
In the SDAC, a carer is defined as a person who provides informal assistance—help or supervision—to people with disability or older people (aged 65 years and over). Assistance must be ongoing, or likely to be ongoing, for at least 6 months.
A primary carer provides the most informal assistance to a person with 1 or more disabilities, with 1 or more of the core activities of mobility, self-care or communication. In the SDAC, primary carers are 15 years and over.
Children under the age of 15 identified as a primary carer by the recipient were not interviewed and were therefore classified as an unconfirmed primary carer (ABS 2018).
Parental mental health
In the National Framework for Protecting Australia’s Children, parental mental health problems and substance abuse are identified as risk factors for child abuse and neglect, alongside homelessness and domestic violence (COAG 2009; DSS 2018).
While children of parents with mental illness can experience adverse outcomes, this is not always the case (Reupert et al. 2012). The type of mental illness, the presence of other disorders (such as substance use) and the duration and severity of illness are factors influencing parenting (Reupert et al. 2012). The family context, and available social support available for the family, also influence outcomes for children (Reupert et al. 2012). Evidence-based intervention, prevention and treatment programs can provide support to parents with mental illness, reduce risks and enhance resilience in the children concerned (RANZCP 2016).
Box 3: Mental Health Component Summary Score
Mental health data reported here are measured by a Mental Health Component (MCS) score. This is calculated from results of the Short Form-36 Health Survey—a self-reported survey included in the HILDA survey.
The Short Form-36 Health Survey covers 8 domains of health—4 relating to physical health and 4 relating to mental health.
While data from all 8 domains contribute to the MCS score, the 4 mental health domains (mental health, role emotional, vitality and social functioning) contribute the most (Fawkes 2013).
An analysis of population averages suggests that a MCS score of less than 41 indicates a poor level of mental health (AIHW 2012). This cut-off is used to define poor mental health in this section.
In 2017, among parents with co-resident children aged 0–14, an estimated 16% had a poor level of mental health based on the MCS (Box 3 for information) (Figure 4). Parents were more than twice as likely to have poor mental health when they were in a 1-parent family compared with those in a 2-parent family (36% and 14%, respectively).
Figure 4: Parents with co-resident children aged 0–14 with a Mental Health Component Summary score of less than 41, by family type, 2009–2017
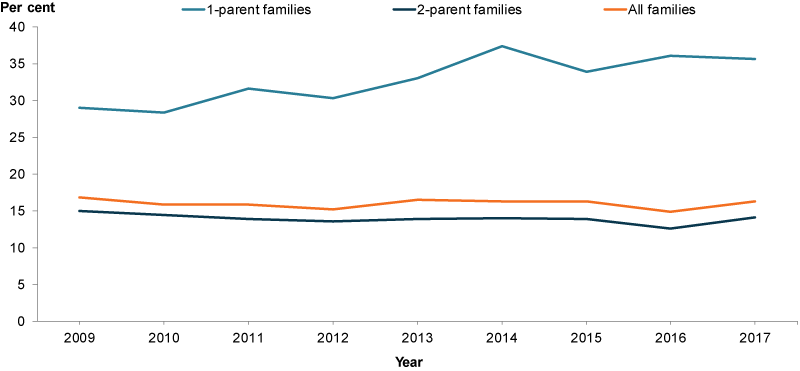
Chart: AIHW. Source: HILDA.
Does everyone rate their mental health the same?
In 2017, a higher proportion of parents living in the lowest socioeconomic areas had poor mental health compared with parents living in the highest socioeconomic areas (23% and 14%, respectively).
The proportions were not statistically different for Indigenous parents and non-Indigenous parents with poor mental health (23% and 16%, respectively). There was also no overall change in the proportion of Indigenous parents with poor mental health between 2009 and 2017 (Figure 5).
Figure 5: Parents with co-resident children aged 0–14 with a Mental Health Component Summary score of less than 41, by population group, 2017
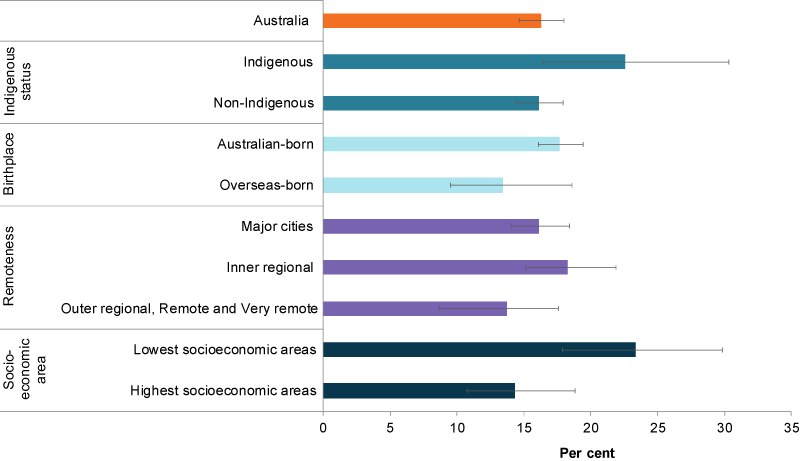
Chart: AIHW. Source: HILDA.
Parental substance abuse
This section looks at parental risky drinking and illicit drug use.
For information on:
- smoking and drinking during pregnancy, see Smoking and drinking in pregnancy
- smoking in the home, see Smoking and drinking behaviour.
Alcohol
According to the NDSHS, the proportion of parents who engaged in single-occasion risky drinking at least once a week decreased from 15% in 2010 to 12% in 2016. The proportion of parents who were lifetime risky drinkers decreased from 20% in 2010 to 16% in 2016 (Box 4).
Box 4: Defining risky drinking
The National Health and Medical Research Council published the 2009 guidelines for reducing health risks of drinking alcohol.
Guideline 1 (lifetime risk)
To reduce the risk of alcohol-related harm over a lifetime—such as chronic disease or injury—a healthy adult should drink no more than 2 standard drinks a day.
Guideline 2 (single-occasion risk)
To reduce the risks of injury on a single occasion of drinking, a healthy adult should drink no more than 4 standard drinks on any 1 occasion (NHMRC 2009).
The data for alcohol risks in this report are reported against these 2 guidelines and for a combined measure of lifetime or single-occasion risk.
In the context of the combined measure:
Low risk refers to parents who, on average, had no more than 2 standard drinks per day, and never had more than 4 standard drinks on any occasion (that is, low risk for both lifetime risk and single-occasion risk).
Risky refers to parents who either, on average, had more than 2 standard drinks per day, and/or had more than 4 standard drinks on a single occasion at least yearly (that is, risky for lifetime risk and/or single-occasion risk).
Between 2010 and 2016, the proportion of parents who engaged in risky drinking (combined measure single occasion or lifetime) declined (Figure 6). The proportion of parents who did not consume alcohol at all increased from 16% in 2010 to 19% in 2016.
Figure 6: Parents, with children aged 0–14 years, by levels of risky drinking (combined measure), 2010, 2013 and 2016
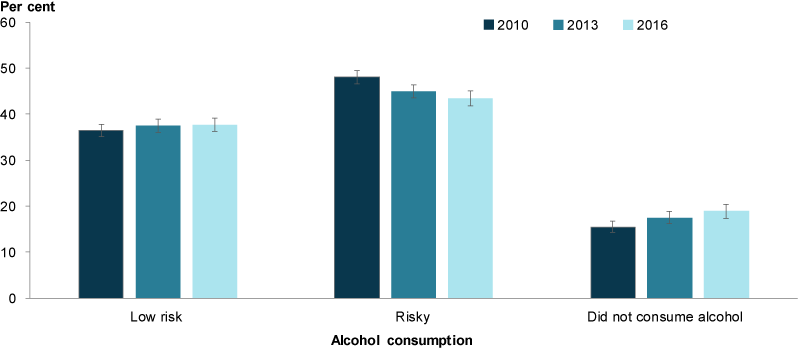
Note: See Box 4 for definitions of low risk and risky drinking.
Chart: AIHW. Source: AIHW 2017.
Substance use
In 2016, an estimated 14% of adults with a child aged 0–14 used an illicit substance within the 12 months before being surveyed (Box 5).
Box 5: Illicit substance use
Illicit substance use includes:
- illegal drugs (such as cannabis, amphetamines and heroin)
- use of pharmaceuticals for non-medical purposes (such as pain-killers or tranquilisers)
- other psychoactive substances used inappropriately (such as inhalants).
Around 29% of adults who reported using illicit substances used pharmaceuticals for non-medical purposes, and around 80% used illegal drugs (these categories do not sum to 100% as some parents may use both illicit substances and pharmaceuticals for non-medical purposes). Due to the illegal nature of illicit drugs it is likely that self-reported data underestimates the number of people using drugs.
While the proportion of parents using illegal drugs remained stable from 2010 to 2016, the proportion of adults using pharmaceuticals for non-medical purposes increased from 3.1% in 2010 to 4% in 2016 (Figure 7).
Figure 7: Parents with children aged 0–14, who have used any illicit drug within the last 12 months, 2010, 2013 and 2016
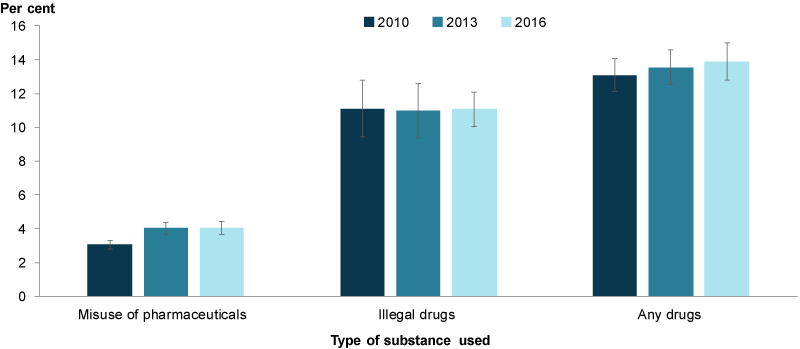
Chart: AIHW. Source: AIHW 2017.
Data limitations and development opportunities
In recent years there has been increased recognition of the role that families, especially parents, play in providing children with social support. To support them in their role, parents in turn need to be provided with adequate formal support mechanisms as highlighted by a number of priority action areas in the National Action Plan for the Health of Children and Young People: 2020–2030. However, there are few well-established national indicators that measure parenting factors and their relationship to child health. More research could be undertaken to develop a set of parenting indicators.
Where do I find more information?
For information on:
- Indigenous children and parental physical health, see: Indigenous children.
- parental health indicators, see: Parental substance use (alcohol) and Parental substance use (drugs) in the National Framework for Protecting Australia’s Children.
- drug and other substance use, see: National Drug Strategy Household Survey 2016: detailed findings.