Infant and child deaths
Data updates
25/02/22 – In the Data section, updated data related to infant and child deaths are presented in Data tables: Australia’s children 2022 - Health. The web report text was last updated in December 2019.
Key findings
- The infant death rate decreased from a peak of 5.7 deaths per 1,000 babies in 1999 to 3.3 in 2017.
- The child death rate for children aged 1–14 halved between 1998 and 2017 (20 to 10 deaths per 100,000 children); however, since 2011, the death rate has stayed in the range of 10 to 12 deaths per 100,000.
- In 2015–17, the leading causes of child (aged 1–14) deaths were injuries, cancer and diseases of the nervous system.
Death rates and causes of death are key indicators of the health status of a population. Changes in the pattern of causes of death can result from:
- changes in behaviours
- exposures to disease or injury, and social and environmental circumstances
- data coding practices (AIHW 2018b).
Infant mortality provides insight into the effectiveness of the maternal and perinatal health system (AIHW 2018c).
This section focuses on infant deaths (under the age of 1) and child deaths (ages 1–14).
Halving the gap between Indigenous and non-Indigenous child deaths (ages 0–4) by 2018 was a key priority of the Closing the Gap framework established by the Council of Australian Governments (COAG) in 2008.
While Indigenous death rates have decreased, in 2017 the rate was not within the range to meet the target by 2018, and was, therefore, not on track (PM&C 2019) (see also Closing the Gap target in death rates below in this section). If the overall target will be met by 2018 will be determined when analysis of the final year of data (2018) has been completed.
Box 1: Data sources on deaths
Deaths data are sourced from the AIHW National Mortality Database (NMD).
This database includes information on factors that caused death, and other information about the deceased person such as:
- age at death
- place of death
- country of birth
- where applicable, circumstances of death.
These data are collected in Australia by the Registrars of Births, Deaths and Marriages in each state and territory. The data are then compiled nationally by the ABS and supplemented with information from the National Coroners Information Service.
The ABS codes the data according to the International Classification of Diseases (ICD) and provides the data for the AIHW National Mortality Database. See also Technical notes.
How many infants die before turning one?
In 2017, around 1,000 deaths of infants under the age of 1—a rate of 3.3 per 1,000 live births (3.5 and 3.0 for boys and girls, respectively). Boys accounted for 55% of all infant deaths (ABS 2018).
Infant deaths comprised more than two-thirds (69%) of all deaths among children aged 0–14. Almost 3 in 4 (73%) infant deaths occurred within 4 weeks of birth and almost half (46%) on the day of birth.
What are the leading causes of infant deaths?
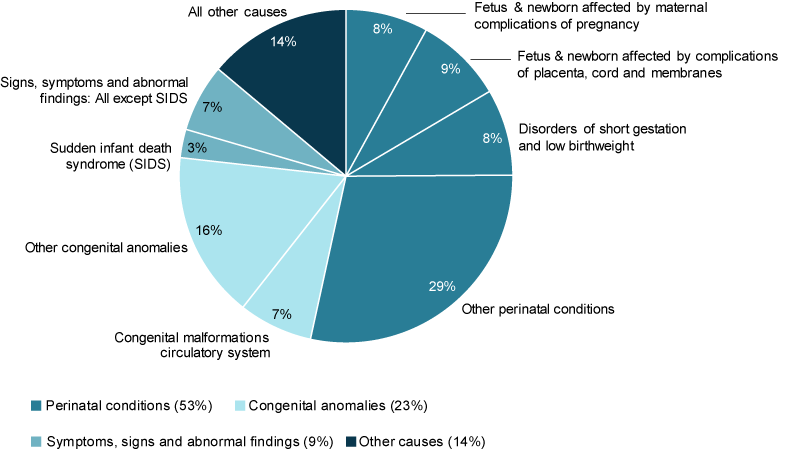
In 2015–17, 3 leading causes of infant deaths accounted for the majority (86%) of deaths:
- perinatal conditions (53%)
- congenital anomalies (23%)
- symptoms, signs and abnormal findings, including Sudden Infant Death Syndrome (SIDS) (9.3%) (Figure 1).
Of the perinatal conditions, complications of placenta, cord and membranes were the most common (9% of all infant deaths), followed by disorders of short gestation and low birthweight (8%) and maternal complications of pregnancy (8%).
SIDS accounted for 3% of all infant deaths. The rate of SIDS deaths per 100,000 live births has declined in Australia since the beginning of national public education campaigns about risk factors associated with SIDS in 1991 (AIHW 2012). Between 2007 and 2017 the rate declined from 28 per 100,000 to 6 in 2017, following a peak in 2009 of 32 per 100,000.
Figure 1: Leading causes of infant death, 2017
Note: Due to rounding the proportions do not sum to 100.
Chart: AIHW. Source: Analysis of AIHW National Mortality Database.
Has the infant death rate changed over time?
Between 1998 and 2017, the infant death rate peaked at 5.7 deaths per 1,000 babies before dropping to 3.3 deaths per 1,000 live births (Figure 2).
Boys consistently had higher death rates than girls, with their rates ranging between 1.1 and 1.3 as high as those for girls.
Figure 2: Infant death rates, 1998 to 2017
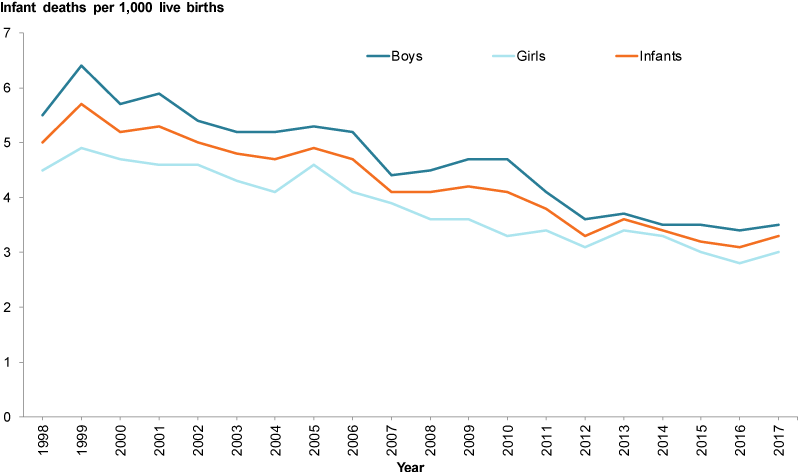
Chart: AIHW. Source: ABS 2018.
How many children (aged 1–14) die each year?
In 2017, 453 children aged 1–14 died—a rate of 10 per 100,000 children (12 per 100,000 for boys and 9.3 for girls). Boys accounted for 57% of child deaths.
The death rate for children aged 1–4 (15 per 100,000 children) was almost twice the rate for children aged 5–9 (7.8) and 1.5 times as high as the rate for children aged 10–14 (9.5).
What are the leading causes of child deaths?
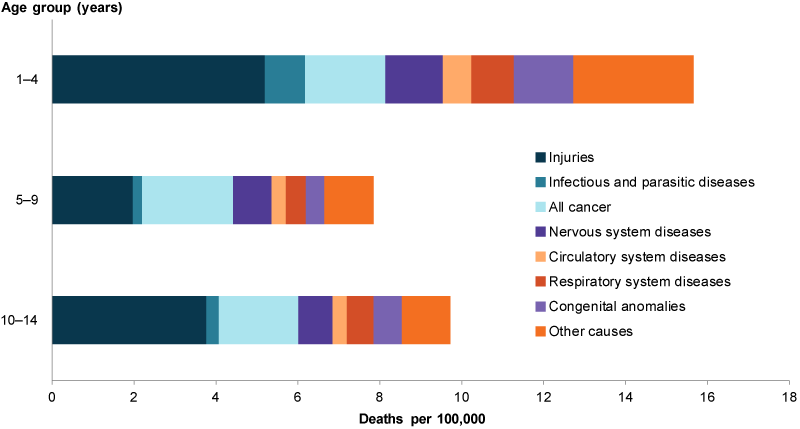
In 2015–17, the leading causes of child deaths were injuries (33%), cancer (19%) and diseases of the nervous system (10%)—rates of 3.5, 2.1 and 1.0 per 100,000 children, respectively.
Children aged 1–4 had the highest rates of death due to injury and diseases of the nervous system (Figure 3). Children aged 5–9 had the highest rates of cancer.
Figure 3: Leading causes of child deaths (aged 1–14), 2015–2017
Notes:
- Injuries includes accidental drownings.
- Congenital anomalies include congenital malformations, deformations and chromosomal abnormalities.
Chart: AIHW. Source: Analysis of AIHW National Mortality Database.
Has the child death rate changed over time?
The child death rate for children aged 1–14 halved between 1998 and 2017 (20 to 10 deaths per 100,000 children). Since 2011, the death rate has stayed in the range of 10 to 12 deaths per 100,000.
The decline in child deaths was observed for both boys and girls (23 to 12 deaths per 100,000 for boys and from 17 to 9.3 for girls). The rate for boys remained consistently higher than for girls over this period.
The decline in child death rates was evident across all 3 age groups, with the largest decrease among those aged 1–4 year (55%) compared with those aged 5–9 (37%) and 10–14 (42%) (Figure 4).
Figure 4: Child death rates (ages 1–14), 1998 to 2017
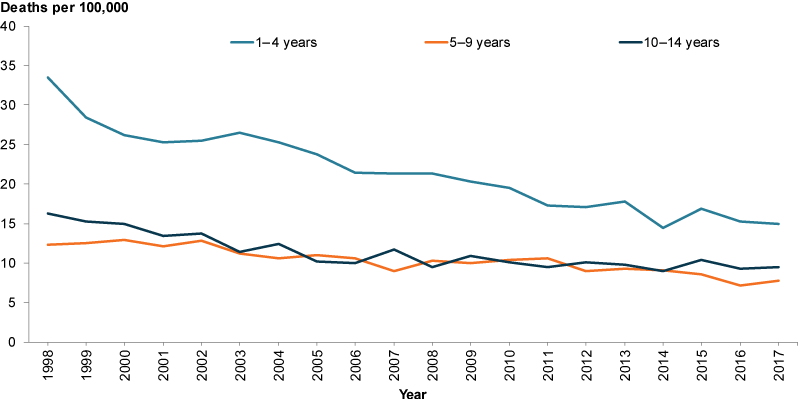
Chart: AIHW. Source: ABS 2018.
Is it the same for everyone?
Data on infant and child deaths by country of birth are not presented as the proportion of deaths for overseas-born children (age 0–14) are small (less than 3% of all child deaths) (AIHW analysis of AIHW National Mortality Database).
Infant deaths
In 2017, infant death rates were higher for different populations:
- 5.9 per 1,000 in Remote and very remote compared with 2.9 in Major cities
- 4.2 per 1,000 in lowest socioeconomic areas compared with 2.3 in highest areas.
Differences were also evident between Indigenous infant deaths and non-Indigenous (6.2 per 1,000 compared with 3.1 per 1,000). The Indigenous infant death rate decreased by almost 40% (10.2 per 1,000 to 6.2) between 2004–2006 and 2015–2017. See also Indigenous children.
Child deaths
In 2015–2017, child death rates were higher for different populations:
- 25 per 100,000 in Remote and very remote areas compared with 9.4 in Major cities
- 16 per 100,000 in the lowest socioeconomic areas compared with 6.9 in the highest areas.
Differences were also evident between Indigenous and non-Indigenous children (22 compared with 11 per 100,000, respectively). The Indigenous child death rate decreased from 26 to 22 per 100,000 between 2005–2007 and 2015–2017. See also Indigenous children.
As with infant deaths, not all of these categories are mutually exclusive. It is likely that some of these influencing factors overlap.
Figure 5: Infant and child deaths by selected population groups
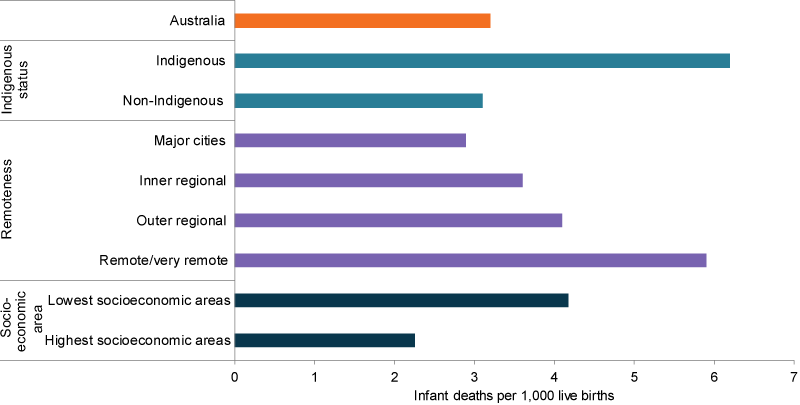
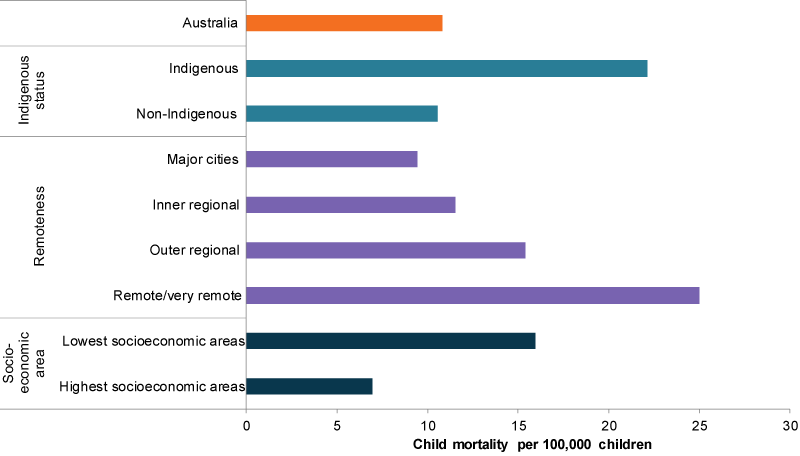
Chart: AIHW. Source: Analysis of AIHW National Mortality Database.
Closing the Gap target in death rates
In 2017, the COAG target of halving the gap in death rates for Indigenous children (aged 0–4) within a decade (by 2018) was not on track.
The rate for Indigenous children was 2.4 times the rate for non-Indigenous children (164 compared with 68 deaths per 100,000) (PM&C 2019). If the overall target will be met cannot be determined until analysis of the final year of data (2018) has been completed.
Since 2008, the Indigenous child death rate has declined by 10% (not statistically significant); however, the gap did not narrow as the non-Indigenous rate declined at a faster rate (PM&C 2019). Over the longer term, there was a 35% decline in the Indigenous child death rate between 1998 and 2017, with the gap narrowing by 29% (PM&C 2019).
In 2011–15, 4 causes of death were identified as responsible for most (90%) of the gap in child death rates between Indigenous and non-Indigenous children aged 0–4:
- pregnancy/birth-related conditions (40% of the gap)
- SIDS and other unknown causes (26%)
- accidents, injuries and other external causes (18%)
- respiratory diseases (5%) (AIHW 2018d).
Potentially avoidable deaths
Avoidable deaths are those resulting from conditions considered avoidable given timely and effective health care such as disease prevention and population health initiatives (AIHW 2018a). Deaths from most conditions are influenced by factors in addition to health system performance, including:
- underlying prevalence of conditions in the community
- environmental and social factors
- health behaviours (AHMAC 2017).
See National Healthcare Agreement: P20-potentially avoidable deaths, 2010 for a list of avoidable death conditions.
Indigenous children are particularly vulnerable to avoidable deaths.
In 2011–15, avoidable Indigenous infant deaths were twice as high as avoidable non-Indigenous infant deaths (371 compared with 187 deaths per 100,000). For Indigenous children aged 1–14, the rate was 3.5 times as high as for non-Indigenous children (17.7 compared with 5.0 deaths per 100,000) (AIHW 2017).
Injury deaths can also be considered preventable deaths. For information on injury deaths, see Injuries.
How does Australia’s infant death rate compare internationally?
In 2016, Australia’s infant death rate (3.1 per 1,000) ranked equal 12th (alongside Israel, Denmark and Austria) out of 36 Organization for Economic Co-operation and Development (OECD) countries (Figure 6). This was ahead of the OECD average (3.9 per 1,000).
Iceland had the lowest rate (0.7 per 1,000) followed by Finland (1.9) and Slovenia and Japan (both with 2.0).
Figure 6: Infant deaths rates by selected OECD countries and rankings, 2016
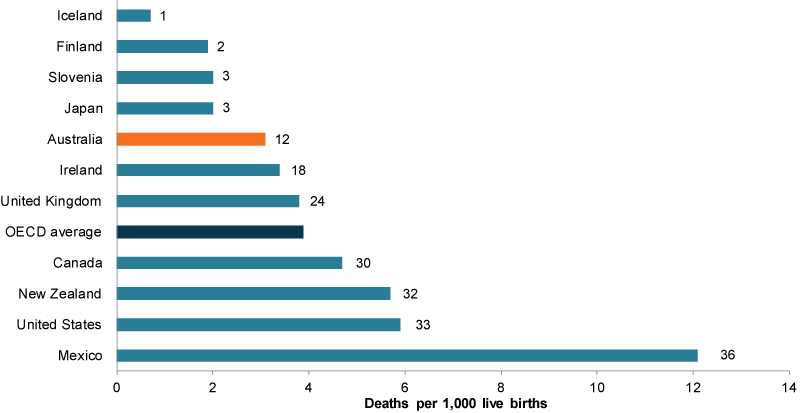
Note: Data for Canada and New Zealand are for 2014. Date for Ireland and the United States are for 2015. Data in this graph are for OECD member states only. Graph reflects top 3 countries, English-speaking background countries, and bottom ranked country.
Chart: AIHW. Source: OECD Family Database.
Data gaps and opportunities?
Mortality data can support analysis of geographic variation at the Statistical area 3 (SA3) level. A study of child mortality rates in New South Wales from 2001 to 2015, showed a great deal of geographic variation in the number and rate of child deaths, with child mortality rates higher in more disadvantaged areas, such as those with:
- higher poverty rates
- lower school engagement
- overcrowded housing
- higher rates of developmental vulnerability (NSW CDRT 2018).
Indigenous deaths data are reported for only 5 jurisdictions (New South Wales, Queensland, Western Australia, South Australia and the Northern Territory) and may not reflect the national picture. The other jurisdictions have lower levels of identification and a small number of Indigenous deaths.
Where do I find more information?
For more information on topics related to infant and child deaths in Australia’s children, see:
For information on:
- infant and child deaths, see: Infant mortality in Children’s Headline Indicators, Child and maternal health in 2013–15 and Deaths among children aged 1–14.
- Perinatal deaths, see: Perinatal deaths in Australia 2013–14.
deaths see: AIHW’s General Record of Incidence of Mortality (GRIM) books includes historical and recent deaths data and Mortality over Regions and Time (MORT) books