Children in non-parental care
Data updates
25/02/22 – In the Data section, updated data related to children in non-parental care are presented in Data tables: Australia’s children 2022 – Justice and safety. The web report text was last updated in December 2019.
Key findings
- At 30 June 2018, around 33,000 children aged 0–12 were living in out-of-home care.
- Children living in Remote and very remote areas were more than twice as likely in out-of-home care than children living in Major cities (14 per 1,000 children compared with 6 per 1,000 children).
- Based on data from Queensland, Western Australia, Tasmania, the Australian Capital Territory and the Northern Territory, the proportion of children aged 0–12 with a disability in 2018 was higher in out-of-home care compared with the general population (8.9% compared with 7%).
- According to the 2016 Census, more than 35,200 children aged 0–12 were living with 1 or more grandparent as their primary care giver.
- In 2017–18, 428 children were receiving supported accommodation services funded under the National Disability Agreement.
While the vast majority of children in Australia live with 1 or both of their parents, there are some cases where parents are unable to care adequately for their children and children are placed in non-parental care, temporarily or on an ongoing basis. The circumstances which may lead to this vary and include:
- abuse or neglect
- parental substance abuse
- mental or physical illness
- family violence
- incarceration of a parent
- death of 1 or both parents
- child’s disability or poor health
- child’s need for a more protective environment (AIHW 2012a, 2019a).
Children living in non-parental care can be a vulnerable group—especially if they have suffered family breakdown or situations involving emotional or physical trauma before being placed in non-parental care and/or have suffered additional trauma while in non-parental care (AIHW 2019a; McDowall 2013).
Research suggests that children living in non-parental care have poorer outcomes, when compared with the broader population, for:
- educational attainment
- physical and mental health
- cultural identity
- appropriate attachment behaviours
- community connections when compared with the broader population (McDowall 2013; Mclean 2016; Osborn & Bromfield 2007).
The 2016 Royal Commission into Institutional Responses to Child Sexual Abuse highlighted the vulnerability of children living in non-parental care (Box 1). However, this is not to say that all children living in these arrangements have negative experiences, are unhappy or do not feel safe, with negative outcomes more likely tied to negative experiences, such as abuse, and continuity of care rather than care itself (McDowall 2013).
Box 1: Royal Commission into the Institutional Responses to Child Sexual Abuse
The Royal Commission into Institutional Responses to Child Sexual Abuse was a 5-year inquiry undertaken to help better understand the extent and impacts of child sexual abuse victims and survivors.
It found that children in out-of-home care are highly vulnerable to sexual abuse. Separation from family of origin and instability of placements can leave children feeling isolated, lacking established relationships with trusted adults. This makes them more accessible for potential perpetrators to take advantage of opportunities for regular, unsupervised, private interactions with children, or exploit the close relationships that develop between carers and children under their care.
Aboriginal and Torres Strait Islander children, children with disability and children from culturally and linguistically diverse backgrounds are likely to encounter circumstances that put them at greater risk and are less likely to disclose abuse and/or receive an adequate response if they do (Royal Commission into Institutional Responses to Child Sexual Abuse 2016).
More than 30 of the Royal Commission’s recommendations suggest changes to aspects of the out-of-home care system to help better protect vulnerable children from sexual abuse while in care. A number relate to national child protection data collection and reporting.
The AIHW is working with the Australian and state/territory governments to progress a number of these recommendations, including updating the Child Protection National Minimum Data Set (CP NMDS) to include information about children who were the subject of a substantiation for sexual abuse while in out-of-home care.
This section focuses on children living in out-of-home care as a result of contact with child protection authorities in each Australian state and territory (Box 2).
These data are sourced from the CP NMDS. Also included are some data on children’s experiences living in out-of-home care and children living in grandparent families, at the time of the 2016 Census (see Technical notes).
Box 2: Defining children in out-of-home care
Out-of-home care is overnight care for children aged 0–17, where the state or territory pays the carer (or offers to pay, but the carer declines the offer) as the child is in need of care and protection and is unable to live with their parents (AIHW 2019a). It is considered an intervention of last resort and, wherever possible, attempts are made to reunite children with their families.
There are 5 main types of out-of-home care:
Residential care—Children are placed in a residential building the purpose for which is to provide placements for children, and where there are paid staff.
Family group homes—Children are placed in homes provided by a department or community-sector agency that have live-in, non-salaried carers, who are reimbursed and/or subsidised for providing care.
Home-based care—Children are placed in the home of a carer, who is reimbursed (or who has been offered but declined reimbursement) for expenses for the care of the child. This is broken down into: relative/kinship care, foster care, third-party parental care arrangements, and other home-based out-of-home care.
Independent living—Accommodation where the child lives independently, such as private board or part of a lead tenant households.
Other—Placements not otherwise classified, and unknown placement types, such as boarding schools, hospitals and hotels/motels. This does not include children living outside the home in supported accommodation or in placements solely funded by disability services, medical services, psychiatric services, juvenile justice facilities, or overnight child care services (AIHW 2019a).
How many children are in out-of-home care?
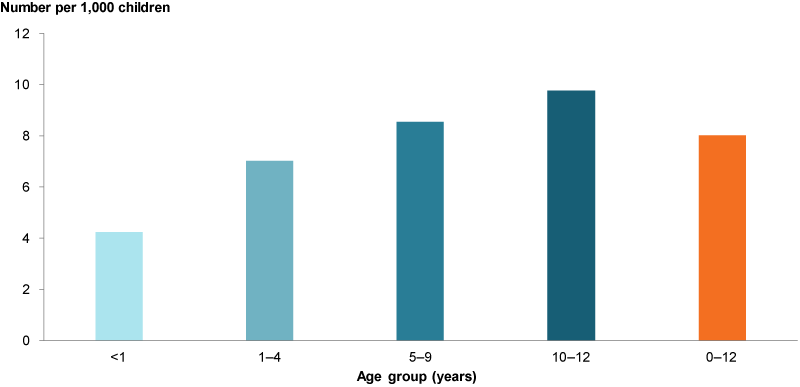
Around 33,100 children aged 0–12 were living in out-of-home care as at 30 June 2018, a rate of 8.0 per 1,000 children (Figure 1).
More boys (around 17,200) than girls (around 15,800) were in out-of-home care, a rate of per 8.1 and 7.9 per 1,000 children, respectively.
The lowest rate of children in out-of-home care was for children under the age of 1 (4.2 per 1,000). However, the rate of admission for children under the age of 1 was higher than for any other age group; consistent with the pattern seen for substantiation rates.
Figure 1: Children aged 0–12 in out-of-home care, by age group, at June 30, 2018
Note: For 2017–18, Victoria out-of-home care data excludes children on third-party parental responsibility orders. This aligns with New South Wales and Western Australia where this change was implemented in 2014–15 and 2015–16, respectively.
Chart: AIHW. Source: AIHW Child Protection National Minimum Data Set.
Has the number of children living in out-of-home care changed over time?
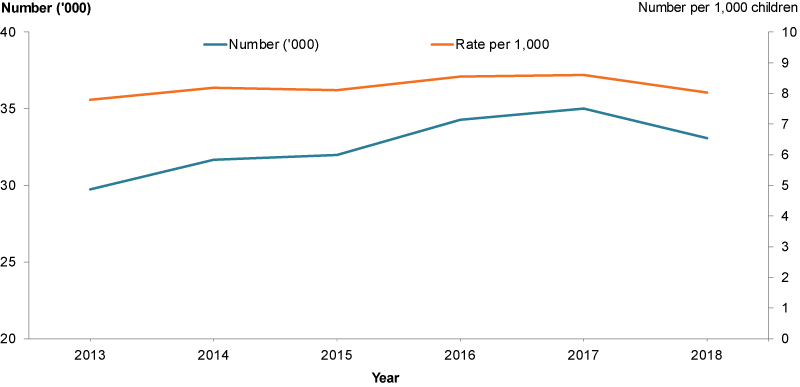
The rate of children aged 0–12 in out-of-home care in Australia stayed relatively stable between 30 June 2013 and 30 June 2018 (Figure 2). The only exceptions were 2016 and 2017 when the rates were slightly higher (8.5 and 8.6 per 1,000 children, respectively).
The number of children ranged from around 29,700 at 30 June 2013, up to around 35,000 at 30 June 2017, before slightly declining to around 33,100 at 30 June 2018.
Figure 2: Children aged 0–12 in out-of-home care, 30 June 2013 to 30 June 2018
Note: For 2017–18, Victoria out-of-home care data excludes children on third-party parental responsibility orders. This aligns with New South Wales and Western Australia where this change was implemented in 2014–15 and 2015–16, respectively.
Chart: AIHW. Source: AIHW Child Protection National Minimum Data Set.
Do rates of children in out-of-home care vary by population group?
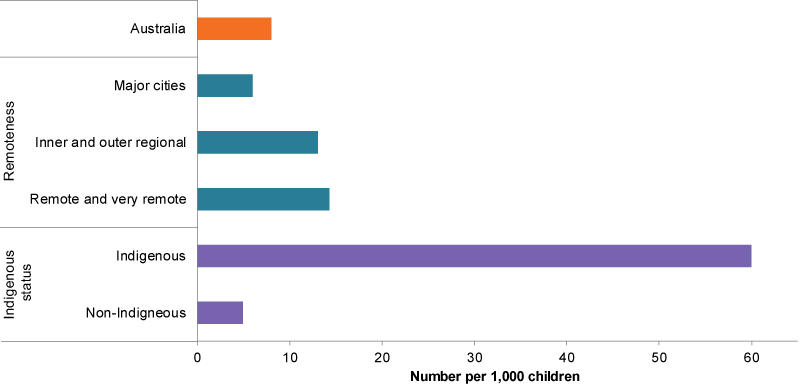
The rate of children aged 0–12 living in out-of-home care at 30 June 2018 varied depending on population group (Figure 3).
The rate increased with remoteness. Children living in Remote and very remote areas were more likely in out-of-home care as children living in Major cities (14 per 1,000 children compared with 6 per 1,000 children).
Indigenous children (excluding Tasmania) were also more likely than non-Indigenous children to be living in out-of-home care (60 per 1,000 children compared with 5 per 1,000).
Figure 3: Children aged 0–12 in out-of-home care at 30 June, 2018
Notes
- For 2017–18, Victoria out-of-home care data excludes children on third-party parental responsibility orders. This aligns with New South Wales and Western Australia where this change was implemented in 2014–15 and 2015–16, respectively
- Due to data quality issues, Indigenous status disaggregation exclude Tasmania.
Chart: AIHW. Source: AIHW Child Protection National Minimum Data Set.
For the 5 jurisdictions with available data—Queensland, Western Australia, Tasmania, the Australian Capital Territory and the Northern Territory—it was estimated that under 10% of children aged 0–12 living in out-of-home care had a disability. This was true for both 2017 and 2018 (9.6% and 8.9%, respectively) (see Technical notes). It was higher than the proportion of children with a disability in the general population (7%) (see Children with disability).
What are the different living arrangements for children in out-of-home care?
A child can be placed in 5 main types of out-of-home care (Box 2).
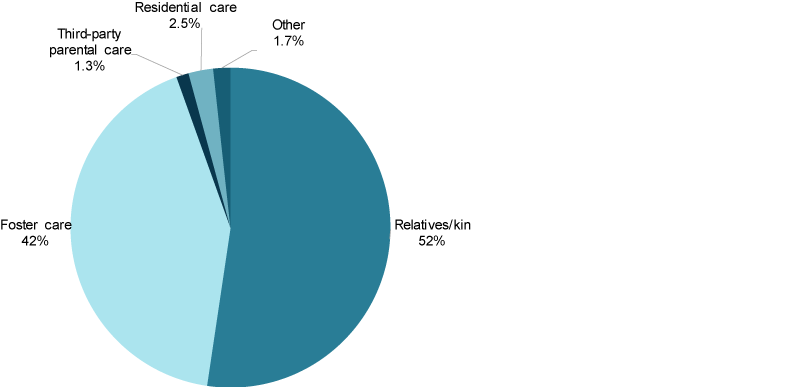
By far the most common type is home-based care (96% of all out-of-home care for children aged 0–12) (Figure 4), which includes relative/kinship care, foster care and third-party parental care arrangements.
Residential care accounted for just over 2% of all out-of-home care arrangements, and all other types combined accounted for less than 2%.
Figure 4: Proportion of children aged 0–12 in out-of-home care, by type of care at 30 June 2018
Note: For 2017–18, Victoria out-of-home care data excludes children on third-party parental responsibility orders. This aligns with New South Wales and Western Australia where this change was implemented in 2014–15 and 2015–16, respectively.
Chart: AIHW. Source: AIHW Child Protection National Minimum Data Set.
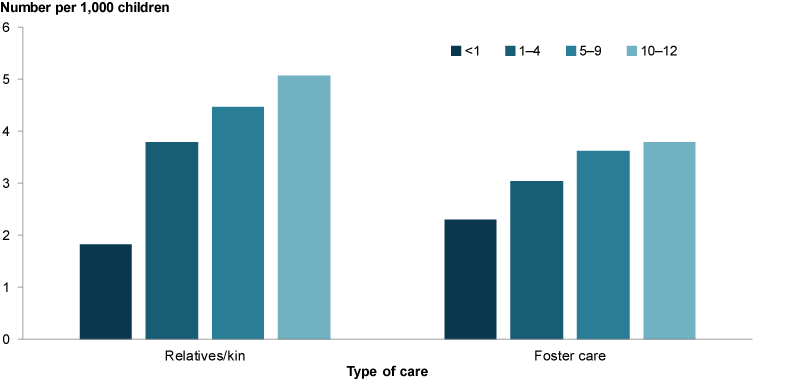
For children living in home-based care, relative/kinship care was the most common and foster care the second most common (rates of 4.2 and 3.4 per 1,000 children respectively). This was true for all age groups, except for children under the age of 1, where foster care was the most common (a rate of 2.3 per 1,000 children for foster care compared with 1.8 for relative/kinship care) (Figure 5).
Rates of children in relative/kinship and foster care increased with age. Children aged 10–12 were twice as likely as children under the age of 1to be in relative/kinship care (5.1 per 1,000 compared with 1.8).
Figure 5: Children aged 0–12 in out-of-home care, by type of care and age at 30 June 2018
Note: For 2017–18, Victoria out-of-home care data excludes children on third-party parental responsibility orders. This aligns with New South Wales and Western Australia where this change was implemented in 2014–15 and 2015–16, respectively.
Chart: AIHW. Source: AIHW Child Protection National Minimum Data Set.
Indigenous children (excluding Tasmania) had higher rates than non-Indigenous children for all types of care. Relative/kinship care was more common than foster care and residential care for Indigenous children (30.9 per 1,000 children compared with 25 and 1.7 per 1,000 children, respectively).
What do children think about living in out-of-home care?
Results from the 2018 national survey of children in out-of-home care provide some insight on the views of children living out of home.
The survey included children aged 8–17 and according to responses:
- Most children aged 8–9 and 10–14 felt both safe and settled in their current placement (91% and 93%, respectively).
- More children aged 10–14 (67%) felt ‘they usually got to have a say and usually felt listened to’ compared with children aged 8–9 (53%).
- Around two-thirds of children aged 8–9 and 10–14 felt they received adequate support to participate in all activities (64% and 65%, respectively).
- Most children aged 8–9 and 10–14 felt close to their co-resident family, non-co-resident family or both in their current placement (94% and 96%, respectively).
- More children aged 10–14 (71%) were satisfied with 1 or more types of contact with family members compared with children aged 8–9 (59%).
- Most children aged 8–9 and 10–14 reported having at least some knowledge of family background (85% and 91%, respectively).
- A large number of children aged 8–9 and 10–14 reported having at least some perceived support to follow their culture (84% and 83%, respectively).
- Around four-fifths children aged 8–9 and 10–14 reported at least some satisfaction with contact with close friends (77% and 80%, respectively).
- Nearly all (98%) children aged 8–9 and 10–14 reported they had a significant adult in their life (AIHW 2019b).
Other data on non-parental care
Grandparent families
According to the 2016 Census, around 60,600 families in Australia would be considered grandparent families at the time of the 2016 ABS Census (see Technical notes). Within those families, more than 35,200 children aged 0–12 were living with 1 or more grandparent as their primary care giver. Two-fifths (40%) of these were aged 5–9, and 5% under the age of 1. This age distribution was very similar to children living in out-of-home care.
Some children living in grandparent families will also be included in the number of children living with relatives/kin in out-of-home care. In addition to grandparent families, a child can be placed in other family-based care arrangements, such as with an aunt and/or uncle. Data of these arrangements are unavailable.
Children living in disability supported accommodation facilities
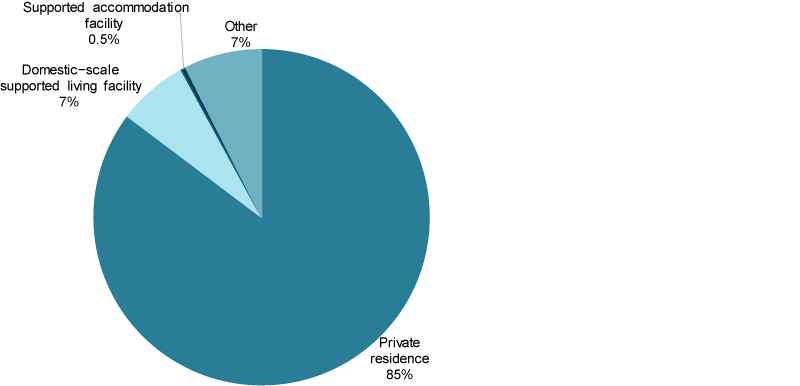
Children with disability can access a range of accommodation support services funded by state and territory governments. In 2017–18, just over 1% (428) of the approximately 38,200 children aged 0–14 accessing disability support services received supported accommodation services funded under the National Disability Agreement. A small proportion of these lived outside a private dwelling—7% (around 30 children) lived in a supported accommodation facility or a domestic-scale supported living facility (Figure 7). Most (82%) children who received accommodation support while living in a private residence had a co-resident parent as their primary carer.
Older children were more likely living in a supported accommodation facility or domestic scale-supported accommodation facility than younger children. Most (87%) of these children were aged 10–14 (AIHW 2019c).
These data underestimate the proportion of children living in a supported accommodation facility, as children receiving support through the National Disability Insurance Scheme are not included in these data. There may also be some children with disability living in non-parental care; for example, foster care, who are not represented in disability data or separately identified in child protection data.
Figure 6: Children aged 0–14 who received disability accommodation support services, by residential setting, 2017–18
Note: Other includes ‘not stated’.
Chart: AIHW. Source: AIHW Disability Services National Minimum Data Set.
Data limitations and development opportunities
National data development work is underway to support national reporting on the stable long-term care arrangements of children, such as:
- with third parties
- through implementation of the Aboriginal and Torres Strait Islander Child Placement Principle
- through transition outcomes for children exiting out-of-home care, including reunification with parents.
More comprehensive national data on the reasons why children are placed in out-of-home care—beyond the type of abuse a child experienced before placement—and the contact children in care have with their birth families would also be informative.
Where do I find more information?
For more information on:
- Indigenous children in out-of-home, see: Indigenous children
- children in out-of-home care, see: Out-of-home care in the National Framework for Protecting Australia’s Children
- on child protection data, see: Child Protection National Minimum Data Set (CP NMDS) and Child Protection Australia 2017–18
- the second national out-of-home care survey, see: The views of children and young people in out-of-home care: overview of indicator results from second national survey, 2018.
ABS (Australian Bureau of Statistics) 2016. Census of Population and Housing: understanding the Census and Census data, Australia. ABS cat. no. 2900. Canberra: ABS.
AIHW (Australian Institute of Health and Welfare) 2012a. Child protection Australia 2010–11. Child welfare series no. 53. Cat. no. CWS 41. Canberra: AIHW.
AIHW 2019a. Child protection Australia: 2017–18. Child welfare series no. 70. Cat. no. CWS 65. Canberra: AIHW.
AIHW 2019b. The views of children and young people in out-of-home care: overview of indicator results from the second national survey 2018. Cat. no. CWS 68. Canberra: AIHW.
AIHW 2019c. Users of NDA services, 2017–18, data cube. Canberra: AIHW. Viewed 21 August 2019.
McDowall JJ 2013. Experiencing out-of-home care in Australia: the views of children and young people (CREATE Report Card 2013). Sydney: CREATE Foundation.
McLean S 2016. Children’s attachment needs in the context of out-of-home-care. CFCA Practitioner Resource. Melbourne: AIFS. Viewed 22 May 2019.
Osborn A & Bromfield L 2007. Outcome for children and young people in care. NCPC Brief no. 3. Melbourne: AIFS.
Royal Commission into Institutional Responses to Child Sexual Abuse 2016. Consultation paper: institutional responses to child sexual abuse in out-of-home care. Sydney: Royal Commission into Institutional Responses to Child Sexual Abuse. Viewed 22 May 2019.
AIHW Child Protection National Minimum Data Set
- Rates and numbers discussed throughout refer to children in out-of-home care on 30 June of a given year, not the number who entered during the reporting period.
- Excluded from these counts are placements in supported accommodation, solely funded by disability services, medical services, psychiatric services, juvenile justice facilities, or overnight child care services, and children living with parents where the jurisdiction makes a financial payment. Placements for the purpose of respite are included. Respite care is used to provide short-term accommodation for children and young people, where the intention is for the child to return to his or her prior place of residence. This includes respite from birth family and respite from placement.
- The scope of national out-of-home care reporting has been subject to substantial national data comparability issues, due to variations in jurisdictional legislation, policy, and practice. Differences between jurisdictions arise when considering: inclusion or exclusion of children on third-party parental responsibility orders, children on immigration orders, young people aged 18 and over and children in pre-adoptive placements.
- The AIHW is working with all state and territory governments to improve the consistency of future national out-of-home care reporting.
- In Tasmania, Indigenous status was not cross-checked with data from other databases in 2017–18. This resulted in a higher proportion of clients with an ‘unknown’ Indigenous status than in previous years. Due to the impact this had on the reliability of data disaggregated by Indigenous status, Tasmania were excluded from analyses disaggregated at this level for the 2017–18 year. Tasmania has been working to rectify this issue and will revise this data in the future. As a result, this report may not match data in future AIHW publications.
- Data on disability for children in out-of-home care are also not uniformly captured, and for those that jurisdictions that do capture disability data, there are differences in how it is defined and those conditions classified as such. For more information about policy priorities for children with disability see National Framework for Protecting Australia’s Children 2009–2020.
- The differences in legislation, policy, and definition between jurisdictions, and detailed information on recent policy and practices changes are outlined in Appendixes C–E (online) of Child protection in Australia: 2017–18 (PDF, 435kB)
- For more information about the data, see AIHW Child Protection National Minimum Data Set.
ABS 2016 Census of Population and Housing
- In the 2016 ABS Census, families are identified and classified in terms of the relationship that exists between a single family reference person and each other member of the family. Grandparent families are recognised where there is a grandparent-grandchild relationship in a family and no parent-child relationship (ABS 2016). For this report, Census results have been analysed to identify the number of children 0-12 living in grandparent families.
- For the purposes of the ABS Census, families are usually residing in the same household.
For more information, see Methods.


