Asthma prevalence among children
Key findings
- In 2017–18, an estimated 10% (around 460,000) of Australian children aged 0–14 were reported to have asthma as a long-term condition.
- Asthma prevalence was twice as high among children with disability (18%) compared with children with no reported disability (8.9%).
- Between 2007–2008 and 2017–18, prevalence of child asthma remained similar (between 9.3% and 11%).
Asthma is a common respiratory condition characterised by chronic inflammation of the airways. It causes episodes of wheezing, shortness of breath, coughing and chest tightness due to widespread narrowing of the airways.
The severity of the symptoms varies between individuals (National Asthma Council Australia 2019b). Asthma was the leading cause of disease burden for children in Australia in 2011; however, child deaths from asthma are relatively low (23 deaths of children 2014–2016) (AIHW 2011, 2018).
While the underlying causes of asthma are still not well understood, a wide range of factors have been identified as triggers for asthma, prompting or exacerbating asthma symptoms. Triggers differ between individuals, and can include viral infections, exposure to specific allergens, irritants, exercise, some chemical or food additives and genetic factors (National Asthma Council Australia 2019a).
Tobacco smoke is a common irritant that exacerbates asthma symptoms. Children can be exposed to second-hand tobacco smoke in the household, or through maternal smoking (passive or active) during pregnancy. The prevalence of asthma has been found to be greater among children living in households with smokers, with the risk of developing asthma reported to increase in proportion with the number of smokers in the home (Campbell et al. 2017). See also Smoking and drinking during pregnancy and Smoking and drinking behaviour.
Most factors contributing to asthma can be controlled with the appropriate use of preventative and relief medication, in addition to avoiding or controlling trigger factors. For some people, however, asthma can place considerable restrictions on their physical, social and emotional lives. Experiences such as going back to school can cause an asthma flare-up for a child who may be impacted by the stress of returning to school, allergic triggers at school or being in close proximity to new classmates with viruses (National Asthma Council Australia 2019c).
Box 1: Sources and definitions
Data on asthma is from the ABS National Health Survey, conducted in 1989–90, 1995, 2001, 2004–05, 2007–08, 2011–12, 2014–15 and, most recently, in the 2017–18.
The survey collects information on the health status of the population, including long-term conditions; health risks; demographic and socioeconomic characteristics.
An adult was nominated to respond on behalf of each child included in the survey. The nominated respondent was asked if the child had ever been told by a doctor or nurse that they have asthma. Children with asthma is defined as those with a response of having been diagnosed by a doctor or nurse as having asthma and it is considered current and long-term (that is, had lasted, or was expected to last, for 6 months or more).
The 2017–18 survey was conducted from a sample of approximately 21,300 people from 16,400 private dwellings across Australia.
While urban and rural areas in all states and territories were included, very remote areas of Australia and discrete Indigenous communities were excluded.
Data on asthma prevalence in the Indigenous population is from the ABS Australian Aboriginal and Torres Strait Islander Health Survey, 2012–13. The survey included approximately 5,900 non-remote and 3,400 remote participants across Australia, and collected information on a range of demographic and health characteristics of Indigenous people.
How many children have asthma?
In 2017–18, an estimated 10% (around 460,000) of Australian children aged 0–14 had asthma as a long-term condition. Asthma was more common among boys aged 0–14 years (12%) compared with girls (7.9%). This pattern has been consistent since 2001 (ABS 2018).
Asthma prevalence was highest among children aged 5–9 for boys (15%) and girls (10%). The prevalence of asthma among children aged 0–14 was similar to the general population (11%) (Figure 1).
Figure 1: Prevalence of asthma among children aged 0–14, 2017–18
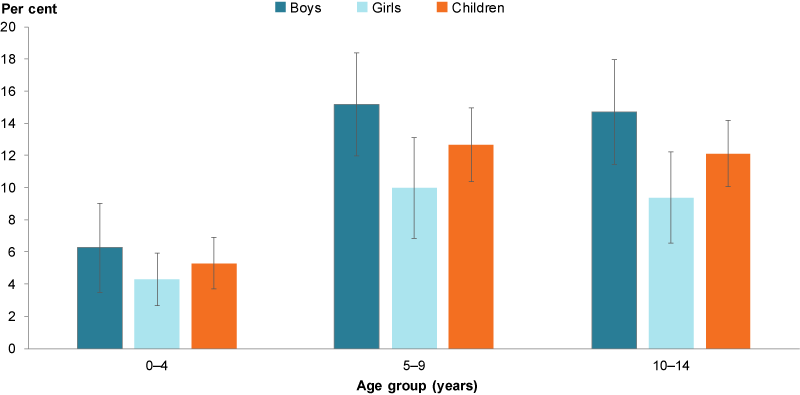
Note: Asthma prevalence is based on having been diagnosed by a doctor or nurse as having asthma (current and long term).
Source: AIHW analysis of ABS 2018.
Have asthma rates changed over time?
While the prevalence of current asthma among children increased during the 1980s and early 1990s, between 2001 and 2007–08 the prevalence among children aged 0–15 decreased from 13.5% to 9.9% (age standardised rates). This trend is based on the older National Health Survey definition of ‘Do you still get asthma?’ from the 2001, 2004–05 and 2007–08 National Health Surveys. See Australian Centre for Asthma Monitoring 2011 for more details.
Between 2007–08 and 2017–18, prevalence of child asthma remained similar (between 9.3% and 11%) (Figure 2). These data are based on the revised definition of current asthma as defined in Box 1.
Figure 2: Prevalence of asthma over time among children aged 0–14, 2007–08 to 2017–18
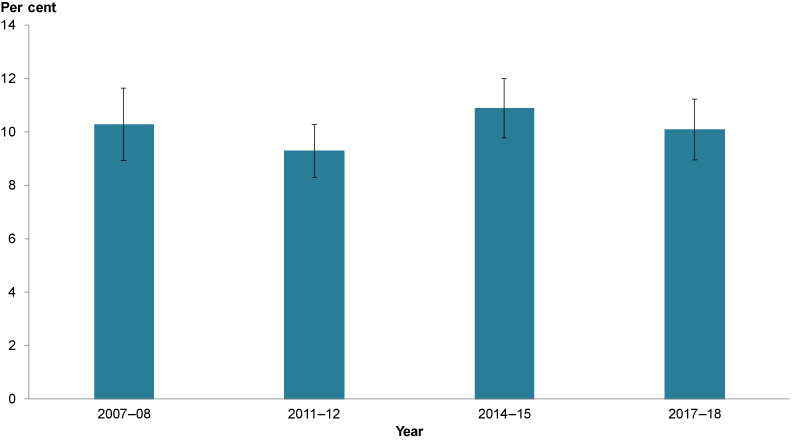
Sources: ABS 2010; ABS 2012; ABS 2015; ABS 2018.
Is asthma prevalence the same for everyone?
According to self-reported data in the 2012–13 Australian Aboriginal and Torres Strait Islander survey, asthma prevalence for Indigenous children (15%) was significantly higher than in non-Indigenous children (9.3%) (ABS 2014) (Figure 3).
Figure 3: Prevalence of children aged 0–14 with asthma, by Indigenous status, 2012–13
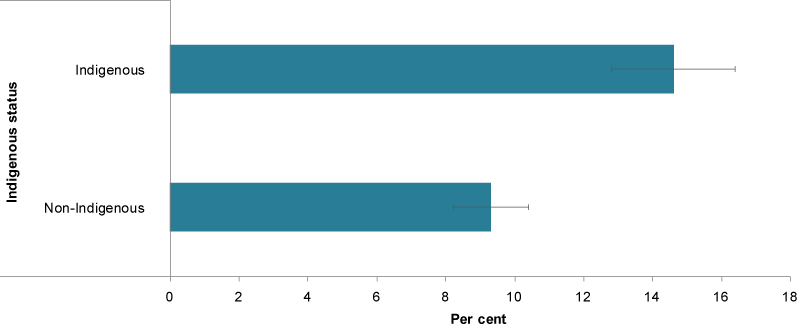
Source: ABS 2014.
In 2017, Asthma prevalence was twice as high among children with disability (18%) compared with children with no reported disability (8.9%) (ABS 2019) (Figure 4).
Differences were also evident between children living in the lowest socioeconomic areas (12%) and the highest (8.4%), and between children living in a 1-parent family compared with children living in a 2-parent family (13% compared with 9.4%, respectively) (ABS 2019).
Figure 4: Prevalence of asthma among children aged 0–14, by populations group, 2017–18
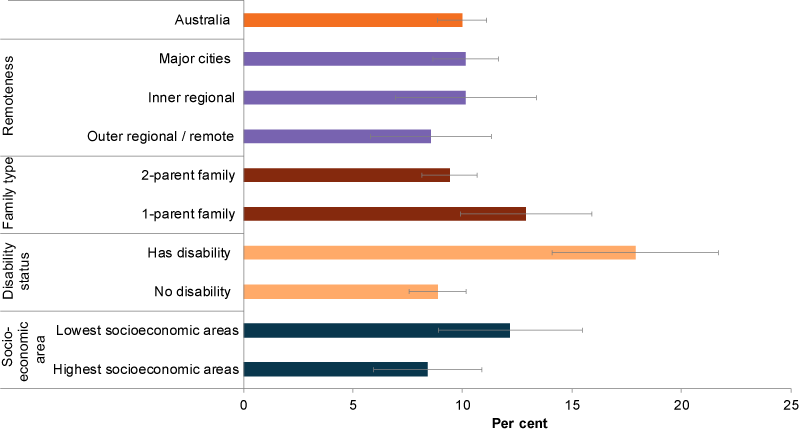
Source: AIHW analysis of ABS 2019.
Data limitations and development opportunities
Asthma symptoms, triggers and treatment vary between individuals. Currently, limited data are available about asthma treatment by general practitioners. Understanding the experiences of patients with asthma may provide greater insight into the physical, social and financial burden of the condition.
Where do I find more information?
For more information on topics related to asthma in Australia’s children, see:
For more information on:
- asthma, see: Asthma snapshot in AIHW’s Chronic respiratory conditions and Australian Asthma Handbook.
See also Methods.