Immunisation
Data updates
25/02/22 – In the Data section, updated data related to immunisation are presented in Data tables: Australia’s children 2022 - Health. The web report text was last updated in December 2019.
Key findings
- The number of children who are fully immunised remained high in 2018.
- More than 9 in 10 (91%) children aged 2 were fully immunised.
Vaccination initiates the body’s natural defence mechanism - the immune response - to build resistance to specific infections (immunise). It is a safe and effective way to protect against harmful communicable diseases.
Vaccines are a powerful and cost-effective public health intervention, significantly reducing the risk of disease, disability and death, particularly in childhood (McGovern & Canning 2015; Orenstein & Ahmed 2017; WHO 2016). Successful immunisation interventions include the worldwide eradication of smallpox and the widespread elimination of poliomyelitis (polio).
Children who do not receive complete and timely vaccinations are at risk of contracting vaccine-preventable diseases and the short and long-term health consequences associated with these.
Immunisation also helps to protect people who are not immunised through a process called ‘herd immunity’, where enough people are immunised against a disease to stop the infection from spreading. Herd immunity helps to protect those more at risk of getting the disease, as well as those who are unvaccinated, so that those who are too young or too sick to be vaccinated can be protected. Outbreaks can occur where there is low immunisation coverage.
Measuring childhood immunisation coverage helps track how protected the community is against vaccine-preventable diseases and reflects the capacity of the health-care system to effectively target and provide vaccinations to children. Due to a higher level of immunisation coverage needed to protect the community against measles, Australia’s aspirational childhood coverage target has been set at 95% to achieve herd immunity against all vaccine-preventable diseases (DoH 2016).
To increase childhood immunisation rates, to be eligible for the full rate of Family Tax Benefit Part A, children need to be immunised in accordance with the National Immunisation Program childhood vaccination Schedule, on an approved catch-up schedule or have an approved exemption (DSS 2019). Incentive payments are made to vaccination providers and general practitioners who follow up and vaccinate children more than 2 months overdue for their childhood vaccinations (DoH 2019a).
Box 1: Data sources on immunisation
Australian Immunisation Register
Data on rates of immunisation come from the Australian Immunisation Register (AIR), administered by the Australian Government Department of Human Services.
Children are registered on the AIR if they have Medicare, or when they first receive a vaccination. The AIR is a nearly complete population register, as approximately 99% of children are enrolled in Medicare by 12 months of age (Hull et al. 2019).
Children identified as Aboriginal and/or Torres Strait Islander in this report reflect the Indigenous status recorded on the AIR, which is based on Medicare enrolment records (AIHW 2018b). Indigenous status in Medicare records is based on the Medicare Voluntary Indigenous Identifier introduced in 2002 (AIHW 2010).
The AIR includes vaccines funded under the National Immunisation Program (NIP). A series of vaccinations are given at specific times throughout a person’s life. The NIP provides free vaccines to eligible people (including babies, young children, teenagers and older Australians) to help reduce diseases that can be prevented by vaccination.
Childhood immunisation coverage is the percentage of children registered on the AIR who have had all the vaccines recommended for their age in the NIP Schedule. For children aged 2, these are:
- diphtheria, tetanus, pertussis (DTP or whooping cough) (4 doses)
- polio (3 doses)
- hepatitis B (3 doses)
- haemophilus influenza Type b (4 doses)
- pneumococcal (3 doses)
- meningococcal (1 dose)
- measles, mumps, rubella (2 doses)
- varicella (chickenpox) (1 dose).
Additional vaccines are required for Indigenous children in Queensland, Western Australia, South Australia and Northern Territory, as well as some medically at-risk children.
The NIP schedule is subject to change. For the most recent schedule, see: National Immunisation Program Schedule.
National Notifiable Diseases Surveillance System
Data on rates of notifiable vaccine-preventable diseases come from the National Notifiable Diseases Surveillance System (NNDSS), which coordinates the national surveillance of more than 50 communicable diseases or disease groups. Under the NNDSS, doctors, diagnostic laboratories and hospitals are required by law to notify their state or territory health authority when cases of particular communicable diseases are identified. This data are collated, analysed and published on the internet by the Department of Health every day.
How many children are immunised at age 2?
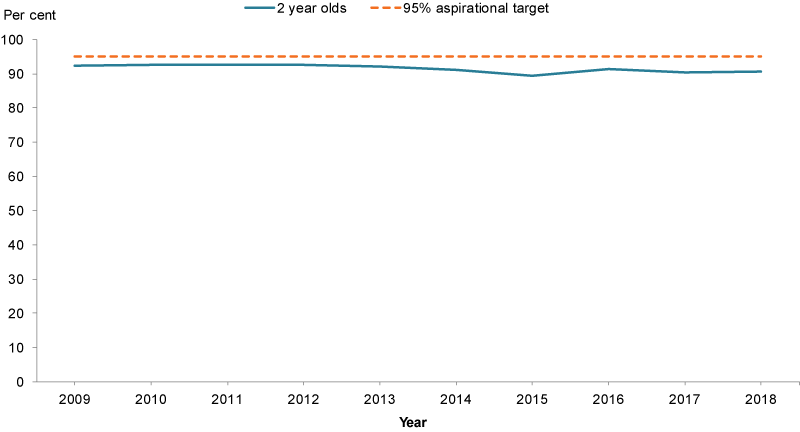
More than 9 in 10 (91%) children aged 2 were fully immunised in 2018. This was slightly lower than coverage rates for children aged 1 (94%) and 5 (95%) due to changes to the NIP Schedule in 2016 (DoH 2019b).
Have immunisation rates changed over time?
The proportion of children fully immunised at age 2 remained relatively stable at around 91% to 93% between 2009 and 2018, dropping slightly to 89% in 2015 and 90% in 2017 (Figure 1).
These drops in the coverage rate are due to the inclusion of additional vaccinations to the NIP Schedule in December 2014 and March 2017. The more vaccinations included in the criteria to be fully immunised, the higher the likelihood of reduced coverage rates. However, historical data indicates this usually resolves over time as the changes become more routine (DoH 2019b).
Figure 1: Proportion of children aged 2 who were fully immunised, 2009 to 2018
Source: AIR, unpublished data.
Do rates of immunisation vary across population groups?
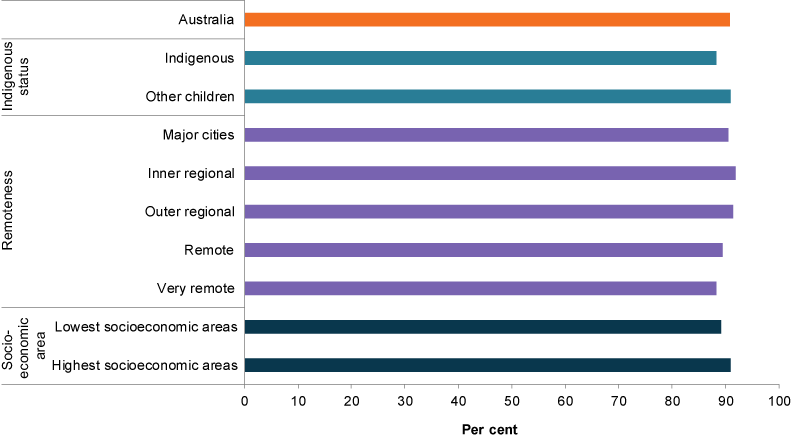
In 2018, children living in Inner regional areas had the highest rate of complete immunisation at age 2 (92%), followed by:
- Outer regional areas (91%)
- Major cities (91%)
- Remote areas (90%)
- Very remote areas (88%).
Children living in areas of least socioeconomic disadvantage were slightly more likely than those living in areas of greatest disadvantage to be fully immunised at age 2 (91% compared with 89%).
Differences were also evident between Indigenous children (88%) and non-Indigenous children (91%) (Figure 2). Indigenous childhood immunisation rates fluctuated between 2009 and 2018, decreasing from 90% in 2009 to 86% in 2015, before increasing to 88% in 2018. See also Indigenous children.
Figure 2: Proportion of children aged 2 who were fully immunised, by priority population group, 2018
Source: AIR, unpublished data.
How does Australia compare internationally?
The percentage of children receiving diphtheria, tetanus and pertussis (DTP) is often used as an indicator of how well countries are providing routine immunisation services (UNICEF 2019). Internationally comparable data for immunisation coverage are only available for children aged 1.
Overall, OECD member countries have high DTP immunisation coverage for children aged around 1, ranging from 82% to 99% in 2018. The Australian rate was equal to the OECD average of 95%.
Notifications of childhood diseases
Factors influencing notification rates for vaccine-preventable diseases include:
- natural history of a disease
- length of time that an immunisation program has been in place
- particulars of the immunisation program (for example, receiving all injections at the required age)
- immunisation coverage.
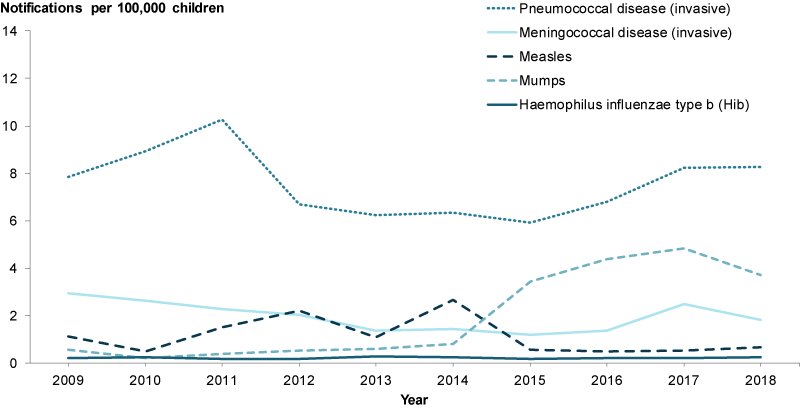
Notification rates for some vaccine-preventable diseases fluctuated between 2009 and 2018 (Figure 3). According to the National Notifiable Diseases Surveillance System, for children aged 0–14:
- There were no notifications of diphtheria or poliomyelitis (polio), and only 3 notifications of tetanus (2 in 2017 and 1 in 2018) between 2009 and 2018.
- Notification rates of mumps increased from 0.6 notifications per 100,000 children in 2009 to 3.4 in 2015 when an outbreak occurred (AIHW 2018a). The rate peaked at 4.9 in 2017 before dropping slightly to 3.7 in 2018 (Figure 3).
- Haemophilus influenza type b remained stable at around 0.2–0.3 notifications per 100,000 children between 2009 and 2018.
- Rates of invasive meningococcal disease decreased from 2.9 per 100,000 children in 2009 to 1.2 in 2015, before increasing to 2.5 in 2017.
- Notification rates of invasive pneumococcal disease peaked at 10.3 per 100,000 children in 2011 before declining to 5.9 in 2015, following the introduction of a more comprehensive pneumococcal vaccine in July 2011. The rate increased to 8.2 in 2017 and 2018.
- There were 18 notifications of rubella between 2009 and 2018, with the notification rate ranging from 0 and 0.1 per 100,000 children over this period.
- There were outbreaks of measles in 2012 and 2014, with notification reaching 2.2 per 100,000 children in 2012 and 2.7 in 2014. Notifications of measles then dropped, with 0.7 cases per 100,000 children reported in 2018.
Figure 3: Trend in notifications of selected communicable diseases among children aged 0–14, 2009–2018
Source: AIHW analysis of NNDSS data.
Data limitations and development opportunities
The integration of AIR data with other national data sets, for example hospitals or education, will enhance understanding of the outcomes of children who are vaccinated.
For more information on how data linkage can fill data gaps, see Data gaps.
Where do I find more information?
For more information on:
- immunisation for Indigenous children, see: Indigenous children
- Immunisation rates for children aged 1, 2 and 5 by Primary Health Network (PHN), see: Immunisation rates for children in 2016–17
- a range of vaccine-preventable diseases in Australia, including information on the number of cases reported, hospitalisations and deaths, see: Vaccine-preventable diseases.