Families
Key findings
- Data from the Longitudinal Study of Australian Children (LSAC) in 2016 estimated that 9 out of 10 primary carers of children aged 12–13, said their family’s ability to get along with one another was good, very good or excellent.
- According to the 2014 Australian Child Wellbeing Project (ACWP), 59% of children with disability spent time having fun together with their family most days in the week—less than children who do not have disability (73%) (2014 ACWP).
- Data from LSAC in 2016 show that 9 out of 10 children aged 12–13 would talk to their mum and/or dad if they had a problem.
- 3 out of 5 children spent time taking care of their siblings or other family members at least once a week.
For most children, their family offers them love, support and a sense of belonging. While what constitutes a family can vary widely, the benefits of being part of a strong and positive family unit are more universal. A strong and positive family unit can:
- help children form social networks
- provide children with resources, care and a safe place to learn and explore
- teach children about the world and the rules that govern it (Scott 2013; Pezzullo et al. 2010).
Families are also considered to be an important determinant of how children view quality of life, with family ranked the most important domain for having a good life by all year levels participating in the 2014 ACWP (Redmond et al. 2016). Being part of a strong, positive family unit is known as positive family functioning. For this section, family functioning has been considered in terms of 6 overlapping domains (Table 1).
|
Domain |
Characteristics include |
|---|---|
|
Emotional |
Closeness of relationships, warmth, responsiveness, sensitivity, support, community, and security/safety. |
|
Governance |
Age-appropriate rules, expectations and consistency in parenting. |
|
Engagement and cognitive development |
Family cohesion and quality time spent fostering various skills and interests. |
|
Physical health |
Access to services, products and activities aimed at improving or maintaining good physical health. |
|
Intra-familial relationships |
Quality of relationships between family members and their overall ability to get along with one another. |
|
Social connectivity |
Involvement in, and support of, activities and relationships outside the household. |
Source: Pezzullo et al. 2010.
While most children live in a house where some or all aspects of their family are positively functioning, not all children do. For some children, families may not be able to provide a safe and supportive environment and the children may experience abuse or neglect and may end up living in non-parental care.
There is no single overarching measure of family functioning and measurement is complex, given the concept is multi-dimensional.
This section provides a selection of national data which relate to 5 of the 6 domains of family functioning (Box 1).
Box 1: Measuring family functioning
Data from the LSAC and ACWP are used to provide insight into these domains of family functioning:
- emotional
- governance
- engagements
- cognitive development
- intra-familial relationships.
These domains are structured in 4 subsections:
- Relationships examines how well families get along by reporting how often children believe their family members yell at each other and parent rating of family’s ability to get along (LSAC).
- Family cohesion reports the amount of quality time children spend with their family, including talking, having fun or learning (ACWP).
- Parenting examines the emotional support children get from their parents by reporting the number of children who would talk to their mum and/or dad if they had a problem (LSAC). It also reports on the consistency of parenting (LSAC) and parental interest in school and homework (ACWP).
- Contributions to the household examines the governance structures in the family by reporting on the amount of time children spent doing housework or caring for other family members (ACWP) and parent perception of their contributions to housework and child-rearing tasks.
A selection of statistically significant comparisons between population groups has been included for each of these subsections.
Some data relevant to other family functioning domains are available in Health and Social networks.
Relationships
Conflict—or lack of conflict—is 1 measure of the quality of a family’s relationships and ability to get along. Conflict among members, especially between parents, has been associated with negative outcomes for children, including higher rates of aggression, anxiety, depression and physical health problems (Davies & Cummings 1994; Zubrick et al. 2008).
Conflict between family members can be exacerbated by factors including:
- stressful life events
- family member with poor health or disability
- money troubles
- conflicting priorities outside the house (Hartley et al. 2017; Schermerhorn et al. 2017).
What constitutes conflict can range in severity from a disagreement between members to family violence. One indicator of the degree of family conflict is the amount people yell at each.
It is estimated using data from LSAC in 2012 that 55% (or 134,000) of children aged 12–13 never or hardly ever had people in their family yell at each other—11% reported that yelling happened often/always. For families where the child was reported as needing or using more medical care, mental health or educational services than is usual for children the same age, 20% said people in their family often/always yelled at each other.
It is estimated using data from LSAC in 2016 that 90% (or 214,000) of primary parents (the child’s primary carer), to children aged 12–13, said their family’s ability to get along with one another was good, very good or excellent (Figure 1).
Figure 1: Rating of family’s ability to get along with one another, parents of children aged 12–13, 2016
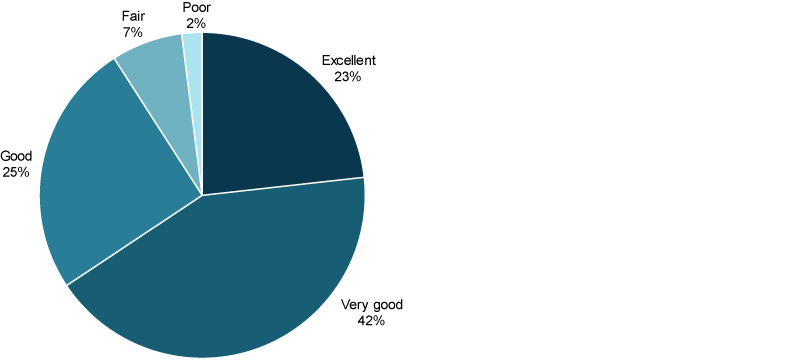
Chart: Australian Institute of Health and Welfare (AIHW). Source: AIHW analysis of the LSAC.
Family cohesion
Family cohesion refers to the quality time family members spend together that can lead to developing emotional bonds, boundaries, coalitions, shared interests and ability to make decisions together (Olson 1993; Redmond et al 2016).
Strong family cohesion is associated with increased ability to cope with difficult situations, while lack of family cohesion is associated with:
- decreased ability to cope with problems
- increased social withdrawal
- anxiety
- depression
- delinquency
- aggressive behaviour (Altiere & von Kluge 2009; Hosseinkhanzadeh 2013; Joh et al. 2013).
The 2014 ACWP found that most children (94%) in years 4, 6 and 8, spent quality time with their family most days in the week before the survey (this includes at least 1 of talking, having fun or learning with their family most days—Figure 2).
Figure 2: Proportion of children who spent time most days talking, having fun and learning together with their family, 2014
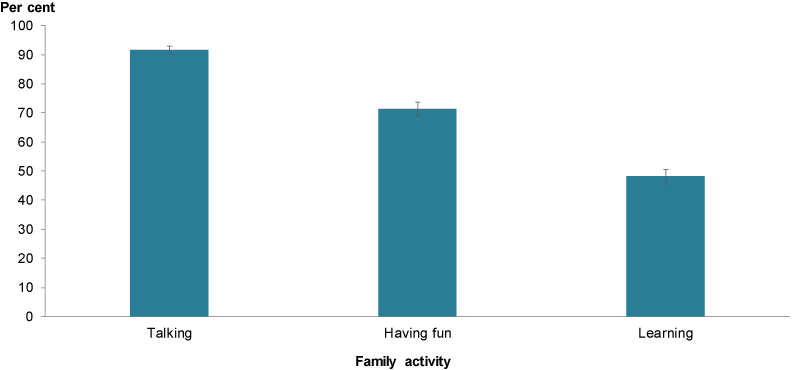
Note: Children responded separately to each category so totals do not add to 100%.
Chart: AIHW. Source: AIHW analysis of the ACWP.
Children with disability spend less time having fun with their families
The 2014 ACWP found that 71% of children spent time having fun together with their family most days in the week before the survey (Figure 3). Responses differed for children with disability compared with children without disability (59% compared with 73%).
Figure 3: Proportion of children who spent time having fun together with their family most days in the week before the survey, by disability, 2014
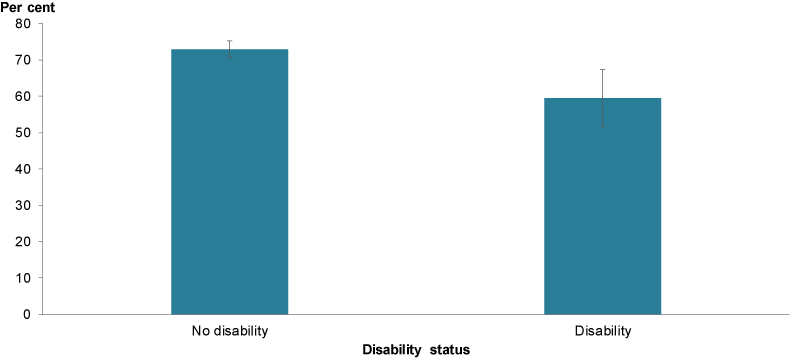
Chart: AIHW. Source: AIHW analysis of the ACWP.
1 in 2 children in years 4 and 6 spent time learning with their families most days
The 2014 ACWP found that about half (48%) of children spent time learning together with their family most days in the week before the survey (Figure 4). Older children were less likely to spend time learning together with their family—41% of Year 8 students reported spending time most days learning together with their family compared with 51% for Year 4 students and 52% for Year 6 students.
Figure 4: Proportion of children who spent time learning together with their family most days in the week before the survey, by school year, 2014
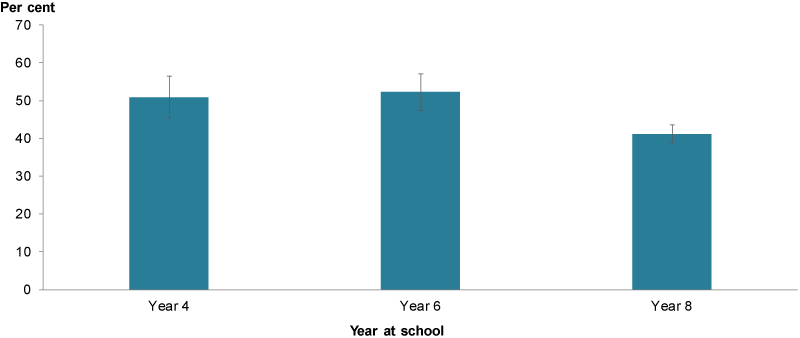
Chart: AIHW. Source: AIHW analysis of the ACWP.
Parenting
Parents play a key role in the overall functioning of a family. Parenting considered to be high quality and/or effective, tends to include elements of support (including presence of warmth and lack of hostility), consistency and interest in a child’s life (Zubrick et al. 2008).
High quality and/or effective parenting has been linked to a wide range of positive child outcomes, including improved physical and mental health, cognitive development and educational attainment. Poor parenting has been associated with substance misuse, unemployment and juvenile offending (Davidov & Grusec 2006; Davis-Kean 2005; Repetti et al. 2002).
The quality and effectiveness of parenting can be influenced by factors including parental health, parental education, culture and accessibility of resources, parenting and socioeconomic status are also positively related (Bornstein 2002; Davis-Kean 2005; Parenting Research Centre 2017; Zubrick et al. 2008).
Supporting parents to provide quality and effective parenting is considered important for improving the wellbeing of children and reducing social disadvantage (Department of Health 2019; Parenting Research Centre 2017; Parker & McDonald 2010). Looking at the concerns, needs and behaviours of parents, the Parenting Today in Victoria survey (Box 2) aims to understand parent experiences.
Box 2: Parenting Today in Victoria
The Parenting Today in Victoria survey was a 2016 state-wide survey. It was designed to explore the day-to-day experiences of today’s parents. It looked at their attitudes, behaviours and practices, concerns and help-seeking behaviour.
Some key findings include:
- 41% of parents wished they did not become impatient with their child so quickly
- 28% felt they were sometimes too critical of their children
- 29% wished they were more consistent in their parenting behaviour
- 76% talked to their child about problems/issues quite a lot or very much
- 95% of parents reported agreeing with their partner on how to parent all or most of the time
- 62% of parents said they argued with, or yelled at, their child about their behaviour or attitude a little—28% not at all; 10% quite a lot or very much
- 93% of parents agreed or strongly agree with the statement ‘I know I am doing a good job as a parent’
- 89% of parents agreed or strongly agreed with the statement ‘My parenting skills are effective’
- 91% of parents agreed or strongly agreed with the statement ‘I have confidence in myself as a parent’
- 96% of parents agreed or strongly agreed with the statement ‘I have all the skills necessary to be a good parent to my child’.
Most children rely on their parents for support when they have a problem
It is estimated using data from LSAC in 2016 that 88% (or 202,000) of children aged 12–13 would talk to their mum and/or dad if they had a problem (Figure 5).
Overall, children were more likely to talk to their mum than their dad (86% compared with 64%), with boys more likely to talk to their dad than girls (74% compared with 54%).
Figure 5: Proportion of children aged 12–13 who would talk to their parents if they had a problem, 2016
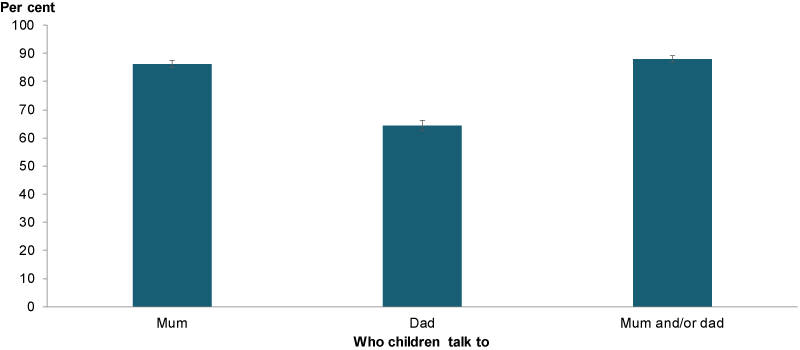
Note: Children may choose to speak to more than 1 person so totals do not add to 100%.
Chart: AIHW. Source: AIHW analysis of the LSAC.
Most parents are consistent in how they parent
It is estimated using data from LSAC in 2016 that, according to a consistent parenting scale 95%, or 221,000, primary parents to children aged 12–13 reported providing consistent parenting about half the time or more often (Box 3).
Box 3: Measuring consistent parenting
The LSAC consistent parenting scale is a series of 5 questions answered on a scale of 1 to 5. These questions ask both parents if they make sure their child does something when asked, and if they punish their child when they said they would. A score of 3 or higher indicates that parents provide consistent parenting about half the time or more often.
Children who attend schools in lower socioeconomic areas are less likely to have parents interested in homework
The 2014 ACWP found that most (85%) children said their parents asked them what they were learning in school weekly or more often. Similarly, 86% said their parents made sure they set time aside for their homework weekly or more often (Figure 6).
Children attending schools in the highest socioeconomic areas were more likely to say their parents made sure they set time aside for their homework weekly or more often compared with children attending schools in the lowest socioeconomic areas (89% compared with 81%, respectively). There were also differences between Indigenous and non-Indigenous children (70% compared with 87%, respectively).
Figure 6: Proportion of children who said their parents made sure they set time aside for their homework weekly or more often, by socioeconomic position of school, 2014
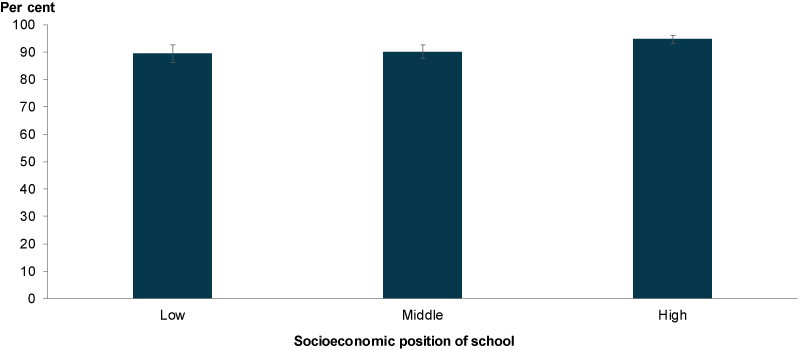
Chart: AIHW. Source: AIHW analysis of the ACWP.
More than half (56%) of students said their parents talk to their teachers at least once a term (Figure 7). This rate decreased with age, and Year 8 students (38%) were less likely to say their parents talk to their teacher once a term or more often than Year 4 and Year 6 students (68% and 61%, respectively).
Figure 7: Proportion of students who said their parents talk to their teachers at least once a term, by school year level, 2014
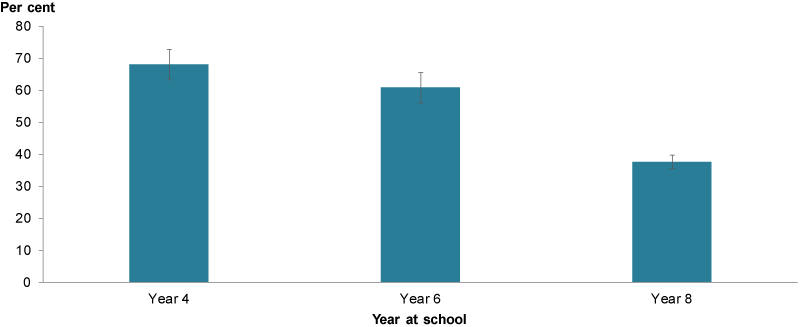
Chart: AIHW. Source: AIHW analysis of the ACWP.
Contributions to the household
Another aspect of families and how well they function is the perceived equity of member contributions to the household. The perception that the distribution of types of contributions—financial, household chores and child care—is fair to all members, has been associated with decreased tension and conflict, and increased cohesion (Cerrato & Cifre 2018; Newkirk et al 2017). What constitutes fair can differ dramatically depending on family factors including, but not limited to, agreed roles, age and capacity of individual members and Parental health and disability (AIFS 2015; Coltrane 2000; Putnick & Bornstein 2016)
Completing household chores, including looking after another family member, can serve as a way of teaching children important life skills, providing them with a sense of achievement and enabling them to earn rewards such as praise or pocket money—all contributors to positive wellbeing (Putnick & Bornstein 2016; The University of Minnesota 2014).
However, this is only in the case with age-appropriate chores and responsibilities (Putnick & Bornstein 2016).
4 out of 5 children help with housework at least weekly
The 2014 ACWP, which found a positive relationship between children who do housework and spend time caring for relatives and overall wellbeing, reported that almost 4 out of 5 (78%) students said they helped with housework weekly or more often (Redmond et al. 2016). Figure 8 shows, this rate increased with age, with Year 4 students (71%) less likely to say they helped with housework weekly or more often than year 6 and 8 students (81% and 82%, respectively).
The ACWP also found that 63% of children spent time taking care of their siblings or other family members at least once a week.
Figure 8: Proportion of children who spent time helping with housework weekly or more often, years 4, 6 and 8, 2014
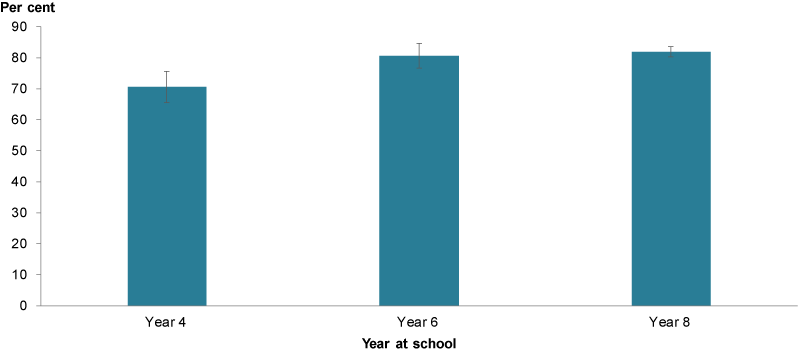
Chart: AIHW. Source: AIHW analysis of the ACWP.
Half of primary parents feel they do more than their fair share of domestic chores and child-rearing tasks
It is estimated using data from LSAC in 2016 that for 2-parent households, 45% of primary parents of children aged 12–13 said they did their fair share of domestic tasks (such as housework, home maintenance, shopping and cooking), and 51% said they did more than their fair share. This differed significantly from secondary parents in 2-parent households:
- 59% said they did their fair share of domestic tasks
- 14% did more than their fair share.
Similarly, 51% of primary parents in 2-parent households said they did their fair share of the child-rearing tasks (physical and emotional care), and 47% said they did more of their fair share, compared with 70% of secondary parents who said they did their fair share and 8.5% who said they did more.
In 39% of 2-parent households, both parents said they did their fair share of child-rearing tasks (Figure 9).
Figure 9: Share of tasks completed by parents of children aged 12–13, by parent, by type of tasks, 2016
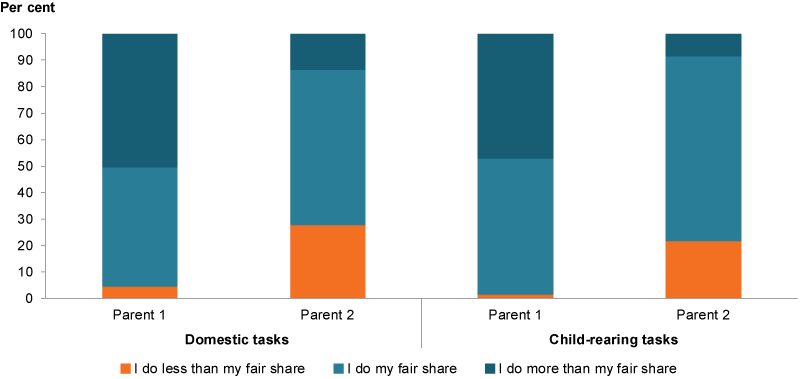
Note: Parent 1 is defined as the child’s primary carer (in most cases this is the child’s biological mother). Parent 2 is Parent 1’s partner or another adult in the home with a parental relationship to the study child (in most cases this is the biological father, but stepfathers are also common. 1-parent households are not included.
Chart: AIHW. Source: AIHW analysis of the LSAC.
Data limitations and development opportunities
Except for the National Framework for Protecting Australia’s Children indicator on family functioning, which uses LSAC data to report on families’ ability to get along, there are no nationally defined indicators for family functioning. Also, relevant information on family functioning in ongoing, national population surveys is limited.
For more information on family functioning, see: What’s missing? in Social Support.
Where do I find more information?
For more information on Family functioning, see: Family functioning indicator in the National Framework for Protecting Australia’s Children.