Injuries
Data updates
25/02/22 In the Data section, updated data related to injuries are presented in Data tables: Australia’s children 2022 - Health. The web report text was last updated in December 2019.
Key findings
- During 2015–2017, injuries contributed to 563 deaths of children aged 0–14 – a rate of 4.1 per 100,000 children.
- The most common causes of injury death were land transport accidents, accidental drowning and assault.
- In 2016–17, among children aged 0–14, there were around 66,500 were hospitalised injury cases – a rate of 1,445 per 100,000 children.
- Overall, boys were 1.5 times as likely to be hospitalised for injury than girls.
- Falls accounted for close to half (45.9% or around 30,500) of hospitalised injury cases and were the most common reason for injury hospitalisation of children across all age groups.
Injury is a leading cause of child deaths (see Infant and child deaths) and a major cause of hospitalisation (AIHW: Pointer 2014). Children are vulnerable to certain types of injuries depending on their age, reflecting their stage of development. Very young children are particularly vulnerable to injury as they are not yet able to adequately assess the risks involved in new activities and avoid potential dangers. Injuries sustained among older children are increasingly influenced by risk-taking behaviour in addition to their physical and social environment (AIHW: Pointer 2014).
Injury death and disability can be prevented by identifying and removing the causes or reducing children’s exposure to them. Recognising the impact of injury on children, a new National Injury Prevention Strategy is being developed to reduce the risk of injury for children (DoH 2018).
This section includes injury deaths and hospitalised injury cases.
Box 1: Data sources on injuries
This section draws on a range of data sources:
Deaths data are sourced from the AIHW National Mortality Database (NMD) and the Australian Bureau of Statistics (ABS) Causes of Death (Suicide data).
Road traffic accidents data are sourced from the Australian Road Deaths Database which includes basic details of road transport crash fatalities in Australia as reported each month to the state and territory road safety authorities. The database is published by the Bureau of Infrastructure, Transport and Regional Economics (BITRE). See the Technical notes for differences between BITRE data and the AIHW National Mortality Database.
Data on assault deaths are sourced from the Australian Institute of Criminology National Homicide Monitoring Program.
Data on hospitalised injury cases are sourced from the AIHW National Hospital Morbidity Database (NHMD).
How many children die from injuries?
During 2015–2017, injuries contributed to 563 deaths of children aged 0–14 – a rate of 4.1 per 100,000 children.
The rate of injury deaths for boys (4.9 per 100,000) was 1.5 times as high as that for girls (3.2 per 100,000) (Figure 1).
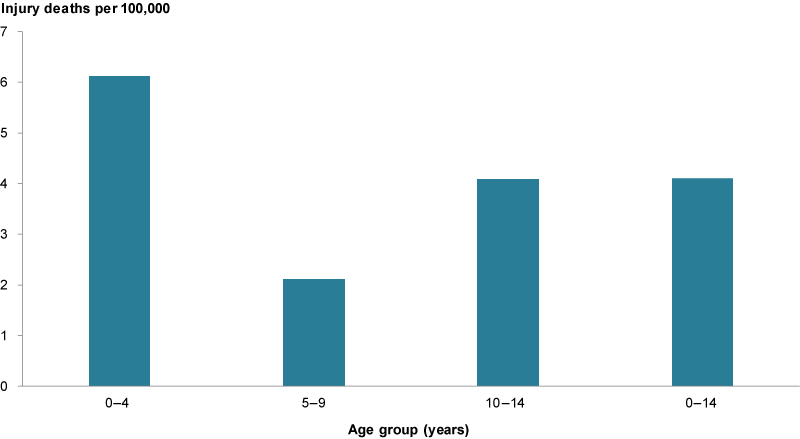
The youngest children (aged 0–4) had the highest rate of injury death (6.1 per 100,000 infants), compared with children aged 5–9 (2.1 per 100,000) and 10–14 (4.1 per 100,000).
Injury deaths comprised a substantial proportion of all deaths among those aged 1–14 (33%) (see Infant and child deaths).
Figure 1: Injury deaths among children aged 0–14, 2015–2017
Source: Analysis of AIHW National Mortality Database.
Have child injury deaths changed over time?
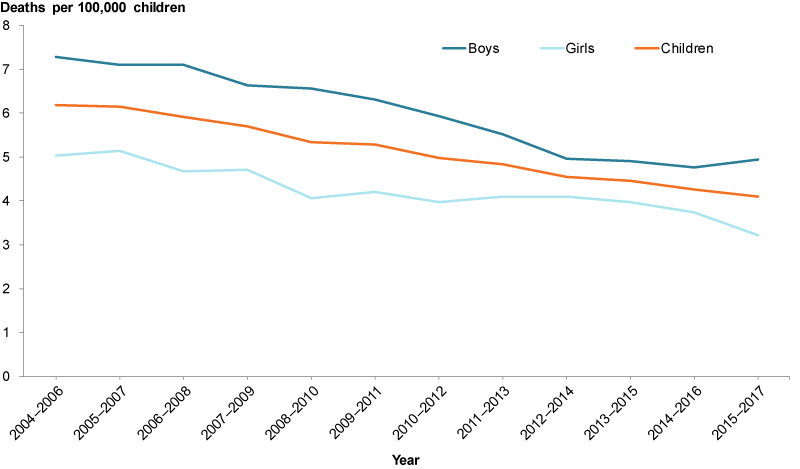
Injury death rates among children decreased between 2004–2006 and 2015–2017, from 6.2 to 4.1 deaths per 100,000 children. The rate for boys was consistently higher than for girls, fluctuating between 1.2 and 1.6 times as high (Figure 2).
Figure 2: Injury deaths among children aged 0–14, 2004–2006 to 2015–2017
Source: AIHW analysis of AIHW National Mortality Database; Children’s Headline Indicators 2018.
What are the leading injury causes of death?
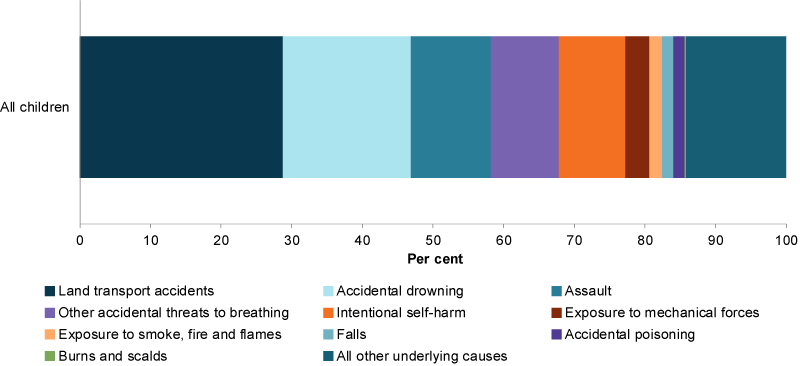
In 2015–2017, among children aged 0–14, the 3 leading causes of injury deaths among children were:
- land transport accidents (29%), which includes road traffic fatalities
- accidental drowning (18%)
- assault (11%) (Figure 3).
Figure 3: Leading causes of injury deaths among children aged 0–14, 2015–2017
Source: AIHW analysis of AIHW National Mortality Database.
How many children died on Australian roads?
According to the Australian Road Deaths Database, in 2018 among children aged 0–14:
- 34 deaths were due to road transport accidents, a rate of 0.7 per 100,000 children.
- Boys were slightly more likely to be killed in a road transport accident than girls – (rates of 0.8 and 0.6 per 100,000, respectively).
- Children aged 10–14 had the highest death rate (0.9 per 100,000), followed by children aged 0–4 (0.7). Children aged 5–9 had the lowest rate (0.6).
The death rate more than halved between 2009 and 2018 (1.7 per 100,000 to 0.7). The decline in road accident deaths is most noticeable among children aged 0–4, which has decreased by 68% since 2009 (2.2 to 0.7).
Of children who died because of a road transport accident:
- 59% were passengers
- 29% were pedestrians
- 5.9% pedal cyclists
- 5.9% were drivers or other.
Accidental drowning
During 2015–2017, 111 children aged 0–14 died because of accidental drowning – an average of 37 deaths a year (rate of 0.8 per 100,000 children). Boys made up 58.6% of accidental drowning deaths (65 compared with 46 girls).
During 2015–2017:
- infants and young children (aged 1–4) had the highest accidental drowning death rates (0.9 and 1.8 per 100,000 children, respectively).
- rates were lower among older children (0.5 for children aged 5–9 and 0.3 aged 10–14).
The death rate due to accidental drowning decreased by around 27% between 2008–2010 and 2015–2017 – from a rate of 1.1 per 100,000 deaths (139) to 0.8 (111).
Assault deaths (homicide)
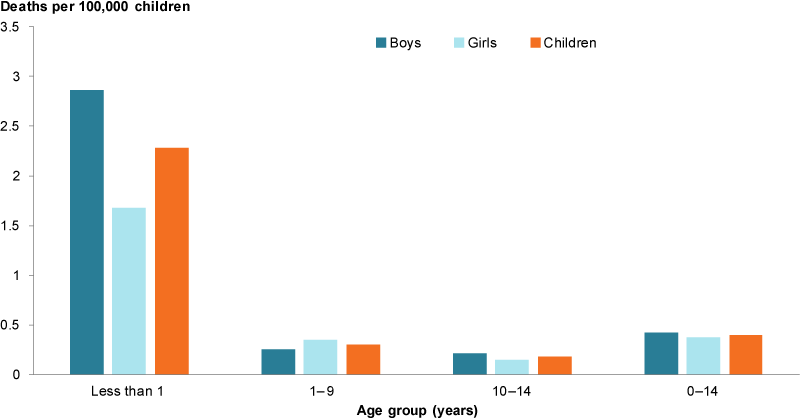
During 2012–14, there were 35 homicide deaths among children aged 0–14, a rate of 0.4 per 100,000 children (Figure 4).
Among infants under 1 year, the rate of homicide was almost 8 times as high (2.3 per 100,000 infants or 14 deaths) compared with children aged 1–9 (0.3 or 16 deaths) or aged 10–14 (0.2 or 5 deaths).
While there was a small difference in the overall rates of homicide among boys and girls (0.42 and 0.38 per 100,000, respectively, or 19 and 16 deaths, respectively), homicides were 1.7 times as likely to happen to infant boys as infant girls (2.9 and 1.7, respectively).
For more information on assault, see Children and crime.
Figure 4: Assault deaths (homicides) among children aged 0–14, 2012–14
Source: AIHW analysis of Bryant & Bricknell 2017.
The rate of deaths due to homicides among children aged 0–14 was slightly lower in 2012–2014 (0.4 per 100,000) compared with the 2 previous reporting periods (0.5 in 2008–2010 and 2010–12).
Suicide deaths
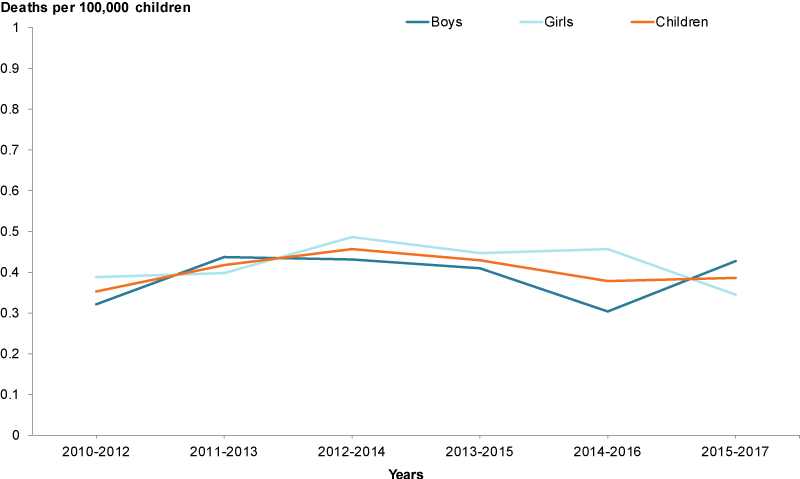
In 2015–2017, the suicide rate for children aged 0–14, was 0.4 per 100,000, with little difference between boys and girls (0.4 and 0.3, respectively) (Figure 5).
Between 2010–2012 and 2015–2017, the child suicide rate showed little change. It should be noted that deaths of children attributed to suicide can be influenced by reporting practices, and so care needs to be taken in interpreting results (Box 2).
Figure 5: Suicides among children aged 0–14, 2010–2012 to 2015–2017
Source: AIHW analysis of ABS Causes of death, Australia, 2017.
Box 2: Suicide deaths of children under the age of 15
Deaths of children by suicide are an extremely sensitive issue. The number of deaths can be influenced by coronial reporting practices. Reporting practices may lead to differences in counts across jurisdictions and this should be taken into account when interpreting these data. For more information on issues associated with the compilation and interpretation of suicide data, see ABS 3303.0—Causes of Death, Australia, 2011 explanatory notes 92–95.
For information on changes to coding guidelines from 2007 and their impact on suicide deaths, see ABS Causes of Death, Australia, 2014 (Cat. no. 3303.0) Explanatory Notes 85–92 and the Technical notes below.
How many hospitalised injury cases for children are there?
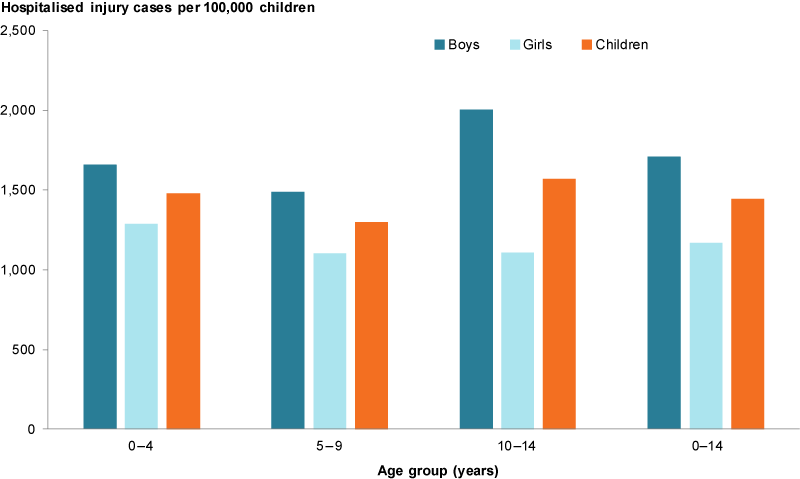
In 2016–17, among children aged 0–14 there were around 66,500 hospitalised injury cases – a rate of 1,445 per 100,000 children.
Overall, boys were 1.5 times as likely to be hospitalised for injury than girls (1,708 and 1,168 per 100,000, respectively), but this varied by age – from 1.3 times for those aged 0–4 and 5–9, to 1.8 times among those aged 10–14 (Figure 6).
Figure 6: Hospitalised injury cases among children aged 0–14, 2016–17
Source: AIHW NHMD.
Has the rate of hospitalised injury cases changed over time?
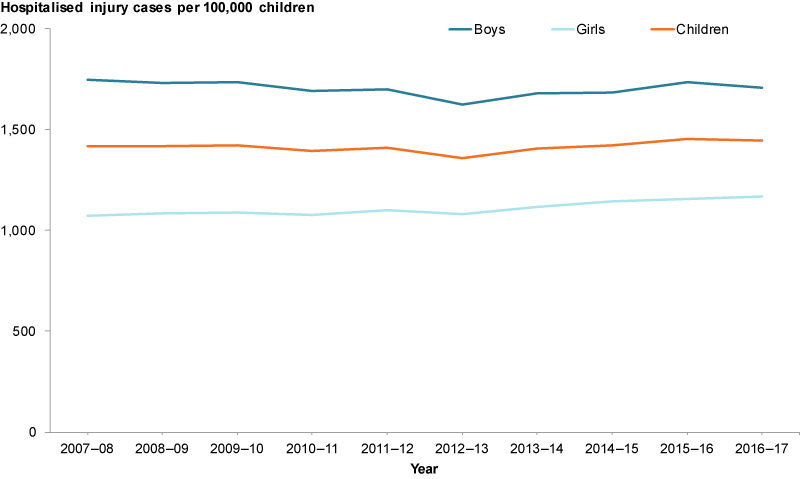
The number of hospitalised injury cases for children aged 0–14 in 2016–17 was slightly higher (66,500) than in 2007–08 (57,800). However, overall, the rate of hospitalised injury cases for children aged 0–14 was relatively stable between 2007–08 and 2016–17 (Figure 7). The rate for girls was 9% higher in 2016–17 compared with 2006–07 (1,168 and 1,071 per 100,000 respectively). However, boys consistently had higher rates than girls over the 10 years.
Figure 7: Hospitalised injury cases among children aged 0–14, by gender 2007–08 to 2016–17
Source: AIHW NHMD.
What are the leading injury causes of hospitalisations?
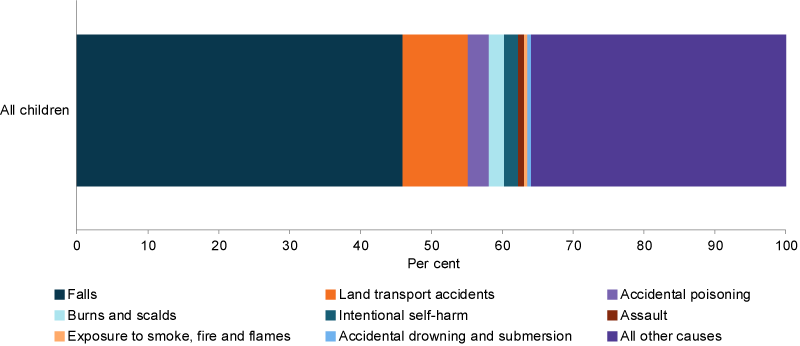
In 2016–17, among children aged 0–14, falls accounted for close to half (46% or around 30,600) of hospitalised injury cases and were the most common reason for injury hospitalisation of children across all age groups (Figure 8).
For subsequent leading causes of injury cases, there were differences across age groups. Land transport accidents (including both traffic and non-traffic) were the second leading cause of injuries for all children (9% or 6,100 cases) and for older age groups (5–9 year olds – 10% or 2,000 cases; 10–14 year olds – 15% or 3,400 cases) (AIHW analysis of NMHD).
Accidental poisoning was the third leading cause of injuries for all children (3% or 2,000 cases), but the second leading cause for children aged 1–4 years (7% or 1,500 cases) (AIHW analysis of NMHD).
In 2016–17, over half (53%) of accidental drowning and submersion injury cases in Australia occurred in children. The largest proportion was for children aged 0–4 (40%), with 13% occurring in children aged 5–14 (AIHW: Pointer SC 2019).
Figure 8: Hospitalised injury cases for children aged 0–14, by leading specific causes of injury, 2016–17 (per 100,000)
Source: AIHW NHMD.
Hospitalised assault cases
In 2016–17, among children aged 0–14 there were 612 hospitalised assault cases – a rate of 13.3 per 100,000 children.
Hospitalised assault cases were 1.6 times more common among boys than girls (16.2 and 10.3 per 100,000 children, respectively). Hospitalisation was also most common among older children aged 10–14 followed by infants (23.8 and 12.8, respectively). Almost half of hospitalised assault cases (48%) were from assault by bodily force.
In almost half (48.1%) of hospitalised assault cases (294 cases), the perpetrator was a parent, carer or other family member. The perpetrator was unspecified or ‘other’ in 30.4% of cases (186) and identified as an acquaintance or friend in 13.7% of cases (84). See Children exposed to family violence. For information on data quality relating to perpetrator identification, see Technical notes.
Between 2007–08 and 2012–13, the rate for hospitalised assault cases decreased by one-quarter (25.1%). Since 2012–13, the rate has ranged between 12.2 and 13.3 per 100,000). The rate for boys has fluctuated over time while the rate for girls has been more stable. However, the rate for boys has been consistently higher than that for girls.
Figure 9: Hospitalised assault cases for children aged 0–14, by gender, 2016–17
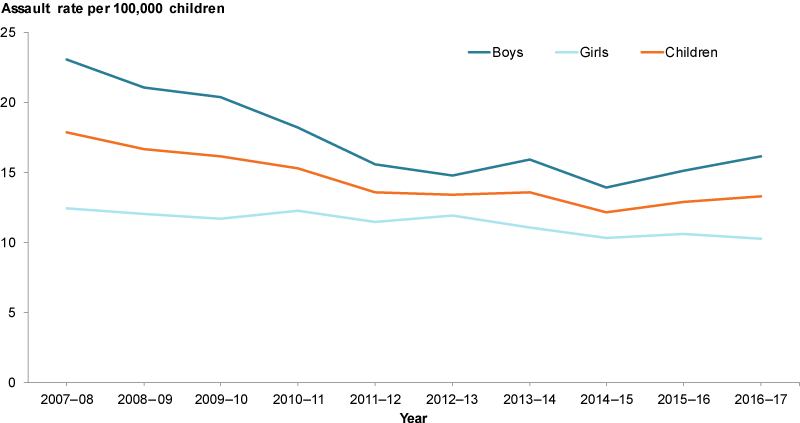
Source: AIHW NHMD.
Intentional self-harm cases
In 2016–17, among children aged 0–14, there were 1,300 hospital separations for intentional self-harm – a rate of 87 per 100,000 children. The vast majority of these cases (86.1%) were for girls (153.9 per 100,000; 23.6 for boys).
Between 2007–08 and 2012–13, cases of self-harm more than doubled, increasing from 32.6 per 100,000 to 77.3.
Following a small decrease in 2013–14 (to 68.7 per 100,000) the rate rose again to 87.0 2016–17. This increase was driven by an increase in the rate for girls.
Figure 10: Hospitalised cases of self-harm for children aged 0–14, 2016–17
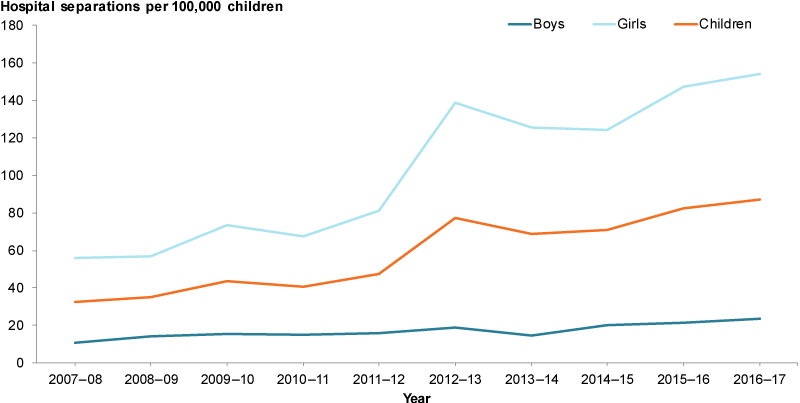
Source: AIHW NHMD.
Box 3: Self-harm, suicide and mental health
By definition, hospitalised cases of intentional self-harm can include cases where the intent is self-injurious or suicidal in nature. However, as hospital data only include cases where admitted hospital care was provided, the data do not capture the total number of children who have self-harmed.
The Second Australian Child and Adolescent Survey of Mental Health and Wellbeing (also known as Young Minds Matters) collected data on self-harm and suicidal behaviour directly from young people aged 12–17. Self-harm is defined as a child deliberately hurting or injuring themselves without trying to end their life. Suicidal behaviours refer to suicidal ideation (serious thoughts about taking one’s own life), making suicide plans and suicide attempts where the self-injury is intended to end in death.
Based on self-report, the survey found that in 2013–14 for those aged 12–15:
- 8.2% reported having ever self-harmed
- 3.8% reported self-harming 4 or more times
- 6.2% had self-harmed in the previous 12 months (Lawrence et al. 2015).
Over the same period and for the same age group:
- 5.6% had seriously considered attempting suicide (suicidal ideation) in the previous 12 months
- 1.7% had attempted suicide.
Girls aged 12–15 were more likely than boys to have self-harmed, had suicide ideation and to have attempted suicide (Lawrence et al. 2015).
Self-harm and suicide can be associated with mental health disorder. The highest rates of self-harm and suicidal behaviours among young people aged 12–17 were among those with major depressive orders, particularly for females. For information on the prevalence of mental health disorders, see Children with mental illness.
Survey participants who answered ‘prefer not to say’ to questions on self-harm or suicidal ideation were not asked subsequent questions. As such the proportion of young people who have ever self-harmed may be higher than indicated in these estimates (Lawrence et al. 2015).
Are injury rates the same for everyone?
Injury deaths
During 2013–2017, the injury death rate for children increased with remoteness. In Outer regional, remote and very remote areas the rate was 3 times as high as for Major cities (10 per 100,000 children compared with 2.9, respectively) (Figure 11).
The injury death rate for children living in the lowest socioeconomic areas was also higher than for those the highest (7.3 per 100,000 children compared with 2.1, respectively).
Differences were also evident between Indigenous and non-Indigenous children (15 per 100,000 children compared with 4.0, respectively). The Indigenous injury death rate remained relatively stable between 2006–2010 and 2013–2017. See also Indigenous Children.
Figure 11: Injury deaths for children aged 0–14, by priority groups 2016–17
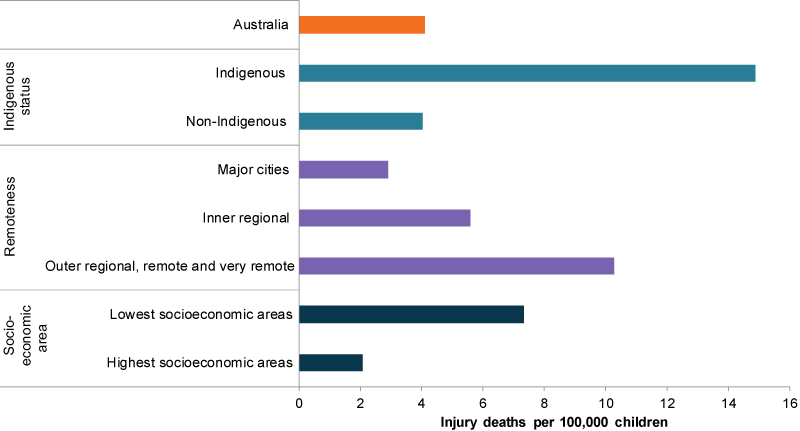
Source: Analysis of AIHW National Mortality Database.
During 2015–2017, land transport accidents (including road traffic fatalities) were the leading cause of injury deaths for Indigenous children aged 0–14 (31%) and non-Indigenous children (29%).
For Indigenous children, assault (18%) and accidental drowning (15%) were the second and third leading causes of death.
For non-Indigenous children, accidental drowning (20%) and accidental threats to breathing (11%) were the second and third leading causes of death.
Intentional self-harm was the fourth leading cause for both Indigenous and non-Indigenous children (Figure 12).
Figure 12: Leading causes of injury deaths among children aged 0–14, by Indigenous status, 2015–2017
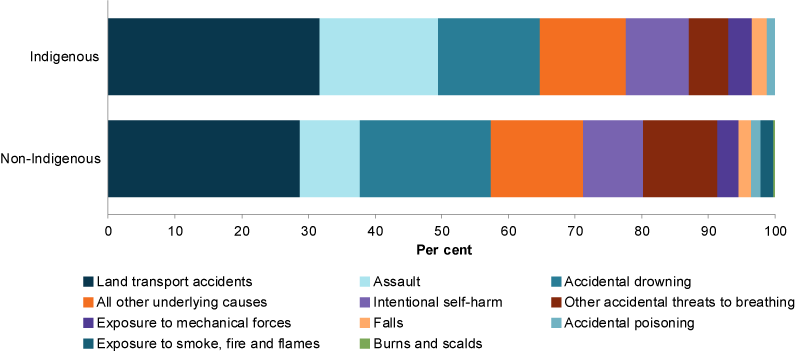
Note: Mortality data by Indigenous status are restricted to New South Wales, Queensland, Western Australia, South Australia and the Northern Territory due to data quality.
Source: Analysis of AIHW National Mortality Database.
Suicide data for Indigenous children aged 5–14 is not readily available. However, data for a broader age group (5–17 years) for 2013–2017 shows that the rate for Indigenous young people was considerably higher than that for non-Indigenous young people (10.1 and 2.0 per 100,000, respectively) (ABS 2018).
A recent inquest into the deaths of 13 children and young persons, including 5 children aged 10–13, in Western Australia’s Kimberley Region found that 12 of the 13 deaths were suicides and that the individual events were shaped by the effects of intergenerational trauma and poverty upon entire communities (Coroner’s Court of Western Australia 2019).
Hospitalised injury cases
In 2016–17, among children aged 0–14, the rate of hospitalised injury cases was:
- almost twice as high for children in Very remote areas as for Major cities (2,617 per 100,000 children compared with 1,342)
- 1.1 times as high for children living in the lowest socioeconomic areas as for those in the highest areas (1,525 and 1,365 per 100,000, respectively)
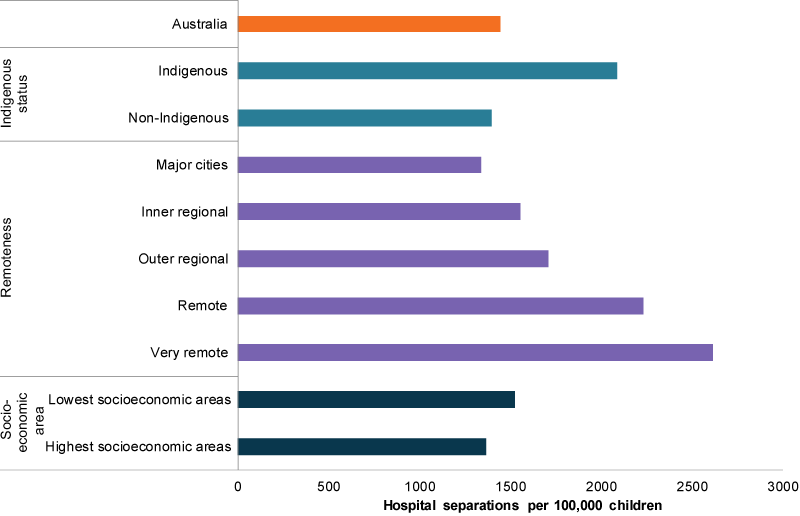
- higher among Indigenous and non-Indigenous children aged 0–14 (2,087 and 1,397 per 100,000 children, respectively (Figure 13)).
The rate of hospitalised cases for assault was:
- considerably higher in Remote and Very remote areas (87 and 50 per 100,000 children, respectively) than in Major cities (10)
- 4.6 times higher in the lowest socioeconomic areas than in the highest areas (23 and 5.0 per 100,000, respectively)
- considerably higher for Indigenous children than for non-Indigenous children (61.9 and 10.3 per 100,000, respectively). The difference was greater between Indigenous girls (62) and non-Indigenous girls (7.1) than between Indigenous boys (62) and non-Indigenous boys (13) (Analysis of AIHW NHMD).
The rate of self-harm hospitalised cases was:
- higher in Inner regional and Outer regional areas (113 and 116 per 100,000 children, respectively) than in Major cities (75.8).
- 1.6 times higher in the lowest socioeconomic areas than in the highest areas (34 compared with 22 per 100,000, respectively)
- higher among Indigenous children than non-Indigenous children (220 compared with 79 per 100,000 children). It was also higher for Indigenous girls than for Indigenous boys (398 compared with 49 per 100,000) (Analysis of AIHW NHMD). For information on the quality of Indigenous status data, see Technical notes below.
Figure 13: Hospitalised injury cases for children aged 10–14, by priority groups 2016–17
Source: AIHW NHMD.
Data limitations and development opportunities
Hospitalised cases of self-harm
In very young children, ascertaining if a hospitalised injury was due to intentional self-harm can be difficult and may involve a parent’s or caregiver’s perception of the intent. Ability to form an intention to inflict self-harm, and to understand the implications of doing so, requires a degree of maturation that is absent in infancy and early childhood (AIHW: Pointer 2014).
It is not possible to differentiate between acts of self-injury and self-harm with suicidal intent within the NHMD, but it is likely that an unknown proportion of cases of intentional self-harm presented here are self-injurious in nature rather than suicidal in intent.
Such sources of uncertainty about intent limit the certainty of estimates of intentional self-harm based on routine hospital data, particularly for children. For these reasons, this report presents cases of intentional self-harm in aggregate for ages up to and including 14.
The hospitalised injury data presented is likely an underestimate of total prevalence of self-harm. Presentations for self-harm to emergency departments or outpatients are not included, nor are data from other services, such as ambulance and general practitioners.
Data linkage work may help to better understand the relationship between self-harm and suicide. There is a possibility that a small number of self-harm cases could end in death and therefore ultimately be included in hospital and suicide (deaths) data. However, without data linkage, it is not clear what the overlap is. Linking deaths and hospital data could possibly reveal repeated self-harm attempts. Linked deaths data to Medicare Benefits Schedule and Pharmaceutical Benefits Scheme data could also reveal service use patterns before suicide.
The 2019–20 Australian Government Budget includes a new measure to provide $15 million over 3 years for a new national system for the improvement of data on self-harm and suicide to assist governments, communities, and mental health and suicide prevention bodies to better respond to incidences.
The AIHW will work with the National Mental Health Commission and the Department of Health to deliver a national view of the prevalence of suicide and self-harm.
Where do I find more information?
For information on:
- the rate of injury deaths for Indigenous children, see: Indigenous children
- child injury deaths breakdowns by states and territories, see: Injury deaths in Children’s Headline Indicators.
- child hospitalised injury for children, see: Hospitalised injury in children and young people 2011–12.
- whole-of-population injury deaths (including disaggregations for children aged 0–14), see: Trends in injury deaths, Australia, 1999–00 to 2014–15.
- whole-of-population hospitalised injury cases (including disaggregations for children aged 0–14), see: Trends in hospitalised injury, Australia 1999–00 to 2014–15.
- land transport crashes, see: Hospitalised injury due to land transport crashes
- eye injuries, see: Tovell A & McKenna K 2018. Eye injuries in Australia, 2010–11 to 2014–15.
- Hospitalised assault injuries among men and boys.
- injuries among Indigenous peoples, see: Indigenous child safety report and Hospitalised injury among Aboriginal and Torres Strait Islander people, 2011–12 to 2015–16.