Attendance at primary school
Data updates
25/02/22 – In the Data section, updated data related to attendance at primary school are presented in Data tables: Australia’s children 2022 - Education. The web report text was last updated in December 2019.
Key findings
- In 2018, the national attendance rate for Year 5 students was 93%, with little difference between boys and girls.
- Between 2014 and 2018, attendance rates for Year 5 students remained steady (93.7% compared with 93%).
Primary school is the first compulsory educational experience for Australian children. Attendance at school, especially primary school, gives children opportunities to develop the basic building blocks for learning and educational attainment, as well as social and emotional skills such as good communication, resilience and teamwork (Vic Department of Education and Training 2019). Attendance patterns have been found to be established early in school life, and disparities in attendance tend to be carried into, and become greater in, secondary school (Hancock et al. 2013).
Regular school attendance is critical to successful student outcomes, which has implications for further educational and future employment opportunities. Data has shown that more days of school absenteeism is associated with increased impact on academic performance (Goodsell et al. 2017). A study drawing on the Longitudinal Study of Australian Children (LSAC) found that higher levels of school non-attendance were associated with lower levels of numeracy, especially in early primary school years (Daraganova et al. 2014).
School attendance can be affected by underlying issues including:
- housing
- physical health
- mental health issues
- family violence
- intergenerational unemployment (Mission Australia 2016).
The mobility of young people—moving home or school several times in a short period—has also been found to be associated with missing school (Redmond et al. 2016). For students aged 10–11, risk factors associated with high levels of school absenteeism included:
- lower levels of school readiness on school entry
- higher levels of emotional or behavioural problems
- higher levels of school absenteeism in previous years (Daraganova et al. 2014).
Among Indigenous children, available evidence suggests that key drivers of school attendance include family socioeconomic status, school environment, child health, history of being bullied, and structural/community factors (AIHW 2018).
Closing the gap between Indigenous and non-Indigenous children’s school attendance for years 1–10 was a key priority of the Closing the Gap framework established by the Council of Australian Governments in 2018.
Attendance rates for Indigenous students did not improve between 2014 and 2018 and they remained below the rate for non-Indigenous students. However, the final assessment of the target will be considered when Semester 1, 2019 data are released as this is the agreed end point for the target. Targets for the Closing the Gap Refresh agenda are not yet finalised (PM&C 2019).
Box 1: Data sources for school attendance
School attendance data are sourced from the Australian Curriculum, Assessment and Reporting Authority (ACARA) Student Attendance Data Collection. National data has been collected annually for all compulsory school years (Foundation to Year 10) since 2014. ACARA developed the National Standards for Student Attendance Data Reporting (national standards) to standardise reporting across Australia for comparability purposes.
While data are available for all school years, the attendance rate of Year 5 students is the focus for this section, in line with indicator reporting Children’s Headline Indicators and literacy and numeracy indicators (see Literacy and Numeracy for an explanation of the choice of Year 5).
The nationally agreed student attendance measure is the number of actual full-time equivalent (FTE) student days attended as a percentage of the total number of possible student days attended over the period (ACARA 2019).
The FTE of a full-time student is 1.0. A full-time student is one who undertakes a workload equivalent to, or greater than, what is prescribed for a full-time student of that year level. This may vary between states and territories and from year to year. The prescribed minimum workload for a full-time student would ensure that a student could complete a given year level in a calendar year (ACARA 2019). FTE accounts for slightly different hours of school days and/or short (1–2 hour) absences of the child.
What is the school attendance rate for Year 5 students?
In 2018, the national attendance rate for Year 5 students was 93% with little difference between boys and girls (92.8% and 93.3%, respectively) (Figure 1). The national attendance rate across year levels also showed little difference:
- 93.2% for Year 3 students
- 93% for Year 5
- 92.7 for Year 7.
Figure 1: Student attendance rates for years 3, 5 and 7, by sex, 2018
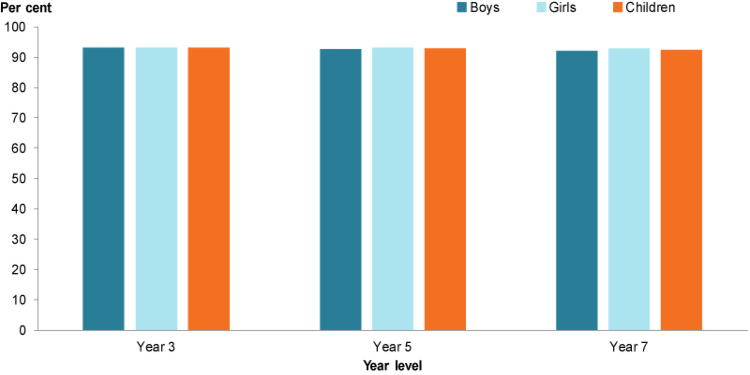
Chart: AIHW. Source: ACARA 2018.
Have attendance rates changed over time?
Between 2014 and 2018, the overall attendance rate for Year 5 students remained steady (93.7% in 2014 compared with 93% in 2018). Independent schools had a consistent pattern of having the highest attendance rates, followed by Catholic schools and government schools. (Figure 2).
Figure 2: Year 5 student attendance rates, by school sector, 2014–2018
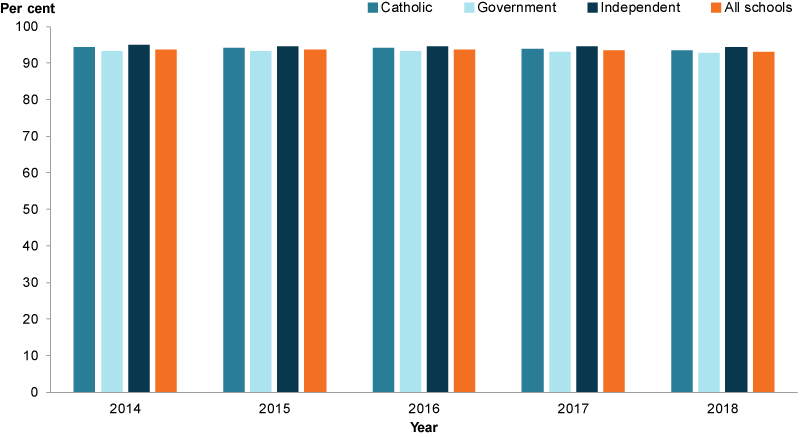
Chart: AIHW. Source: ACARA 2018.
Are attendance rates the same for everyone?
In 2018, Year 5 student attendance rates decreased as remoteness increased. It was considerably lower in Very remote areas (77%) than in Major cities (94%).
Differences were also evident between Indigenous and non-Indigenous Year 5 students (86% and 94%, respectively). Attendance rates for Indigenous students for this year level did not improve between 2014 (86.3%) and 2018 (85.7%).
Note: These categories are not mutually exclusive and it is likely that some of these influencing factors overlap. The data presented here does not show if poorer school attendance is restricted to particular schools.
Closing the Gap target for school attendance
Data for 2018 showed that the COAG target to close the gap between Indigenous and non-Indigenous school attendance for years 1–10 within 5 years (by 2018) was not on track as of Semester 1, 2018 (PM&C 2019).
The final assessment of the target will be considered when Semester 1, 2019 data are released as this is the closest data point to the end of 2018 and so is the agreed end point for the target (Productivity Commission 2019).
Figure 3: Year 5 student attendance rates, by priority populations, 2018
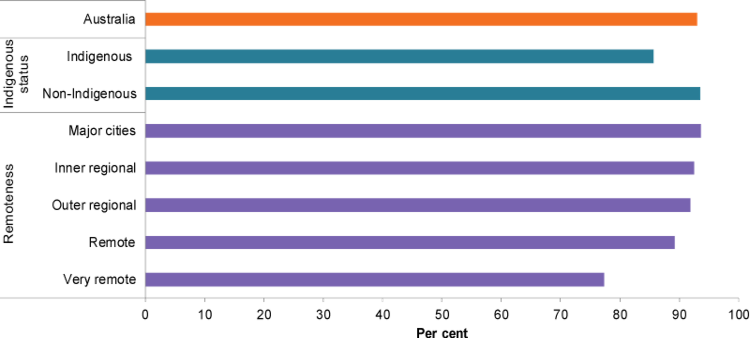
Chart: AIHW. Source: ACARA 2018.
Children with mental health disorders
The 2013–14 Second Australian Child and Adolescent Survey of Mental Health and Wellbeing (also known as the Young Minds Matter survey) includes data on school attendance for children with mental health disorders.
Analysis of the survey data found that in 2013–14:
- students in primary school (years 1–6) with a mental disorder were absent on average 3.6 days more than students without a mental disorder (11.8 days compared with 8.2 days)
- boys had a slightly higher average number of absent days than girls (12.3 days compared with 11.1 days) (Goodsell et al. 2017).
In primary school, major depressive disorders (18.1 days) and anxiety disorders (15 days) were associated with higher absence rates than conduct disorders (12 days) and Attention deficit hyperactivity disorder (ADHD) (10.5 days) (Goodsell et al. 2017).
Box 2: Students with special needs
Low socio-educational advantage
In 2017, 25% of all enrolled students across all years (Year 1 to Year 12) and school sectors had low socio-educational advantage (for more information, see Technical notes). The proportion was more than double in government schools compared with non-government schools (30% compared with 13%) (SCRGSP 2019).
Children with disability
In 2017, 19% (around 725,000) of all school students received an adjustment to participate in education because of disability. Independent schools had a higher proportion of students with disability (20%) than Catholic schools (17%) or government schools (19%) (SCRGSP 2019).
Disability types included:
- physical
- cognitive
- sensory
- social/emotional
The level of adjustment students were given to enable them to participate in education on the same basis as other students was:
- 1.5% with extensive disability
- 3% with substantial disability
- 8.2% with supplementary disability
- 6.2% required support within quality differentiated teaching practice (ACARA 2018).
Note: The definition of disability used here differs from that used in the ABS Survey of Disability, Ageing and Carers, which is used in Disability section in the Health domain.
Attendance data are not currently available for children from a low socio-educational advantage background nor for children with disability.
Data limitations and development opportunities
The standardising of nationally consistent data on school attendance has been an important data development over the past years. An area where national data are currently limited is for school expulsions and suspensions.
Where do I find more information?
For more information on:
- school attendance for Indigenous children, see: Indigenous children
- school attendance, see Attendance at primary school in Children’s Headline Indicators and ACARA school attendance website.