Homelessness
Data updates
25/02/22 – In the Data section, updated data related to homelessness are presented in Data tables: Australia’s children 2022 – Housing. The web report text was last updated in December 2019.
Key findings
- In 2016, around 19,400 children (0.4%) aged 0–14 were homeless on Census night.
- In 2017–18, almost half of children (45% or 29,600) receiving specialist homelessness services accessed these services for interpersonal reasons such as domestic and family violence or family breakdown.
While access to safe, stable and adequate housing is essential for children’s health and wellbeing, each night some Australian children experience homelessness. They may be spending the night:
- in supported accommodation for the homeless
- sleeping in temporary accommodation
- couch surfing
- sleeping on the street
- living in severely crowded dwellings (ABS 2018).
Some children under the age of 16 live in families experiencing homelessness, while others experience homelessness on their own (Cooper 2017).
Poverty is a key driver of homelessness for children and their families, while the experience of overcrowding and poor housing conditions are common pathways into homelessness (Buckner 2008; Embleton et al. 2016;). Family conflict and domestic and family violence are also key pathways into homelessness for children and their families, as many people fleeing violence do not have the resources or support networks to find suitable emergency housing (Embleton et al. 2016; Mission Australia 2019). Children experiencing homelessness are also at increased risk of being homeless as adolescents and adults (Flatau et al. 2012).
Children experiencing homelessness are an especially vulnerable population. Preschool and school-aged children experiencing homelessness are more likely to experience mental health problems than housed children, and some evidence suggests that homeless children are more likely to have physical disability, emotional or behavioural problems than housed children (Bassuk et al. 2015; Clair 2018). Food insecurity is also frequently reported by young people experiencing homelessness, putting them at increased risk of adverse health outcomes (Crawford et al. 2015).
Homelessness can be disruptive to children’s education. It is associated with decreased engagement in the classroom and, when coupled with frequent school moves, is associated with poor academic achievement (Fantuzzo et al. 2012). Continuity of schooling provides stability for children experiencing homelessness and can contribute to wellbeing later in life (Gibson et al. 2010).
Box 1: Data sources and definitions of homelessness
ABS Census of Population and Housing
Data on children experiencing homelessness come from the ABS Census of Population and Housing. The Census is collected by the ABS every 5 years with the most recent data available for 2016. The 2016 Census collected information on a range of welfare-related topics and estimates the number of people experiencing homelessness on Census night. The Census is completed by the householder, if present, or any adult member of the household, on behalf of any children in the household (ABS 2016).
The ABS also has strategies targeting rough sleepers, couch surfers and people living in supported accommodation to maximise the number of homeless people counted on Census night (ABS 2018).
According to the ABS, a person is considered to be experiencing homelessness if they are:
- living in an improvised dwelling, tent or sleeping out
- in supported accommodation for the homeless
- staying temporarily with another household, including couch surfing
- staying in a boarding house or other temporary lodging
- living in a severely overcrowded situation.
People living in severely overcrowded housing (those living in a residence requiring 4 or more additional bedrooms according to the Canadian National Occupancy Standard (see Overcrowding) are considered homeless because they do not have control of, or access to, space for social relations (ABS 2018). This definition of homelessness recognises that a home should be secure, stable and safe, with access to privacy for adults and children as well as space for sleep, study and play (CHP 2018).
Specialist Homelessness Services Collection
Data on children receiving assistance from specialist homelessness services comes from the Specialist Homelessness Services Collection (SHSC), which collects information about people who seek assistance from specialist homelessness services agencies. Data are collected on an ongoing basis and submitted to the AIHW monthly.
Specialist homelessness services (SHS) agencies provide assistance to people who are homeless or at risk of homelessness. A clients homeless status is based on their housing circumstances at the beginning of their first support period (AIHW 2019).
The SHSC considers people to be experiencing homelessness if they:
- have no shelter or are living in an improvised/inadequate dwelling
- are living in short term temporary accommodation
- are couch surfing or living with no tenure in a house, townhouse or flat.
People are considered at risk of homelessness if they are living in:
- public or community housing, either as a renter or rent free
- private or other housing, as a renter, rent free or owner
- institutional settings.
How many children are homeless?
According to the ABS Census, around 19,400 children (0.4%) aged 0–14 experienced homelessness on Census night in 2016. These children made up around 17% of the homeless population.
Rates of homelessness were the same for boys and girls (both 0.4%) and were similar between younger children aged 0–4 (0.5%) and older children aged 5–9 and 10–14 (both 0.4%).
The majority (62% or 12,000) of children experiencing homelessness were living in severely overcrowded dwellings, and one-quarter (25% or 4,900) were living in supported accommodation for the homeless.
Around 8.1% (1,600) were staying temporarily with other households and another 2.9% (around 560) of homeless children were ‘sleeping rough’ (living in improvised dwellings, tents or sleeping out).
Have rates of homelessness improved over time?
While the number of children aged 0–14 living in homeless situations increased slightly from 19,100 in 2006 to 19,400 in 2016, the proportion of children living in homeless situations remained relatively stable between 2006 (0.5%) and 2016 (0.4%).
Are rates of homelessness the same for everyone?
Rates of homelessness among children aged 0–14 years vary across different types of households. In 2016, children living in multiple family households were 4 times as likely to be homeless as children in 1-parent family households (2.4% or 11,700 compared with 0.6% or 4,000, respectively) and 24 times as likely as those in couple family households (0.1% or 3,600).
Rates of homelessness were highest among children living in Remote and very remote areas (5.2% or 5,400) compared with Major cities (0.3% or 10,200), Inner regional (0.3% or 2,100) and Outer regional (0.4% or 1,600) areas. Higher rates of homelessness in Remote and very remote areas is due to higher rates of overcrowding in these areas (see Overcrowding). Children living in areas of greater socioeconomic disadvantage were also more likely homeless (1.3% or 11,100) than those living in areas of least disadvantage (0.1% or 710) (Figure 1).
Differences were also evident between Aboriginal and Torres Strait Islander children and non-Indigenous children (3.3% or 7,200 and 0.3% or 10,900, respectively). However, the proportion of Indigenous children living in homeless situations has shown a positive change between 2006 and 2016, decreasing by 2 percentage points from 5.3% to 3.3%. Most Indigenous children who were homeless (80%) were living in severely overcrowded household.
Figure 1: Proportion of children aged 0–14 who are homeless, by priority population group, 2016
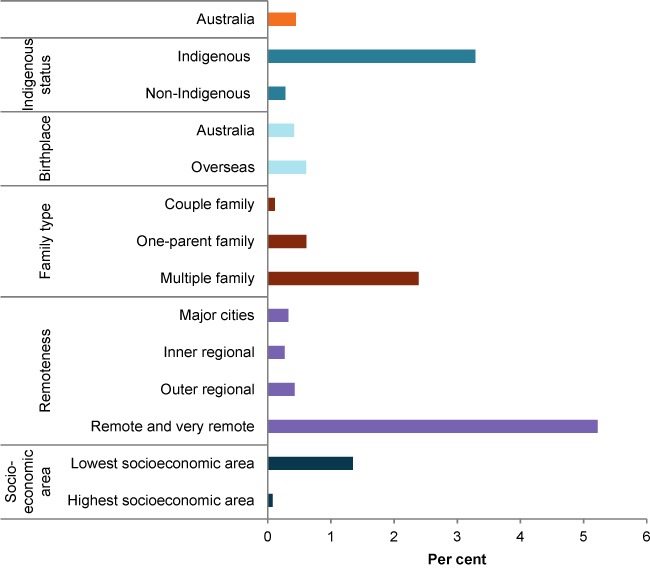
Chart: AIHW. Source: ABS 2018.
Specialist homelessness services
In 2017–18, nearly 65,600 children (14.1 per 1,000 children aged 0–14) received assistance through homelessness services. Children made up nearly one-quarter (23%) of people receiving assistance from specialist homelessness services. Of these:
- More than one-third (35% or 23,000) were recorded as homeless at the time they received SHS, and nearly half (48% or 31,500) were at risk of homelessness. The remaining 17% (10,800) had no living situation recorded.
- The majority (90% or 58,900) presented to homelessness services as part of a ‘related group’ (family), 9.4% (6,200) presented alone, and 0.9% (560) presented as part of an ‘other group’.
- The majority of children (45% or 29,600) who received homelessness services did so for interpersonal reasons as their main reason, including domestic and family violence and family breakdown. Another 29% (19,000) received services due to issues with accommodation, such as housing crisis or inadequate or inappropriate dwelling conditions, 11% (7,000) for financial reasons, 1% (540) for health reasons and 13% (8,700) for other reasons.
Rates of homelessness service use were similar between boys and girls (13.9 and 14.2 per 1,000 boys and girls, respectively).
Do rates of service use vary across populations?
Indigenous children aged 0–14 were more likely to receive assistance through homelessness services than non-Indigenous children (71 per 1,000 Indigenous children compared with 9.0 per 1,000 non-Indigenous children).
Children born in Australia were twice as likely as those born overseas to receive assistance through specialist homelessness services (12.6 per 1,000 children compared with 6.1, respectively).
While children in Major cities made up the majority of all children accessing homelessness service (52%), children living in Very remote areas were more than 5 times as likely to receive assistance as those in Major cities (10.4 children per 1,000, compared with 52.6, respectively) (Figure 2).
Figure 2: Children aged 0–14 who received assistance through specialist homelessness services, by priority population group, 2017–18
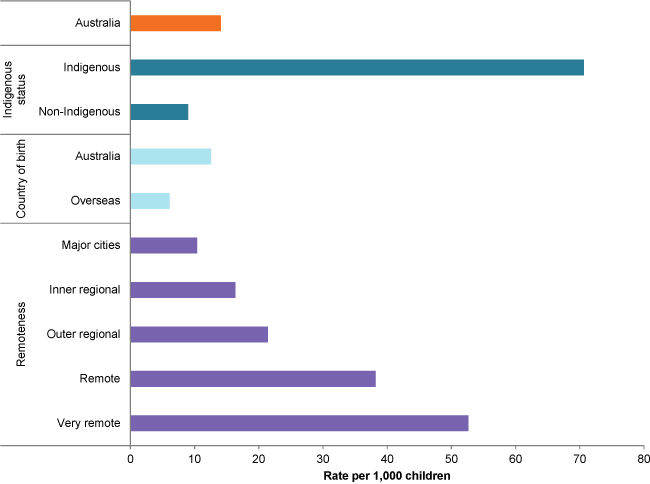
Note: ‘Indigenous status’ excludes 6,900 children whose Indigenous status was recorded as ‘Not stated’.
Chart: AIHW. Source: AIHW Specialist Homelessness Services Collection.
Data limitations and development opportunities
Current national data sources are likely to underestimate the number of children who are homeless as they rely on self-reporting through the ABS Census and/or the use of specialist homelessness services.
Where do I go for more information?
For more information about:
- Indigenous children and homelessness, see: Indigenous children.
- homelessness by states and territories, see: Children’s Headline Indicators and Homelessness and homelessness services.
- young people in the youth justice and child protection systems who have experienced homelessness, see: Vulnerable young people: interactions across homelessness, youth justice and child protection.
- persons seeking assistance from specialist homelessness services, see: Specialist homelessness services annual report 2017–18.