Social and emotional wellbeing
Key findings
- In 2013–14, 1 in 10 children scored in the ‘of concern’ range of the Strengths and Difficulties Questionnaire (SDQ) total difficulties score.
- The proportion of children who scored in the range ‘of concern’ increased with age, from 7.3% for those aged 4–6 to 11.7% for those aged 7–9 and 12% for those aged 10–12.
- Boys were more likely to score in the range ‘of concern’ than girls (12.7% and 7.7%, respectively) (Figure 1).
Good mental health and wellbeing is important to enable children to thrive across the early years and into adolescence and young adulthood. Investing in prevention and early intervention gives children the best opportunity for achieving this (NMHC 2019).
Children’s social and emotional wellbeing (SEWB) is a key component of mental health and wellbeing. It is a complex construct that is sometimes referred to as social and emotional competence, development, learning or literacy.
The emphasis is on behavioural and emotional strengths and ability to adapt and deal with daily challenges (resilience and coping skills) and respond positively to adversity while leading a fulfilling life (AIHW 2012).
An ecological conceptualisation of SEWB recognises that while children’s individual internal characteristics contribute to their social and emotional wellbeing, relationships and interactions with their family, school and community environments have a significant influence (AIHW 2012). A meta-analysis of school-based interventions found that social and emotional skills can be taught at school, and have a positive impact on attitudes, behaviours and academic outcomes (Durlak et al. 2011).
Socially and emotionally competent children:
- are confident
- have good relationships
- communicate well
- do better at school
- take on and persist with challenging tasks
- develop the necessary relationships to succeed in life.
Strong social and emotional competence may also provide resilience against stressors (AIHW 2012).
Cultural background is an important consideration in measurement due to differences in social norms and values between cultural groups (Hamilton & Redmond 2010). For Indigenous children, for example, key elements of SEWB include:
- family and community wellbeing
- connection to ancestry, culture, spirituality and country (Marmor & Harley 2018).
Measuring social and emotional wellbeing
Theories of SEWB development are diverse, and there is little agreement on how best to measure it (Bernard and Stephanou 2017). Positive constructs that measure how well children are thriving in terms of SEWB include the construct of mental health competence, which measures healthy psychosocial functioning (Goldfeld et al. 2014).
How children view their own wellbeing (subjective or self-reported wellbeing), is also important for measuring SEWB. Survey instruments giving children a voice include the South Australian Wellbeing and Engagement collection which measures SEWB for:
- happiness
- optimism
- satisfaction with life
- perseverance
- emotion regulation
- sadness
- worries (SA Department for Education 2018).
Other SEWB instruments include:
- ACER SEW Survey, which includes the domains of feelings and behaviour, internal strengths and values, and external strengths
- Rumble’s Quest, an interactive game allowing primary school children (aged 6–12) to report on their own wellbeing (See Alternate measures for social and emotional wellbeing)
- Behind the News (BtN) which runs 2 large scale Kids’ Happiness surveys for children aged 6–18 and includes data on how often children felt happy, worried and safe (Box 2: How do Australian children rate their own wellbeing? in Introduction).
Currently, these instruments are not being used to collect nationally representative population-level data.
For national reporting in the Children’s Headline Indicators, SEWB is measured as the proportion of children (4–12 years) who scored in the ‘of concern’ range (also referred to as ‘abnormal’) using the SDQ (Box 1).
Box 1: National data on the Strengths and Difficulties Questionnaire
Data reported on the SDQ in this section is sourced from the Second Australian Child and Adolescent Survey of Mental Health and Wellbeing (2015), also known as the Young Minds Matter survey.
This household survey was conducted in 2013–2014 by the Telethon Kids Institute at the University of Western Australia in partnership with Roy Morgan Research. The survey collected information about the mental health and wellbeing of children and adolescents in Australia, and the extent to which they use health and education services to get help with problems.
The SDQ was originally designed as a screening tool for behavioural problems and mental illness. It incorporates positive and negative attributes through its 5 scales, each of which are relevant to conceptualising SEWB:
- emotional symptoms
- conduct problems
- peer problems
- hyperactivity
- pro-social (AIHW 2012).
While the SDQ has a bias in terms of negative constructs, it has been used extensively as an indicator of SEWB (Hamilton & Redmond 2010). For the purposes of reporting in the Children’s Headline Indicators, it was found to have a sufficiently strong conceptual basis for SEWB, as it assesses individual internal and relational aspects (AIHW 2012).
How many children scored ‘of concern’ on the SDQ?
In 2013–14, 1 in 10 children reported on in the Young Minds Matter survey scored in the ‘of concern’ range of the SDQ total difficulties score. The proportion who scored in the ‘of concern’ range increased with age.
While 7.3% of 4–6 year olds were classified as ‘abnormal’ this increased to 12% of 7–9 year olds and 12% of 10–12 year olds.
Boys (13%) were more likely to score in the range ‘of concern’ than girls (7.7%) (Figure 1).
Figure 1: Children’s scores on the SDQ, by age, gender, 2013–2014
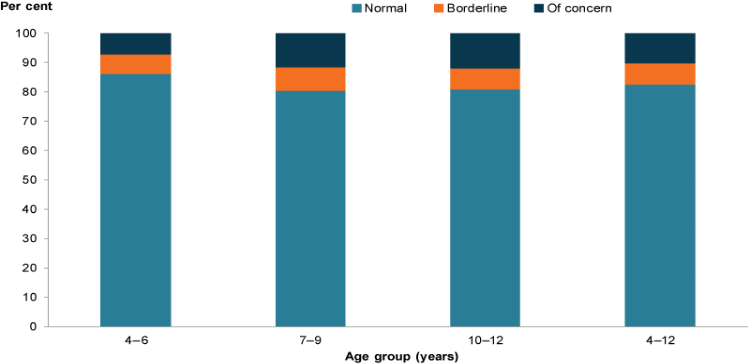
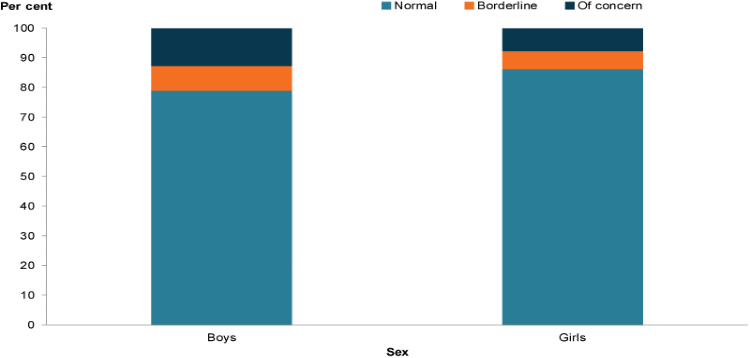
Chart: AIHW. Source: Second Australian Child and Adolescent Survey of Mental Health and Wellbeing 2015.
Is social and emotional wellbeing the same for everyone?
In 2013–14, children living in original 2-parent or 2-carer families were less likely to score ‘of concern’ (8.6%) compared with blended (18%) and 1-parent families (18%). Overseas-born children were also less like to score ‘of concern’ (6.2%) compared to Australian-born children (11%).
Living in the lowest socioeconomic areas was strongly associated with a score ‘of concern’ and double the rate of that for children living in the highest socioeconomic areas (16% and 7.2%, respectively) (Figure 2).
Reliable data are not available on Indigenous children in the Second Australian Child and Adolescent Survey of Mental Health and Wellbeing. The 2000–2002 Western Australian Aboriginal Child Health Survey found that among children aged 4–17, Indigenous children were 1.6 times as likely than non-Indigenous children to be at risk of social and emotional difficulties based on the SDQ (24% and 15%, respectively) (De Maio et al. 2005).
A comparison of Indigenous and non-Indigenous children aged 6–7 (based on the Longitudinal Survey of Indigenous Children (LSIC), and the Longitudinal Survey of Australian Children (LSAC), respectively) found that Indigenous children tended to have greater levels of social and emotional difficulties using the SDQ (DSS 2015). However, using the SDQ showed that on average Indigenous children in LSIC had higher prosocial scores (a strengths-based measure which includes being considerate, sharing and being helpful and kind) than non-Indigenous children (DSS 2015).
Figure 2: Children scoring ‘of concern’ on the SDQ by selected population groups, 2013–2014

Note: Step family have at least 1 resident stepchild, but no child who is the natural or adopted child of both partners. Blended families have 2 or more children with at least 1 the natural or adopted child of both parents, and at least 1 the stepchild of 1 of them.
Chart: AIHW. Source: Second Australian Child and Adolescent Survey of Mental Health and Wellbeing 2015.
Alternate measures for social and emotional wellbeing
Since the SEWB indicator for the Children’s Headline Indicators was developed, there has been growing interest in positive measures of social and emotional wellbeing. Several alternatives have emerged and could potentially inform future national information development and reporting in this area.