Alcohol
Alcohol
is an Australia's health
topic
Key findings
View the Alcohol in australia fact sheet >
Australian Guidelines to Reduce Health Risks from Drinking Alcohol
In December 2020, the National Health and Medical Research Council (NHMRC) released revised Australian guidelines to reduce health risks from drinking alcohol. Data on alcohol consumption from the 2022–2023 National Drug Strategy Household Survey (NDSHS) were analysed according to these revised guidelines. All results in this report from 2001 to 2022–2023 have been calculated against the revised guidelines.
The consumption of alcohol is widespread within Australia and associated with many social and cultural activities. Provided compliance with certain conditions, consuming and selling alcohol is legal in Australia and it is widely accepted. When consumed, alcohol produces a number of central nervous system depressant effects.
Alcohol concentration varies considerably with the type of drink. In Australia, beer contains 0.9–6% alcohol, wine contains 12–14%, fortified wines such as sherry and port contain around 18–20%, and spirits such as scotch, rum, bourbon and vodka contain 40–50% (NSW Ministry of Health 2017).
Availability
For related content on alcohol availability by region, see also:
Data about the volume of alcohol available for consumption in Australia are collated by the Australian Institute of Health and Welfare using data on import clearance, excise and domestic alcohol sales (AIHW 2023c). There were 208.8 million litres of pure alcohol available for consumption in Australia in 2019–20, a slight decrease from 210.3 million litres in 2018–19 (Figure ALCOHOL1). This represents around 10 litres per capita, which has remained stable over the past decade (per capita consumption refers to the Australian population aged 15 and over).
In 2019–20, wine accounted for the largest proportion of apparent alcohol consumption (42% of all available alcohol), followed by beer (35%) and spirits (21%) (AIHW 2023c). Trends in apparent alcohol consumption vary by beverage type:
- Wine consumption decreased from 90.4 to 87.0 million litres of pure alcohol between 2018–19 and 2019–20 (or 4.4 to 4.2 litres per capita). This represents the first decline since 2012–13, following an overall rise since the 1960s.
- Beer consumption has steadily fallen since peak in the 1970s, declining from 92.2 to 72.4 million litres of pure alcohol between 1974–75 and 2019–20 (or 9.2 to 3.5 litres per capita).
- Apparent consumption of spirits has fluctuated over time, rising from 35.4 to 44.2 million litres of pure alcohol between 2016–17 and 2019–20 (or 1.8 to 2.1 litres of pure alcohol). This is the highest level since 2007–08 (38.8 million litres, or 2.3 litres per capita).
- Apparent consumption of spirits has fluctuated over time, rising from 35.4 to 44.2 million litres of pure alcohol between 2016–17 and 2019–20 (or 1.8 to 2.1 litres of per capita). This is the highest level since 2007–08 (38.8 million litres, or 2.3 litres per capita (Figure ALCOHOL1)
In terms of Australian household spending on alcohol, on average households spent $32 on alcoholic beverages per week and this has remained stable between 2009–10 and 2015–16 (ABS 2017, Table 1.1).
Figure ALCOHOL1: Apparent consumption of alcohol by beverage type, 1944–45 to 2019–20 (litres per capita or total volume)
This figure shows a decrease in the per capita consumption of pure alcohol in litres from 1968 to 2018. In 2018, there were 9.51 litres of pure alcohol available for consumption per person aged 15 years and over, a trend that has remained stable since 2017 (9.48 litres) and a decrease from 10.78 litres in 1968. The per capita consumption of wine and spirits/ready to drinks consumed in litres has increased from 1968 to 2018, while the per capita consumption of beer has decreased.

View data tables >
Consumption
For related content on alcohol consumption by region, see also:
The majority of Australians aged 14 and older have consumed alcohol in their lifetime. The 2022–2023 National Drug Strategy Household Survey (NDSHS) found that of the population aged 14 and over:
- Over two-thirds (69%) had consumed alcohol in the previous 12 months (AIHW 2024b, Table 4.6).
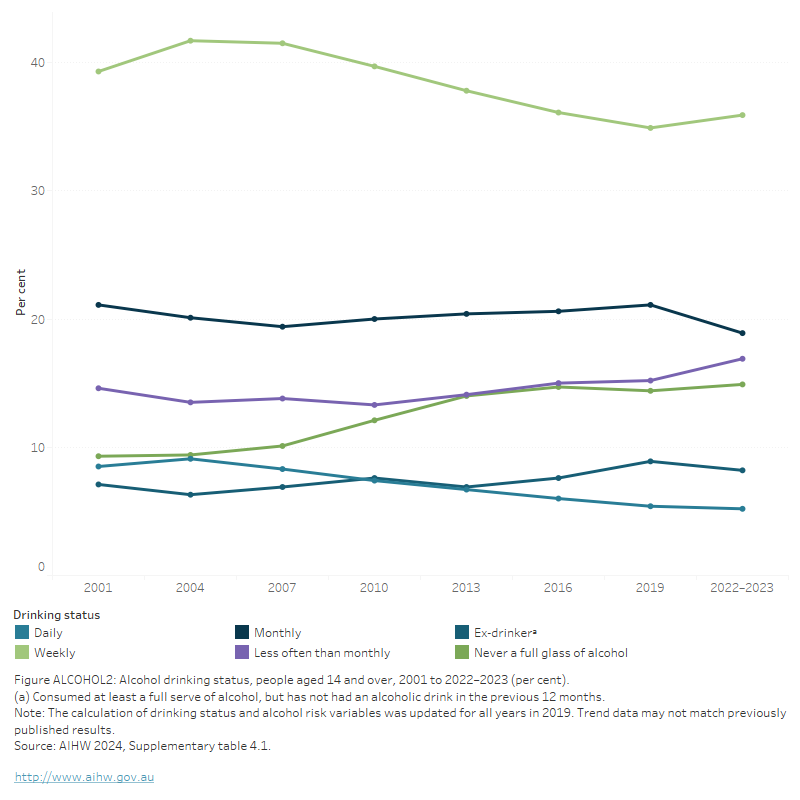
- 14.9% had never consumed a full serve of alcohol (AIHW 2024b, Table 4.1; Figure ALCOHOL2)
- The proportion who consumed alcohol daily remained stable between 2019 (5.4%) and 2022–2023 (5.2%) (AIHW 2024b, Table 4.1).
Figure ALCOHOL2: Alcohol drinking status, people aged 14 and over, 2001 to 2022–2023 (per cent)
This line graph shows a steady decline in the proportion of people aged 14 and over who drink weekly or daily between 2001 and 2022–2023, with a slight uptick of weekly drinking between 2019 and 2022–2023. Over the same period, there was a moderate rise in the proportion of people who never drink, and a slight rise in the proportion of people who drink less than monthly. The proportion of people are ex-drinkers remained relatively stable between 2001 and 2022–2023. Weekly drinking was consistently the category that contained the highest proportion of people.
Risky drinking
Many drinkers consume alcohol responsibly; however, some drinkers consume alcohol at a level that exceeds NHMRC recommendations, and in doing so, increase their risk of alcohol-related harm (see Box ALCOHOL1).
Box ALCOHOL1: Summary of the Australian guidelines to reduce health risks from drinking alcohol
The National Health and Medical Research Council (NHMRC) released new Australian guidelines to reduce health risks from drinking alcohol in December 2020.
The 2020 Guidelines state:
- Guideline 1: To reduce the risk of harm from alcohol-related disease or injury, healthy men and women should drink no more than 10 standard drinks a week and no more than 4 standard drinks on any one day.
- Guideline 2: To reduce the risk of injury and other harms to health, children and people under 18 years of age should not drink alcohol.
- Guideline 3:
- To prevent harm from alcohol to their unborn child, women who are pregnant or planning a pregnancy should not drink alcohol.
- For women who are breastfeeding, not drinking alcohol is safest for their baby (NHMRC 2020).
What is risky alcohol consumption?
In the 2022–2023 NDSHS, “drinking at risky levels” or “risky drinking” is defined according to the Australian guidelines to reduce health risks from drinking alcohol (NHMRC 2020).
Guideline 1 advises that “To reduce the risk of harm from alcohol-related disease or injury, healthy men and women should drink no more than 10 standard drinks a week and no more than 4 standard drinks on any one day”. As a result, a person doing either or both of the following will be classified as having consumed alcohol in ways that increased their risk of harm:
(i) Having more than 10 standard drinks per week on average in the previous 12 months.
(ii) Having more than 4 standard drinks in a single day at least once a month over the previous 12 months.
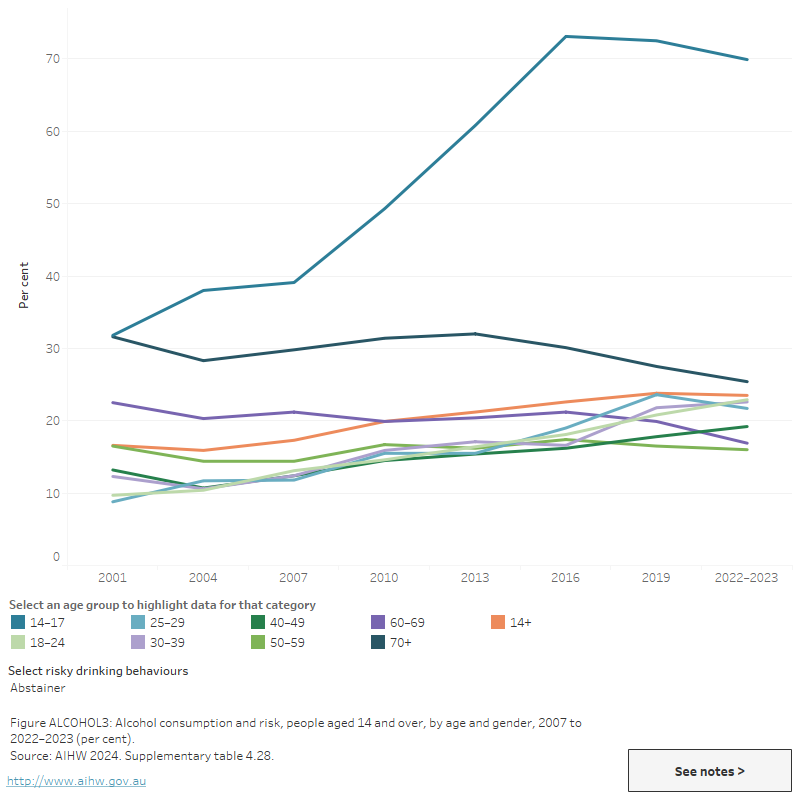
The NDSHS found around 1 in 3 people (31% or 6.6 million people) aged 14 and over consumed alcohol at risky levels in 2022–2023. This is a similar level to 2019, when 32% of the population (around 6.7 million people) reported drinking at risky levels (AIHW 2024b, Tables 4.25 and 4.26, Figure ALCOHOL3).
The 2022–2023 NDSHS found that:
- Males continued to be more likely than females to drink at risky levels (39% of males aged 14 and over and 23% of females aged 14 and over).
- Fewer younger people (those aged 14-17) drank alcohol at risky levels (5.5% in 2022–2023, compared with 9.5% in 2019) (AIHW 2024b, Table 4.28).
- People living in the lowest socioeconomic areas were the least likely to drink at risky levels (27% of people in the lowest quintile) (AIHW 2024b, Table 4.34).
The most recent National Health Survey (NHS) was conducted in 2022. Data for this release were collected against the 2020 Australian guidelines to reduce health risks from drinking alcohol. Estimates using self-reported data show that in 2022:
- More than 1 in 4 (26.8%) Australians aged 18 years and over exceeded the Australian Alcohol Guidelines. This includes people who consumed more than 10 drinks in the last week and/or consumed 5 or more drinks in any day at least monthly in the last 12 months.
- Men were more likely than women to exceed the guideline (35.8% compared with 18.1%)
- People born in Australia were more than twice as likely as those born overseas to exceed the guideline (33.0% compared with 16.0%) (ABS 2023b).
Figure ALCOHOL3: Alcohol consumption and risk, people aged 14 and over, by age and gender, 2007 to 2022–2023 (per cent) (per cent)
This line graph shows a long-term decrease in the proportion of people consuming 4 or more drinks on a single day at least monthly, across all age groups except those aged 30–39, 60–69 and 70+, where the proportion increased between 2001 and 2022–2023. Among those aged 40–49, the proportion remained stable. Over the same period, the compsumption of more than 10 standard drinks a week decreased moderately among all age groups except those aged 60–69, where the proportion increased slightly. The proportion of abstainers increased across all age groups less than 50, stablisied among those aged 50–459 and decreased among those aged over 60.
View data tables >
Geographic trends
In general, people living in Remote and very remote and Outer regional areas of Australia are more likely than people in Major cities to exceed risk guidelines.
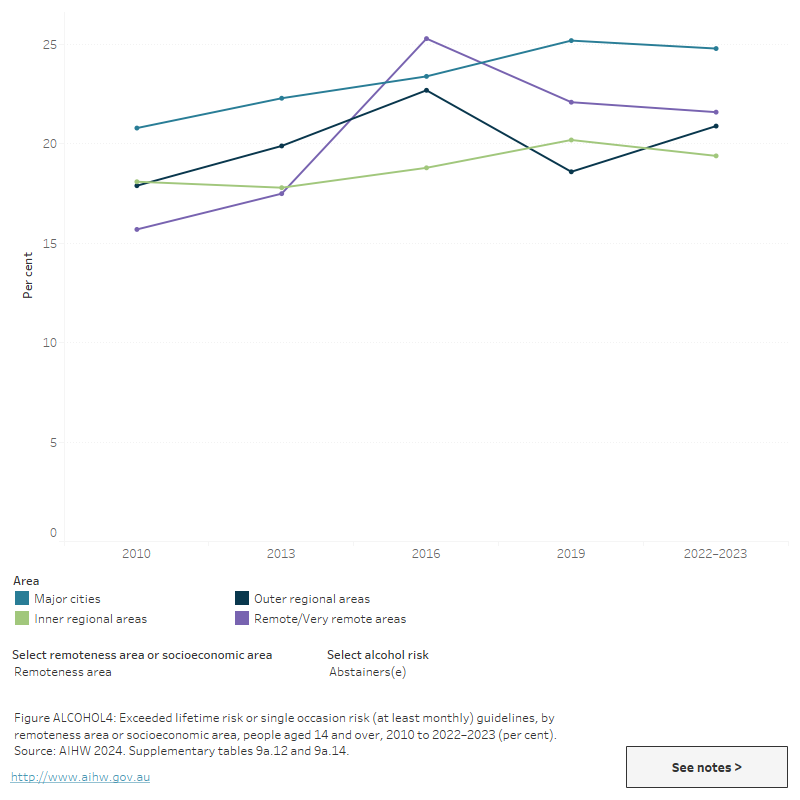
- The 2022–2023 NDSHS findings showed that people aged 14 or over living in Remote and Very remote areas (40%) and Outer regional areas (39%) are about 1.4 times more likely as those living in Major cities (29%) to consume alcohol at risky levels (Figure ALCOHOL4; AIHW 2024b, Table 4.34).
- The 2022 NHS results showed that adults (aged 18 or older) in Outer regional and Remote areas (30.9%) were more likely to drink at risky levels than those in Major cities (25.6%) (ABS 2023b, Table 6.3).
For information on alcohol consumption across states and territories, see the NDSHS ![]() State and territory data tables.
State and territory data tables.
Figure ALCOHOL4: Alcohol consumption risk, by remoteness area or socioeconomic area, people aged 14 and over, 2010 to 2022–2023 (per cent)
This line graph shows the proportion of people aged 14 and over by their alcohol risk level and remoteness area between 2010 and 2022–2023. The proportion of people exceeding risk guidelines has declined across all 5 remoteness areas and socioeconomic areas between 2010 and 2022–2023. In 2022–2023, the proportion of people exceeding risk guidelines was highest for those in the second quintile of socioeconoic status and in remote of very remote areas. The highest proportion of abstainers were in the first quintile of socioeconomic status and in major cities.
The National Wastewater Drug Monitoring Program measures the presence of substances in sewerage treatment plants across Australia. Alcohol is typically one of the most commonly detected substances monitored by the program. The estimated population-weighted average consumption of alcohol has fluctuated over the life of the Program in 2016, with current consumption levels lower than 2016 (ACIC 2024).
Data from Report 21 of the NWDMP showed that between April and August 2023, population-weighted average regional alcohol consumption exceeded consumption in capital cities. Additionally:
- Consumption levels fell slightly for regional areas and capital cities in August 2023, but are lower than at the beginning of the program in 2016 (ACIC 2024).
For state and territory data, see the National Wastewater Drug Monitoring Program reports.
Figure ALCOHOL5: Estimated consumption of alcohol in Australia based on detections in wastewater, April to August 2023

Alcohol is one of the most consumed drugs measured in wastewater

Alcohol consumption was slightly higher in regional areas than capital cities
Between April and August 2023, average consumptionᵃ of alcohol decreased in both Capital cities and in Regional sites
(a) 'Average consumption' refers to estimated population-weighted average consumption.
Note: April and August 2023 data are from 62 wastewater treatment sites, covering approximately 57% of the Australian population.
Source: AIHW, adapted from ACIC 2024.
Poly drug use
Poly drug use is defined as the use of mixing or taking another illicit or licit drug whilst under the influence of another drug. In 2019, the NDSHS showed more than 1 in 4 recent risky drinkers reported recent use of cannabis (27% for lifetime risky drinkers and 28% for single occasion risky drinkers). Around 1 in 5 reported that they were also daily smokers (21% for lifetime risky drinkers and 18.7% for single occasion risky drinkers) (AIHW 2020, Table 1.3).
Data on alcohol and other drug-related ambulance attendances are sourced from the National Ambulance Surveillance System (NASS). Monthly data for 2021and 2022 are currently available for New South Wales, Victoria, Queensland, Tasmania, and the Australian Capital Territory. It should be noted that some data for Tasmania and the Australian Capital Territory have been suppressed due to low numbers. For more information, please see the data quality statement.
In 2022, the proportion of alcohol intoxication-related ambulance attendances where multiple drugs were involved was low relative to other drug-related attendances, ranging from 15% of attendances in New South Wales to 20% of attendances in Australian Capital Territory (Table S1.11).
For related content on multiple drug involvement see Impacts: Ambulance attendances.
Harms
For related content on alcohol impacts and harms, see also:
Alcohol is absorbed rapidly in the bloodstream and affects the brain within about 5 minutes, though this may vary from person to person depending on body mass and general state of health (NSW Ministry of Health 2017). Short-term effects of alcohol such as a sense of relaxation and reduced inhibitions, may add to the appeal of its consumption. However, when consumed in excess, alcohol can also produce unpleasant effects such as nausea and vomiting and may influence people to engage in harmful behaviour (Table ALCOHOL1).
| Short-term effects | Long-term effects |
|---|---|
|
|
Source: NSW Ministry of Health (2017).
Burden of disease and injury
The Australian Burden of Disease Study 2018 found that alcohol use was the fifth highest risk factor contributing to the burden of disease in Australia and was responsible for 4.5% of the total burden of disease and injury (AIHW 2021, Table S2.3). The age-standardised rate of total attributable burden due to alcohol use decreased from 9.5 DALY per 1,000 population to 8.5 in 2018 (a 10.5 % decline from 2003 to 2018).
Alcohol use contributed to a number of diseases and injuries including:
- 100% of the burden due to alcohol use disorders
- 40% of the burden due to liver cancer
- 25% of the burden due to road traffic injuries involving motor vehicle occupants
- 19.2% of the burden due to chronic liver disease
- 14.2% of the burden due to suicide and self-inflicted injuries (AIHW 2021b, Table S2.4).
The 2022–2023 NDSHS reported those who consumed alcohol at risky levels (more than 10 standard drinks a week or more than 4 standard drinks in a single day at least once a month) were:
- 14 times as likely to experience an injury requiring medical attention while under the influence of alcohol (4.2% compared with *0.3%) as those who did not drink at risky levels
- 10.5 times as likely to have experienced an injury requiring admission to hospital while under the influence of alcohol (2.1% compared with *0.2%) (*Estimate has a relative standard error between 25% and 50% and should be used with caution) (AIHW 2024b, Table 4.52).
According to the 2022–2023 NDSHS, there is a growing number of women affected by other people’s alcohol use, specifically:
- Women were more likely to have experienced verbal abuse in 2022–2023 (17.6%) compared with 2019 (15.9%), while the rates for men fell from 19.6% to 17.6%.
- The proportion of women who experienced physical abuse from someone under the influence of alcohol increased from 4.0% in 2019 to 5.3% in 2022. For men it remained stable and was 5.2% in 2022–2023.
- The proportion of women who were put in fear increased between 2019 and 2022–2023, and they were 1.6 times as likely as men to have been put in fear in the previous 12 months. This is the highest disparity seen since the question was introduced in 2007 (AIHW 2024b, Table 4.54).
Alcohol consumption in pregnancy
Alcohol consumption during pregnancy can lead to poorer perinatal outcomes including low birthweight, pre-term birth and fetal alcohol spectrum disorder (FASD). The National Health and Medical Research Council (NHMRC) advises that women who are planning a pregnancy, or are pregnant, should not drink alcohol. Support to address alcohol consumption is available through antenatal clinics (AIHW 2023d).
In 2021, the AIHW’s National Perinatal Data Collection included data from 7 jurisdictions (data was not available for New South Wales). This data reporting mothers consumption of alcohol in the first 20 weeks of pregnancy, indicates that mothers were more likely to consume alcohol if they:
- lived in Very remote (7.1%) or Remote (4.6%) areas
- were Indigenous (7.5%)
- aged under 20 (4.6%) (AIHW 2023d).
Data from the 2022–2023 NDSHS show that over 1 in 4 (28%) pregnant women consumed alcohol at some stage during their pregnancy, similar to 29% in 2019 (AIHW 2024, Table 10.21). Of pregnant women who reported a period of time they were unaware of their pregnancy:
- 64% had consumed alcohol before knowing they were pregnant.
- *14.9% had consumed alcohol after knowing they were pregnant (AIHW 2024, Table 10.21).
*Estimate has a relative standard error between 25% and 50% and should be used with caution.
Ambulance attendances
Data on alcohol and other drug-related ambulance attendances are sourced from the National Ambulance Surveillance System (NASS).
The highest number and rate of ambulance attendances continues to be alcohol intoxication-related (Supplementary data table 12 and S2.10). Monthly data are presented from 2021 for people aged 15 years and over for New South Wales, Victoria, Queensland, Tasmania, the Australian Capital Territory and the Northern Territory.
In 2022, for alcohol intoxication-related ambulance attendances in these jurisdictions:
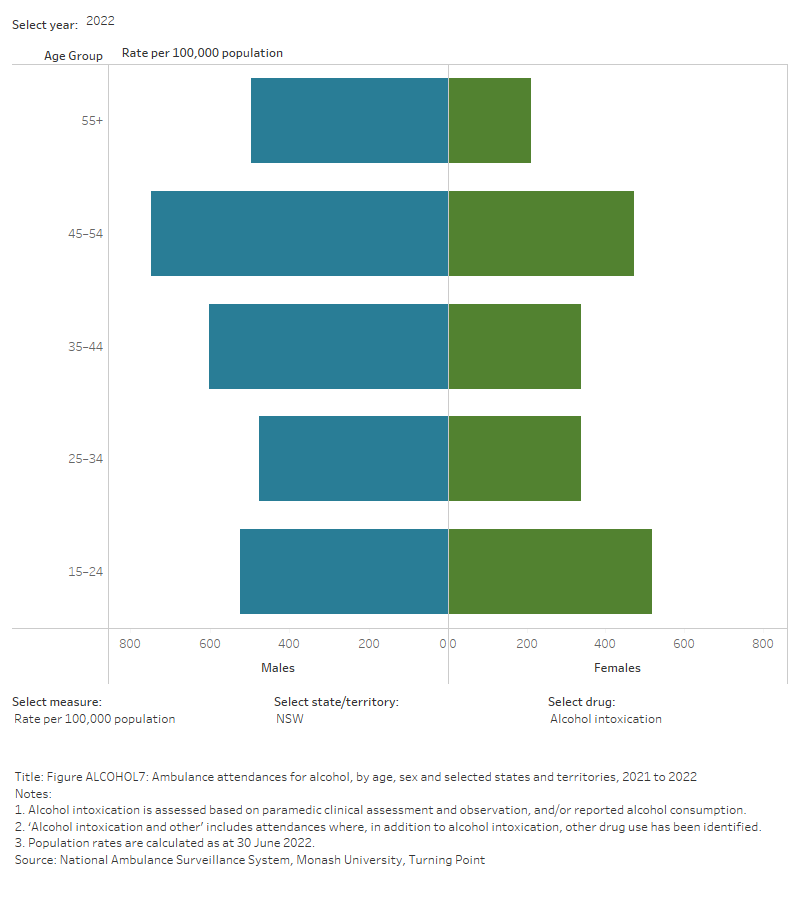
- Rates of attendances ranged from 444.3 per 100,000 population (29,641 attendances) in New South Wales to 2,598 (5,136 attendances) in the Northern Territory (Table S1.10).
For the 6 jurisdictions where alcohol and other drug-related ambulance attendance data are available for age and sex disaggregation (New South Wales, Victoria, Queensland, Tasmania, the Australian Capital Territory and the Northern Territory):
- 3 in 5 (59%) of total attendances were for males.
- The highest rates of attendances were for people aged:
- 45–54 in Queensland (828.7 per 100,000 population) and Tasmania (819.0 per 100,000 population)
- 15–24 in Tasmania (941.0 per 100,000 population) and Queensland (851.0 per 100,000 population) (Table S1.9).
For the 6 jurisdictions where monthly data from 2021 is available, between 2021 and 2022:
- Rates of alcohol intoxication-related ambulance attendances have decreased across all jurisdictions, with the exception of Tasmania.
- In Tasmania, rates of alcohol intoxication-related ambulance attendances have increased from 561.9 per 100,000 population in 2021 to 627.0 in 2022 (Figure ALCOHOL6, Table S1.10).
Figure ALCOHOL6: Ambulance attendances for alcohol, by age, sex and selected states and territories, 2021 to 2022
This figure shows alcohol-related ambulance attendances in NSW. The highest number of attendances were for males aged 55+. There is a filter to select year, state/territory, drug and measure (number of attendances or rate per 100,000 population).
Hospitalisations
Drug-related hospitalisations are defined as hospitalisations with a principal diagnosis relating to a substance use disorder or direct harm relating to use of selected substances (AIHW 2018).
AIHW analysis of the National Hospital Morbidity Database showed that alcohol accounted for more than half of drug-related hospitalisations in 2021–22 (59% or 80,300 hospitalisations). This represents a rate of 311.4 alcohol-related hospitalisations per 100,000 population (Table S1.15). Alcohol has remained the most common drug recorded in drug-related hospitalisations over the 7 years to 2021–22.
In 2021–22:
- Around 1 in 2 alcohol-related hospitalisations involved an overnight stay (52% or 41,300 hospitalisations), while the remainder ended with a same-day discharge.
- Males were more likely than females to be hospitalised; almost 3 in 5 alcohol-related hospitalisations (58% or 46,300 hospitalisations).
- 1 in 3 alcohol-related hospitalisations were people aged 55 years and over (31% or 24,700 hospitalisations) (Table S1.14).
- Almost 3 in 4 alcohol-related hospitalisations occurred in Major cities (73% or 58,300 hospitalisations) (Table S1.16).
- Alcohol-related hospitalisations were twice as likely in Remote and Very remote areas than in Major cities (Remote and Very remote areas 627.3 hospitalisations per 100,000 population, compared with 316.5 in Major cities).
In the 7 years to 2021–22:
- The number of alcohol-related hospitalisations increased between 2015–16 and 2020-21 (from 68,200 to 86,400 hospitalisations), before falling to 80,300 in 2021–22.
- Accounting for population growth, the rate of alcohol-related hospitalisations increased between 2015–16 and 2020-21 (from 284.3 to 337.1 per 100,000 population), then decreased in 2021–22 (311.4 per 100,000).
- The rate of alcohol-related hospitalisations in Remote and Very remote areas reflected the rates seen nationally, with a peak in 2020–21 (775.4 per 100,000), declining in 2021–22 (627.3 per 100,000).
Population estimates used to calculate rates for 2020–21 may have been impacted by public health measures introduced during the COVID-19 pandemic. For more information, see the Technical notes.
Alcohol-related injuries
The definitions of alcohol-related conditions in the following injury statistics are different to those reported elsewhere in this report; for methodology and definitions please see Alcohol-related injury: hospitalisations and deaths, 2019–20.
In 2019–20, alcohol-related injury hospitalisations accounted for 5.7% of all injury hospitalisations and 14% of all injury deaths.
Polydrug use was common in alcohol-related injuries, with 55% (16,400) of cases recording the presence of other drugs in addition to alcohol (AIHW 2023b).
Alcohol-related injury hospitalisations
In 2019–20 alcohol-related injuries resulted in 30,000 hospitalisations (118 per 100,000 population). The most common causes of alcohol-related injury hospitalisations were falls (39%), intentional self-harm (24%), assault (15%) and transport (7.2%) (AIHW 2023b).
Alcohol-related injury deaths
In 2019–20, there were 1,900 alcohol-related injury deaths (7.7 per 100,000 population). The most common causes of alcohol-related deaths were suicide (47%), accidental poisoning (26%) and transport (11%).
Among those who died due to alcohol-related injuries:
- 77% of deaths occurred among those aged 25–64 years of age
- males aged 45–64 had the highest number and rate of deaths (590 deaths and 19.5 per 100,000) (AIHW 2023b).
Deaths
Alcohol-induced deaths are defined as those that can be directly attributable to alcohol use (that is, where an alcohol-related condition is recorded as the underlying cause of death), as determined by toxicology and pathology reports (for example, alcoholic liver cirrhosis or alcohol poisoning). Alcohol-related deaths include deaths directly attributable to alcohol use and deaths where alcohol was listed as an associated cause of death (for example a motor vehicle accident where a person recorded a high blood alcohol concentration) (ABS 2018a).
In 2022, ABS Causes of Death reported 1,742 alcohol-induced deaths registered (1,245 males and 497 females) (ABS 2023a, Table 13.11), additionally:
- The alcohol-induced death rate for males was higher than females (8.7 per 100,000 population for males, compared with 3.4 deaths per 100,000 population for females) (ABS 2023a, Table 13.11).
- The highest age-specific rates were for 55–64 (17.5 per 100,000 population) and the lowest rates were for those aged 15–34 (0.8 per 100,000 population) (ABS 2023a, Table 13.12).
Around 9 in 10 (1,588 or 91%) alcohol-induced deaths were related to chronic conditions (including alcoholic liver cirrhosis). Acute alcohol-induced deaths (including alcohol poisoning) accounted for 154 deaths. Additionally:
- 72% of chronic alcohol-induced deaths were for males and 63% were in people aged 55 and over.
- 71% of acute alcohol-induced deaths were for males and 53% were in those aged between 45–64 years (ABS 2023a, Table 13.16).
Australian Institute of Health and Welfare (AIHW) analysis of the AIHW National Mortality Database showed that of the 1,742 alcohol-induced deaths registered in 2022:
- The highest age-specific rates were for older people—17.5 per 100,000 population for those aged 55–64 and 12.5 for those aged 45–54 (Table S1.4b).
- The majority (71%, or 1,245 deaths) were recorded for males (Supplementary Table S1.4a).
The most common associated cause of alcohol-induced death in 2022 was liver disease, followed by mental and behavioural disorders due to psychoactive substance use. Mental and behavioural conditions due to psychoactive substance use was the most common contributor to alcohol-related deaths (Table S1.6).
For more information, see also:
- Health impacts: Deaths due to harmful alcohol consumption.
- Older people: Health and harms
- Younger people: Health and harms
Treatment
The latest Alcohol and other drug treatment services in Australia: early insights report shows that alcohol continues to be the most common principal drug of concern (AIHW 2024a). Alcohol was the principal drug of concern in over 2 in 5 (43%) treatment episodes provided to people for their own drug use in 2022–23, stable from 42% in 2021–22.
Data collected for the AODTS NMDS (AODTS NMDS) are released twice each year: an early insights report in April and a detailed report mid-year. The section below will be updated with information from the annual report once these data become available.
The Alcohol and Other Drug Treatment Services National Minimum Data Set (AODTS NMDS) provides information on treatment provided to clients by publicly funded AOD treatment services, including government and non-government organisations. Data from the AODTS NMDS show that alcohol is the most common principal drug of concern among clients seeking treatment for their own drug use (AIHW 2023a).
In 2021–22, where alcohol was the principal drug of concern:
- 3 in 5 (61%) of clients were male and over 1 in 6 (17%) were Indigenous Australians (AIHW 2023a, tables SC.9 and SC.11; Figure ALCOHOL7)
- 26% of clients were aged 30–39 and 25% of clients were aged 40–49 and 26% were aged 30–39 (AIHW 2023a, Table SC.10)
- The most common source of referral was self/family (41% of treatment episodes), followed by health services (39%) (AIHW 2023a, Table Drg.13)
- The most common main treatment type was counselling (35% of treatment episodes), followed by assessment only (22%) and withdrawal management (14%). These 3 main treatment types have remained the most common over the 10-year period to 2021–22 (AIHW 2023a, Table Drg.18; Figure ALCOHOL7)
- The median treatment duration for alcohol was just over 4 weeks (29 days) (AIHW 2023a, Table Drg.21).
Figure ALCOHOL7: Treatment provided for own use of alcohol, 2021–22 (per cent)
Alcohol was the most common principal drug of concern (42% of treatment episodes)
1 in 6 clients were Indigenous Australians

Counselling was the most common main treatment type (over 1 in 3 episodes)
Source: AIHW 2023, tables Drg.1, SC.11 and Drg.18.
Where the principal drug of concern was alcohol, the proportion of clients who travelled one hour or longer to treatment services in 2016–17 was higher in Regional and remote areas than in Major cities (29% compared with 7%) (AIHW 2019).
Alcohol cessation medicines
Data from the Pharmaceutical Benefits Scheme (PBS) provide information on the number of prescriptions dispensed and the number of patients dispensed a script under supply of the PBS within a given financial year. The PBS database includes information on medicines that are used to help people stop alcohol consumption or maintain abstinence from alcohol (alcohol cessation medicines). For more information, refer to the Technical notes and Box PHARMS2.
Pharmacotherapy is recommended for all people experiencing moderate to severe alcohol use disorder in Australia and is best used in conjunction with psychosocial support (Haber & Riordan 2021). Data from the PBS indicate that approximately 101,000 scripts for alcohol cessation medicines were dispensed to 37,000 patients in 2021–22 (a rate of 390 scripts dispensed and 140 patients per 100,000 population) (tables PBS77–80). In 2021–22:
- Rates of alcohol cessation medicine dispensing were higher for males than females, and males aged 40–49 had the highest rates of scripts dispensed and patients of any group (around 965 scripts and 380 patients per 100,000 population) (tables PBS82 and PBS84).
- People aged 40–49 and 50–59 had the highest rates of dispensing of any age group (tables PBS82 and PBS84). Rates of dispensing were highest in Inner regional areas and dispensing varied between states and territories (tables PBS85–92). For more information, see Older people: Treatment.
- Rates of dispensing were highest in Inner regional areas and dispensing varied between states and territories (tables PBS85–92). For more information, see Data by region.
Between 2012–13 and 2020–21, rates of dispensing rose from 245 scripts and 90 patients to 390 scripts and 145 patients per 100,000 population (Supplementary tables PBS78 and PBS80).
At-risk groups
For related content on at-risk groups, see:
While alcohol is widely consumed in Australia, some population groups are at a greater risk of problematic consumption.
- The proportion of First Nations people exceeding lifetime and single occasion risk guidelines is slightly higher than that of non-Indigenous Australians. There has been an increase in the proportion of First Nations people Australians who exceeded single occasion risk guidelines for drinking between 2002 and 2018–19.
- People aged 70 and over are the most likely to drink alcohol daily and those aged 50–59 were one of the age groups most likely to exceed the lifetime risk guideline.
- People aged 18–24 were the most likely to exceed the single occasion risk guideline, at least monthly.
- A higher proportion of people with a mental health condition reported drinking at risky levels (for both lifetime and single occasion risk) compared with people who had not been diagnosed or treated for a mental health condition.
Policy context
National Alcohol Strategy 2019–2028
The National Alcohol Strategy aims to provide a national framework to prevent and minimise alcohol-related harms among individuals, families and communities by:
- Identifying agreed national priority areas of focus and policy options;
- Promoting and facilitating collaboration, partnership and commitment from the government and non-government sectors
- Targeting a 10% reduction in harmful alcohol consumption
- Alcohol consumption at levels that puts individuals at risk of injury from a single occasion of drinking, at least monthly.
- Alcohol consumption at levels that puts individuals at risk of disease or injury over a lifetime (Department of Health 2019).
For more information, see the National Alcohol Strategy 2019–2028
Policy support for measures to reduce problems associated with alcohol
Findings from the 2022–2023 NDSHS found the proportion of people who thought excessive alcohol consumption was the drug of most concern for the general community increased from 26% in 2019 to 31% in 2022–2023 (AIHW 2024b, Table 11.5).
The NDSHS included questions aimed at measuring the level of public support for policies to reduce problems associated with alcohol. In 2022–2023, public support declined for the majority of measures to reduce the harms from alcohol. The policies with the most support to reduce alcohol related harm were:
- more severe penalties for drunk driving (81%)
- the stricter enforcement of the law against supplying alcohol to minors (77%).
The least supported policy measure was to increase the price of alcohol (25%) (AIHW 2024b, Table 4.68).
ABS (Australian Bureau of Statistics (2017). Household Expenditure Survey, Australia: Summary of Results, 2015-16. ABS cat. no. 6530.0. Canberra: ABS. Viewed 4 January 2018
ABS (2018). Causes of Death, Australia, 2017. ABS cat. no. 3303.0. Canberra: ABS. Viewed 12 October 2018.
ABS (2023a), Causes of Death, Australia, ABS Website, accessed 19 October 2023.
ABS (2023b) National Health Survey, ABS Website, accessed 3 January 2024.
ACIC (Australian Criminal Intelligence Commission) (2024) National Wastewater Drug Monitoring Program Report 21. Canberra: ACIC, accessed 14 March 2024.
AIHW (Australian Institute of Health and Welfare) (2018). Drug related hospitalisations. Cat. no. HSE 220. Canberra: AIHW. Viewed 18 August 2021.
AIHW (2019). Alcohol and other drug use in regional and remote Australia: consumption, harms and access to treatment, 2016–17. Cat. no. HSE 212. Canberra: AIHW. Viewed 15 March 2019.
AIHW (2021). Australian Burden of Disease Study: Impact and causes of illness and death in Australia 2018, AIHW, Australian Government. doi:10.25816/5ps1-j259
AIHW (2023a). Alcohol and other drug treatment services in Australia annual report Cat. No. HSE 250. Canberra: AIHW, accessed 21 June 2023.
AIHW (2023b). Alcohol-related injury: hospitalisations and deaths, 2019-20. AIHW, Australian Government, accessed 21 March 2023.
AIHW (2023c). Apparent Consumption of Alcohol. AIHW, Australian Government, accessed 17 October 2023.
AIHW (2023d). Australia's mothers and babies, AIHW, Australian Government, accessed 29 June 2023.
AIHW (2024a) Alcohol and other drug treatment services in Australia: early insights. AIHW, Australian Government, accessed 16 April 2024.
AIHW (2024b) National Drug Strategy Household Survey 2022–2023. AIHW, accessed 22 February 2024.
DoH (Department of Health) (2019). National alcohol strategy 2019–2028. Canberra: DoH. Viewed 8 January 2020.
Haber PS and Riordan PC (2021) Guidelines for the Treatment of Alcohol Problems (4th edition), Sydney: Specialty of Addiction Medicine, Faculty of Medicine and Health, The University of Sydney.
NHMRC (National Health and Medical Research Council) 2009. Australian guidelines to reduce health risks from drinking alcohol. Canberra: NHMRC. Viewed 12 October 2017.
NHMRC 2020. Australian guidelines to reduce health risks from drinking alcohol. Accessed 7 April 2022.
NSW Ministry of Health (2017) A quick guide to drugs & alcohol, 3rd edn. Sydney: National Drug and Alcohol Research Centre.
OECD (Organisation for Economic Co-operation and Development) 2022. OECD Health Statistics 2022. Paris: OECD, accessed 13 October 2022.